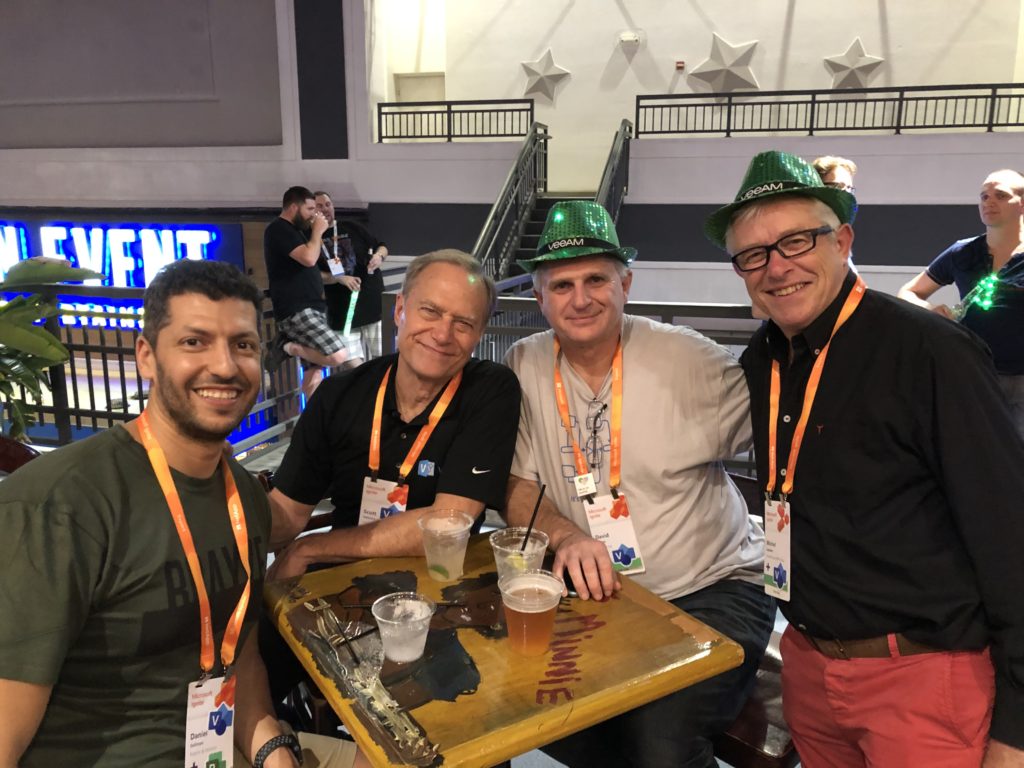
Microsoft Ignite 2019 at the huge Orange County Conference Conference Center in Orlando is over for another year. 30,000 attendees over 6 days, and I have seen my first sunlight today since I arrived in Florida last Saturday! So, it is time to review just what was announced about Visio, and how much Visio is appreciated.
bVisual Blog by David Parker
PowerApps in PowerBI with Visio!!!
I am very excited to see that the preview for PowerApps in PowerBI has been released ( see Announcing availability of PowerApps custom visual for Power BI (preview) ). I saw this demonstrated months ago, and have been waiting impatiently ever since. Every time I have embedded a Visio diagram into PowerBI, I have wanted to display the selected shape data in a detail view … and now I can!
I cannot yet create a PowerBI report with the embedded PowerApps visual for consumption by the whole internet, but it should still solve many scenarios for organisations. I quickly added the new PowerApps visual to my example synchronised Org Chart and Desk Layout from my previous article ( #Visio in #PowerBI for viewing personnel hierarchies and locations ) , and recorded a simple selection in the following gif:
To do this, I simply created a default new PowerApps app from the queryOrg query in Excel workbook I created previously, and modified the Item value for the DetailForm of the DetailScreen. I removed the BrowseScreen and EditScreen because they were not required. Then, hey presto, the correct record is displayed whenever a shape is selected.
Visio in PowerBI for viewing personnel hierarchies and locations
My last article, Aliasing Data Columns for #Visio Organization Chart Wizard , mentioned the slight anomalies in the default Shape Data rows for the Organization Chart shapes and the Resources / Person shape. This prompted me to create an alternative view of the same data that can be linked to the Person shapes on a floor plan, and then to use the preview Visio Custom Visual in Power BI to display both views of personnel synchronised by the same data. This demonstrates how easy it is to create an effective dashboard for locating personnel locations and their position within an organisational hierarchy at the same time!
Three short Visio 2016 video tutorials
I recently created three short videos for Microsoft about the most popular uses of Visio, and utilizing some of the latest features:
- How to create an Org Chart
- How to create a Process Flow Diagram
- Creating a Network Chart
They are all less than 5 minutes long, and you don’t see me fortunately.
Watch them on YouTube :
Visio Shape Data Linking Tips
I often use the Microsoft supplied OrgData.xls sample file to demonstrate linking to external data in Visio, however there are a few gotchas lying in wait for the unwary if you try to link to the Microsoft supplied Org Chart shapes …
In the following screenshot, I have the OrgData table showing in the External Data window and I have the ShapeSheet open for the selected Executive Belt shape. Notice that the Shape Data section rows are all black which indicates that they are inherited from the master shape. Also note that there is a Shape Data row with the label “E-Mail” in the ShapeSheet, and one called “E-mail” in the Personnel table.
Flags of the World
I was recently asked how to add a country flag to Visio Org Chart shapes automatically. Well, as I am currently working with world data at the moment, I have taken up the challenge. Firstly, the CIA have an excellent source of information, called the World Factbook ( https://www.cia.gov/library/publications/the-world-factbook/ ). You can find all sorts of information about every country in the world, including, of course, their flags. There are over 240 countries at the moment, and there are various codes used by different systems to identify them. Even the name may not be the same, for example, do I live in UK, United Kingdom, Great Britain, United Kingdom of Great Britain and Northern Ireland or just plain old England? Answers on a post card, please, addressed to …..?
Alternatively, a country can be identified accurately with a code, but you need to know which system is being used. United Kingdom can be identified by GB in the Iso 2 character system, or 826 in the Iso numeric system, or UK in the FIPS 10 system. The CIA World Factbook utilises the FIPS 10 code, so consequently, all of the country related web pages and images are coded with this system.
I have already created an Access database with all this information, so I decided to use this knowledge to create a Flags of the World Visio Master.