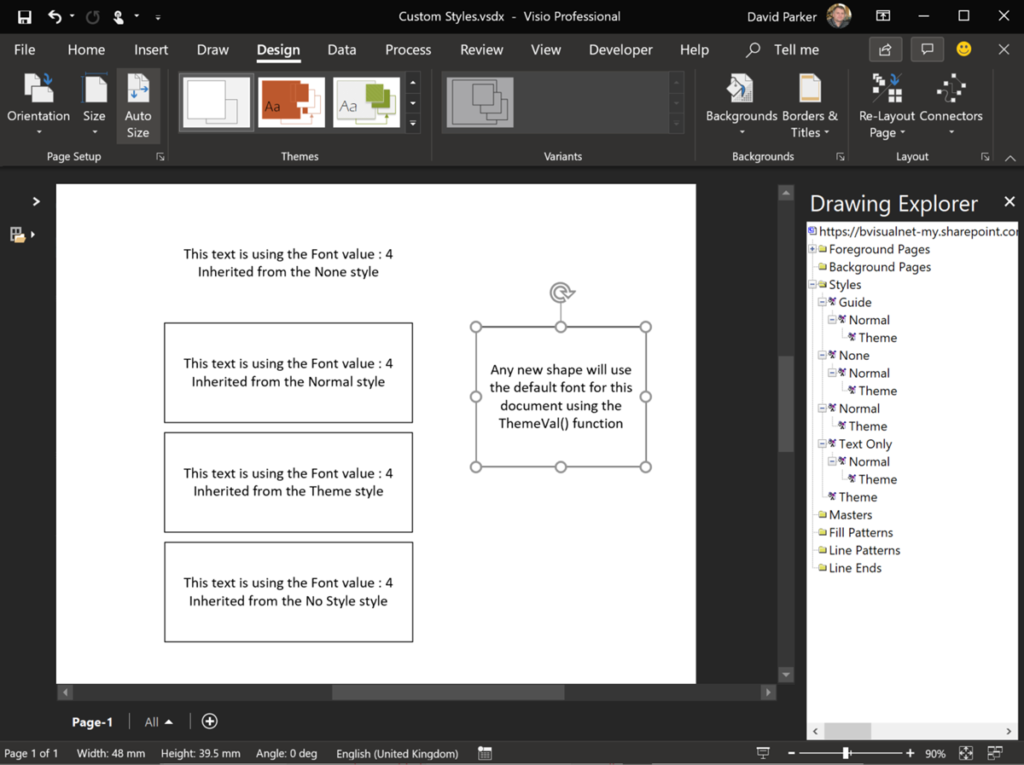
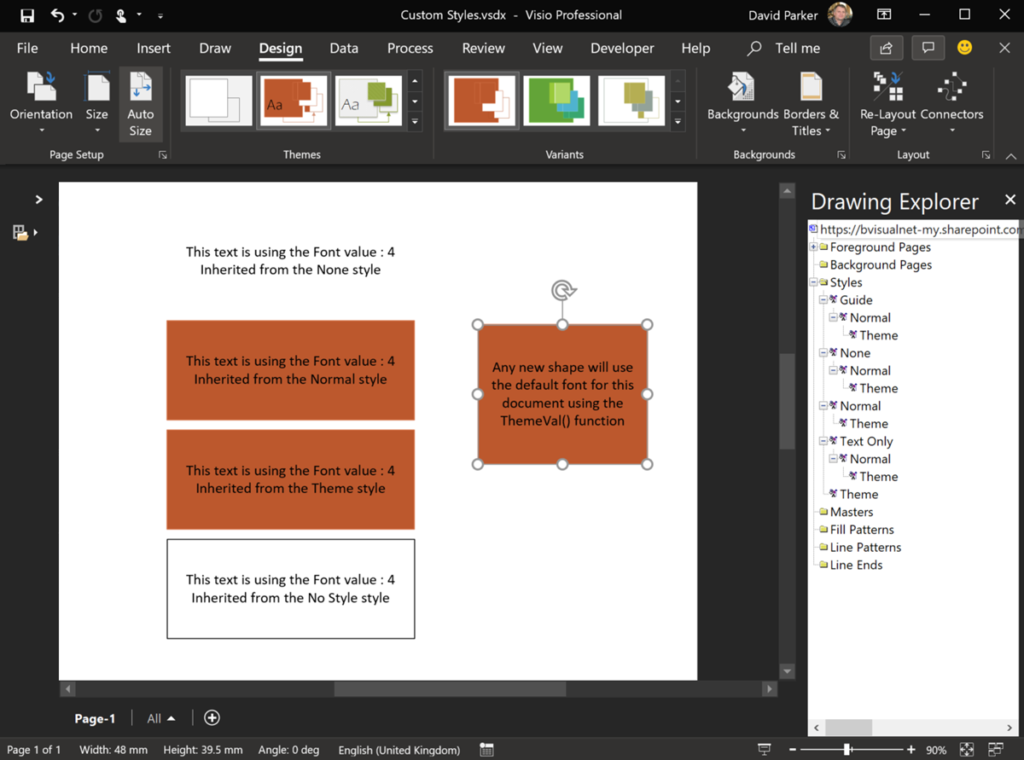
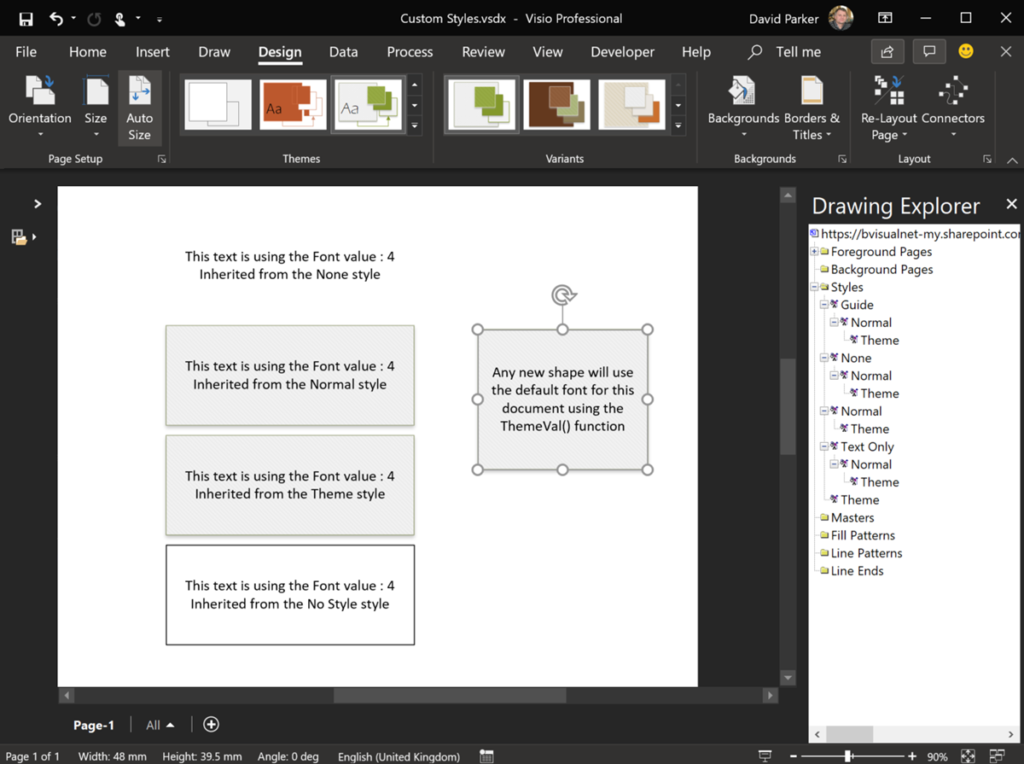
I am working on a Visio project where the client wants to be able to configure the font used in each document. These documents have many custom masters, but the user can add there own annotations too. Therefore, I needed to find a way to synchronise the fonts used in both cases. Visio has Themes and Variants, and some of these built-in settings use different fonts, but there is no way of editing the fonts used in each theme since Office 2010 ( see Create a custom theme). There have been many questions on the web about changing the default font used in Visio, which is currently Calibri, but there were no easy answers found. Visio used to use Styles rather than Themes, and these capabilities are still there, but the buttons are not displayed in the default ribbon. However, the Drawing Explorer window does show the Styles and their hierarchies.
[Read more…] about Using an Updateable Default Font in VisioVisio
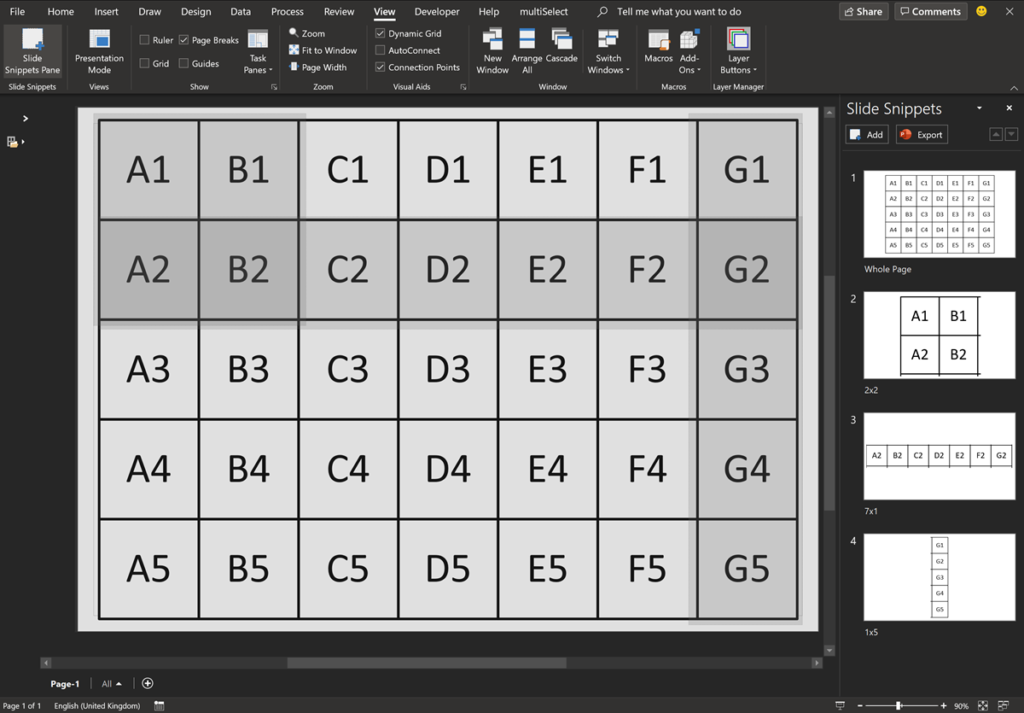
Manual Fix for Slide Snippets in Visio Plan 2
Microsoft Visio Plan 2 has a cool feature, Slide Snippets, that can create a PowerPoint slide show from special rectangle shapes placed around the pages of a Visio document. Unfortunately, there is currently an issue with distortion of the images in PowerPoint, so I will show how this can be fixed manually…
Getting the Microsoft Office Theme Value
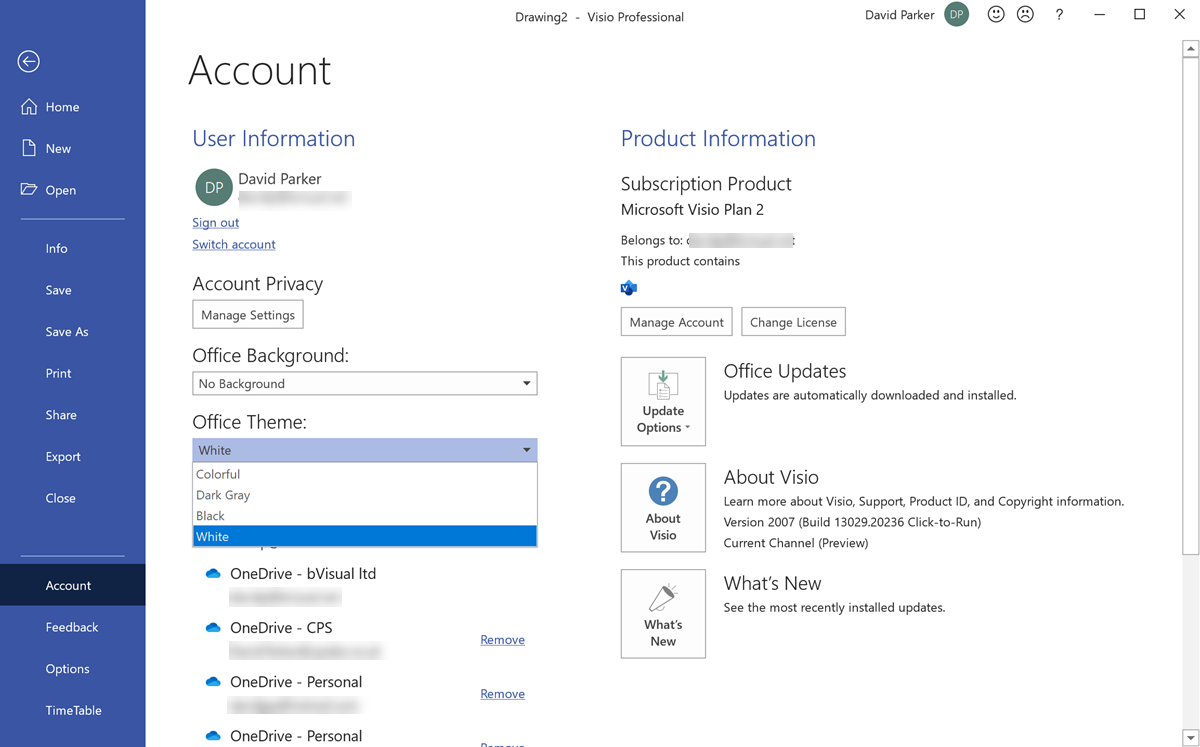
I am working on a Visio VSTO project where I need to synchronise a UI element with the current session Microsoft Office Theme. At first, I thought that there would be some way of getting a value from the Visio object model, but I was wrong…
The Office Theme can be selected from either the Visio Options, or the Account Options panels.
[Read more…] about Getting the Microsoft Office Theme Value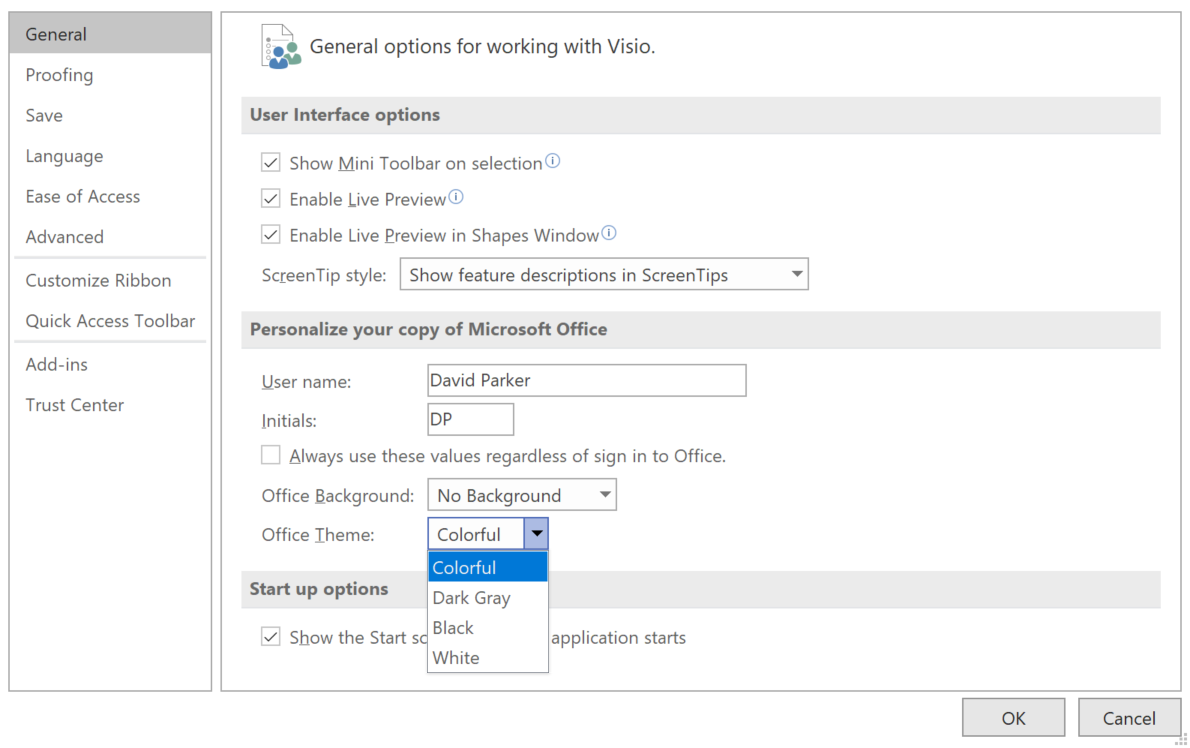
Learn how to create custom Visio web app templates
I have now finished three articles about the differences between the Visio desktop and web apps, and how you can already create custom templates for Visio Plan 1.
Comparing Visio for the Web and Desktop
Customising Visio shapes for the web app
Key differences between the Visio desktop and web apps
Register for my webinar Providing Custom Templates for Visio web app
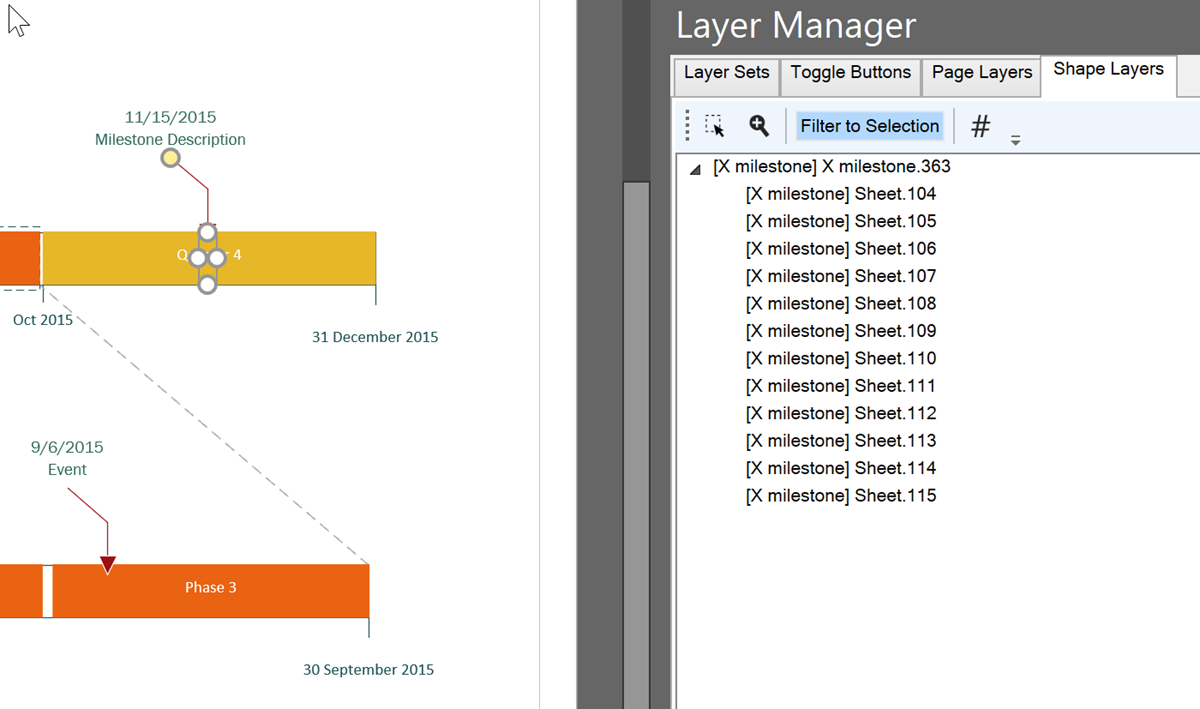
Assigning Visio Shapes to Layers from Excel Table
I work a lot with layers in Visio, and written an add-in, LayerManager, to assist, but I was asked an interesting question recently: How can shapes by assigned to layers automatically from a list in Excel? So, I thought I would present my solution. This particular request was for a Timeline diagram, where the Milestone shapes are to be on specific layers. So, I just used one of the samples provided with Visio.
[Read more…] about Assigning Visio Shapes to Layers from Excel Table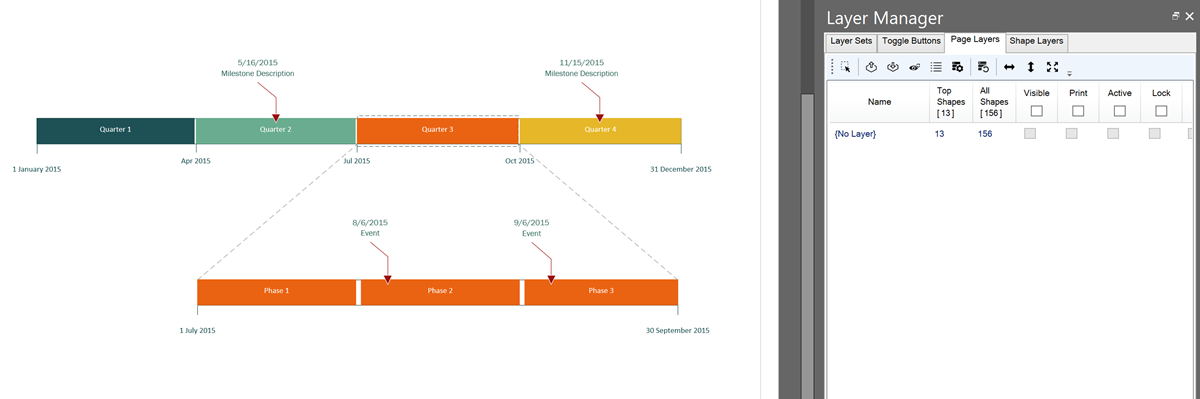
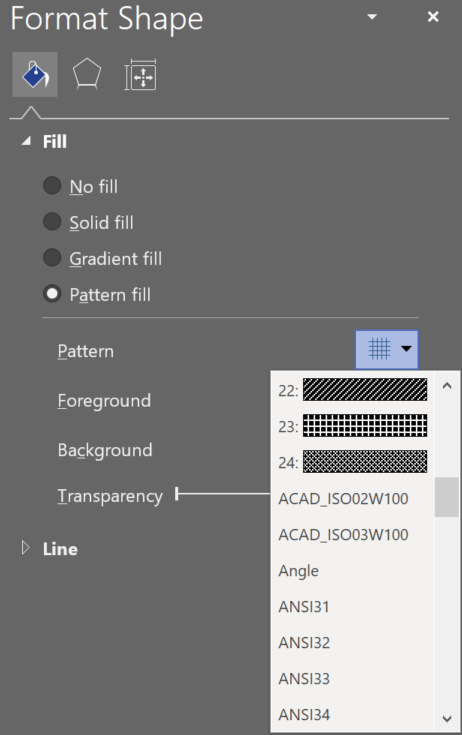
Viewing the Visio Custom Line & Fill Patterns
I was trying to review the appearance of the custom line and fill patterns in Visio, but was annoyed that they are only displaying a name without a preview image. I could not find them easily on the web either, so I thought I would list them here, with images. These custom patterns are available in three Microsoft-provided stencils in the Visio Extras category.