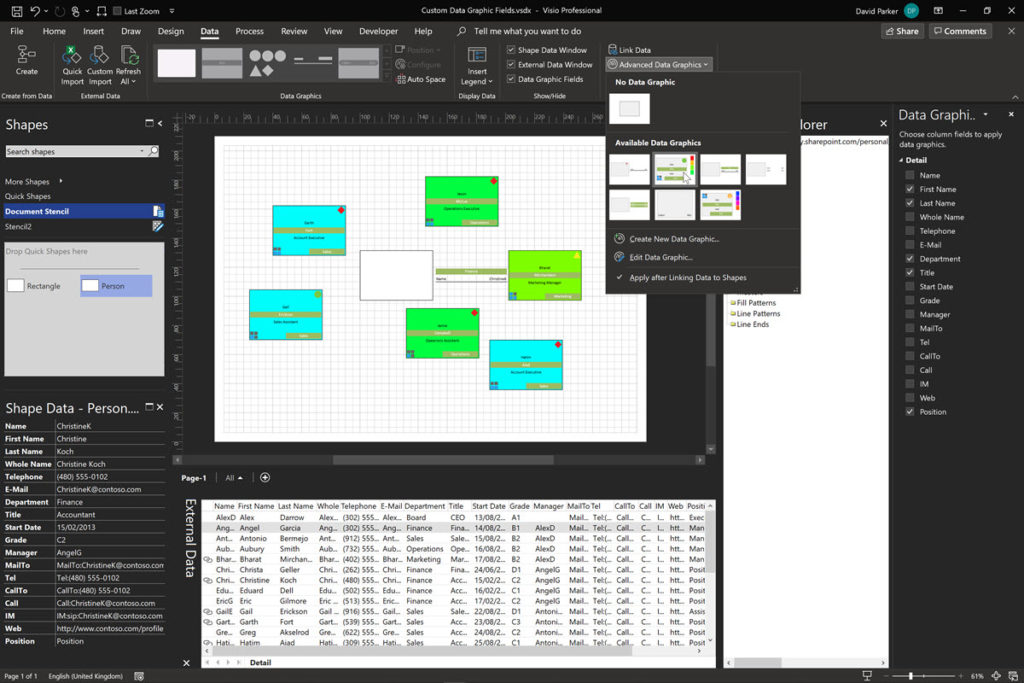
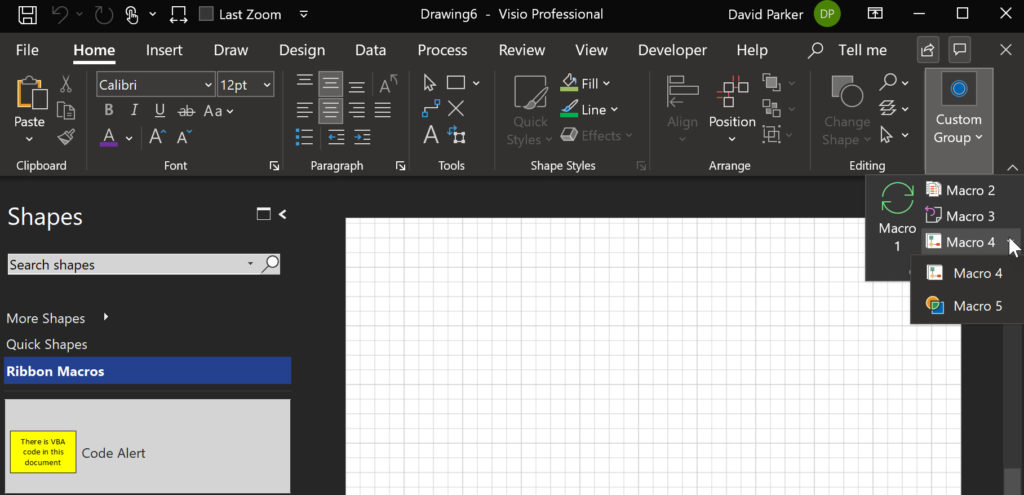
I was recently asked about switching between different Visio Data Graphics within a page, so I thought I should record a few short videos to explain how Visio Data Graphics work, how they can be edited and duplicated, and how to automate switching between them.