The Web Content Access Guidelines (WCAG) 2.0 provides the current recommendations for making web content accessible to users with vision impairment, but how do you test if your Visio shapes pass? There are several web sites out there that provide this capability, but all of them require the HEX values, rather than the RGB or HSL that Visio provides natively. Therefore, I have created a Visio callout shape that can be associated with a target shape to report on the values of each of its main color elements and provides hyperlinks to automatically check the contrast ratio on WebAIM.
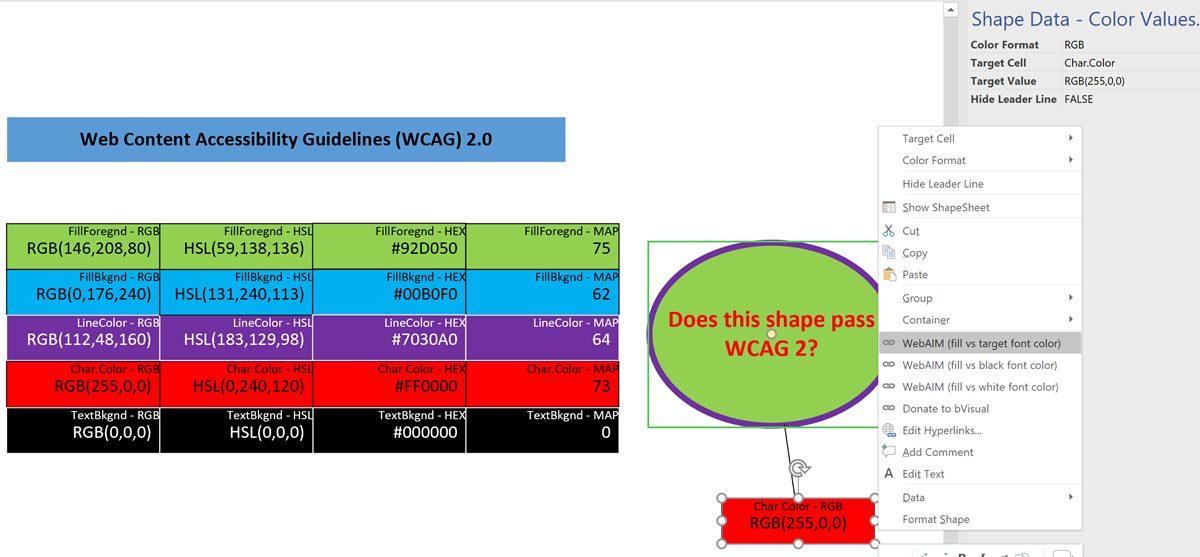
The colour formats that can be selected from either the Shape Data window or the right mouse menu are: