Everyone knows that you can change the colour of Visio shapes. Most people know that you can also change the fill pattern too.
ShapeSheet Formulas

Automating Area and Perimeter Length Shape Data
[UPDATE: Microsoft introduced a new function into Visio 2010 called PATHLENGTH(…), so some of the following is now not required. See Automatic Line and Segment Lengths in Visio )
Another newsgroup question has asked about automating the update of shape area and perimeter lengths. Now, this is an area (no pun intended) that I am most interested in because I used to do a lot of space planning. Visio Professional does include Space and Boundary shapes on the Resources stencil that use an add-in to update the area, but does nothing about the perimeter length. These shapes do highlight some of the issues to be considered though…
- Visio pages can be scaled, and indeed the various floor plan and site layout templates in Visio are pre-scaled. Most templates are not scaled, and therefore default to 1:1 scale.
- Visio measures everything internally in inches, although you can display in almost whatever units you choose.
- The Visio Application object has a handy ConvertResult (StringOrNumber, UnitsIn, UnitsOut) method, which can be used for linear and area measurements … and can also be used for date and times.
- Visio can store decimal numbers to a very high degree of precision (I counted 14 decimal places), but you almost always want to format the display.
- Visio can call a method in a VBA project when the values in specified cells are changed.
- It is easy to display Shape Data in a shape, either by using Data Graphics or by Insert Field
[Read more…] about Automating Area and Perimeter Length Shape Data
Visio 2010 Developer References
By now, some of you will have downloaded the Visio 2010 Beta, and may even have downloaded the Visio Automation Reference and ShapeSheet Reference files. You may the, like me, wondered how to actually view the contents of these two hxs files? Well, fortunately, Stephanie Horn from the Visio team at Microsoft as able to help, so I thought that I would pass it on to you. (Remember these files are still beta, but they do contain some useful information).
Once you download and unpack the files, you will end up with two files called Visio2010AutoRef.hxs and Visio2010ShapeSheetRef.hxs. You can view them with any HxS viewer, but the download site suggests replacing the existing versions of these files and viewing them through Visio help. To do this:
1. Rename the files VISIO.DEV.HXS and VISIO.SHAPESHEET.HXS, respectively, and put them in your Office141033 directory (i.e., C:Program FilesMicrosoft OfficeOffice141033).
2. Open Visio, and launched help (F1).
3. Pick “Developer Reference” or “Visio ShapeSheet Help” in the Search pull-down menu.

I suggest turning on “Show Table of Contents” using the book icon in the toolbar, so you can navigate through the help topics.
Introducing celMaker 2
I was recently asked to provide a new version of celMaker that works with Visio 2007 and Excel 2007, so I got my old VB6 code out of SourceSafe and upgraded it so that I could run it on my Vista 64 laptop too. I also decided that I would release this version to the public as freeware because I have added no new features.So, what is celMaker? And where can you download it?
Last one first … you can download it from here : http://www.bvisual.net/products/celMaker/publish.htm (under review)
Most Visio users will have the components, so you can just click the Launch link.
1. Introduction
celMaker is a developer(ish) tool for Visio which allows the most often used sections of a Visio ShapeSheet to be copied into an Excel spreadsheet, or from an Excel spreadsheet onto a Visio master.
This means that the Visio Shape designer can create one master with its Shape Data (nee Custom Properties), User Cells, Actions, Smart Tags, Controls and Connection Points, and then save this to an Excel spreadsheet for backup, verification, discussions, documentation or transfer to another Master.
The Excel spreadsheet can be created manually or by reverse engineering existing Visio masters.
celMaker is provided as a stand alone executable that requires both Visio and Excel to be running, and can be used for many different types of diagram projects.
Importing KML Files into Visio
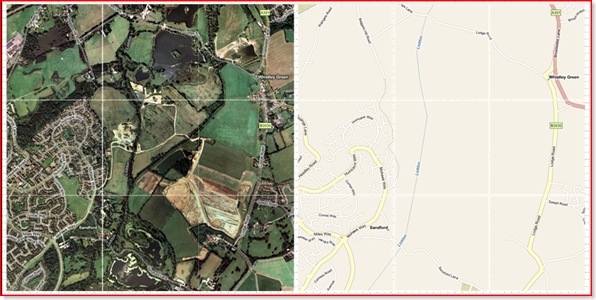
In my last blog, I demonstrated how you can import a map image from Maps Live, and calibrate it in preparation for importing any KML files into it (Moving Between Visio and KML). In this blog, I will complete the import of KML files exported from Maps Live.
I created two base map images in Visio, side by side, so that I can demonstrate that the import can be done to any prepared image, anywhere in Visio. Of course, you could have the two images on top of each other, on different layers, so that you can switch between Road and Aerial view by just changing the visibility of their layers.
In my demonstration, I have prepared a KML file with an area (polygons), three paths (linestrings) and three pushpins (points). You may spot that there are only two shown on each map, well, that is because I have put a filter in the import to only bring in those parts that are within the map image boundary.
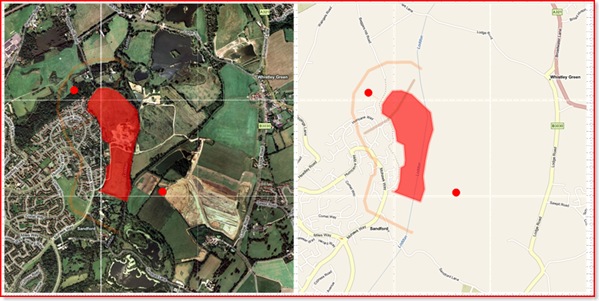
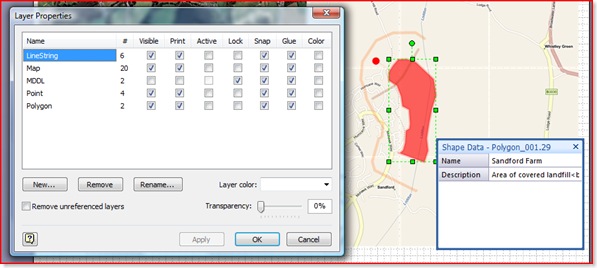
In addition to the geometry for each shape, I have added Shape Data/Custom Properties and assigned the different types of shapes on to discrete layers in Visio.
In order to convert the KML files into Visio, I had to choose how the different types of Placemarks are to be represented:
Getting the Map
Firstly, you need to get the size and position of the selected map shape and read its Shape Data/Custom Properties in order to understand the extents of the earth under consideration. Then the only difficulty was transforming the geometry from longitudes/latitudes of each Placemark relative to the selected map shape.
If shpMap.CellExists(“Prop.MinLon”, Visio.visExistsAnywhere) = 0 Then
MsgBox “Please select a map shape”
Exit Sub
End If
Dim nod As MSXML2.IXMLDOMNode
Set nod = xdoc.SelectSingleNode(“//kml/Document/Placemark/name”)
If Not nod Is Nothing Then
setProp shpMap, “Name”, “Name”, 0, “””” & nod.Text & “”””
Else
setProp shpMap, “Name”, “Name”, 0, “”
End If
Set nod = xdoc.SelectSingleNode(“//kml/Document/Placemark/description”)
If Not nod Is Nothing Then
setProp shpMap, “Description”, “Description”, 0, “””” & nod.Text & “”””
Else
setProp shpMap, “Description”, “Description”, 0, “”
End If
Dim dWidth As Double
dWidth = shpMap.Cells(“Width”).ResultIU
Dim dHeight As Double
dHeight = shpMap.Cells(“Height”).ResultIU
Dim dLeft As Double
dLeft = shpMap.Cells(“PinX”).ResultIU – shpMap.Cells(“LocPinX”).ResultIU
Dim dBottom As Double
dBottom = shpMap.Cells(“PinY”).ResultIU – shpMap.Cells(“LocPinY”).ResultIU
Dim dMinLon As Double
dMinLon = shpMap.Cells(“Prop.MinLon”).ResultIU
Dim dMinLat As Double
dMinLat = shpMap.Cells(“Prop.MinLat”).ResultIU
Dim dMaxLon As Double
dMaxLon = shpMap.Cells(“Prop.MaxLon”).ResultIU
Dim dMaxLat As Double
dMaxLat = shpMap.Cells(“Prop.MaxLat”).ResultIU
Collecting the Styles, etc
Every Placemark created by the export from Maps Live to KML has a corresponding Style element for its line color, weight and transparency and fill color and transparency. These values are stored separately within the KML file created by Maps Live (note that this is not necessary in the KML specification, and some tools do export the style information within the Placemark element).
Dim i As Integer
Dim j As Integer
Dim styles As MSXML2.IXMLDOMNodeList
Dim style As MSXML2.IXMLDOMElement
Dim dicStyles As New Dictionary
‘Collect the styles into a dictionary
Set styles = xdoc.getElementsByTagName(“Style”)
For i = 1 To styles.Length
Set style = styles.Item(i – 1)
setStyle style, dicStyles
Next i
Dim name As String
Dim description As String
Dim styleUrl As String
Dim aStyle(2) As String
Dim lineStyleColor As String
Dim lineStyleWidth As String
Dim polyStyleColor As String
Dim placemark As MSXML2.IXMLDOMElement
Dim vertexes As Variant
Dim shpNew As Visio.Shape
Dim xyArray() As Double
Areas (Polygons)
The choice of geometry type was pretty straight forward because Visio has a DrawPolyline(…) method for a Page object, so, after converting from lonlats to Visio geometry, the ShapeSheet looks something like this:
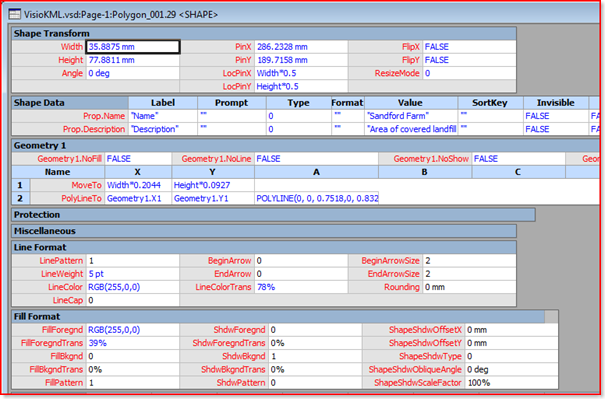
The partial code that achieves this is shown below:
Dim polygons As MSXML2.IXMLDOMNodeList
Dim polygon As MSXML2.IXMLDOMElement

    'Loop thru the polygons
Set polygons = xdoc.getElementsByTagName("Polygon")
addLayer shpMap.ContainingPage, "Polygon"
For i = 1 To polygons.Length
Set polygon = polygons.Item(i - 1)
setCoords polygon, vertexes
For j = 0 To UBound(vertexes, 2)
ReDim Preserve xyArray(1 To ((j + 1) * 2))
xyArray(((j + 1) * 2) - 1) = dLeft + ((CDbl(vertexes(0, j) - dMinLon) / (dMaxLon - dMinLon)) * dWidth)
xyArray((j + 1) * 2) = dBottom + ((CDbl(vertexes(1, j) - dMinLat) / (dMaxLat - dMinLat)) * dHeight)
Next j

        'Ensure that the shape starts or ends within the map shape
If shpMap.HitTest(xyArray(1), xyArray(2), 0) > 0 _
And shpMap.HitTest(xyArray(UBound(xyArray) - 3), xyArray(UBound(xyArray) - 2), 0) > 0 Then
Set placemark = polygon.ParentNode
setAttribs placemark, name, description, styleUrl
lineStyleColor = dicStyles(Mid(styleUrl, 2))(0)
lineStyleWidth = dicStyles(Mid(styleUrl, 2))(1)
polyStyleColor = dicStyles(Mid(styleUrl, 2))(2)
Set shpNew = shpMap.ContainingPage.DrawPolyline(xyArray, 0)
shpNew.Cells("LineColor").FormulaU = "=RGB(" & HexToDecimal(Mid(lineStyleColor, 7, 2)) & _
"," & HexToDecimal(Mid(lineStyleColor, 5, 2)) & "," & HexToDecimal(Mid(lineStyleColor, 3, 2)) & ")"
shpNew.Cells("LineColorTrans").FormulaU = "=" & CInt(HexToDecimal(Mid(lineStyleColor, 1, 2)) * 100 / 255) & " %"
shpNew.Cells("LineWeight").FormulaU = "=" & lineStyleWidth & " pt"
shpNew.Cells("FillForegnd").FormulaU = "=RGB(" & HexToDecimal(Mid(polyStyleColor, 7, 2)) & _
"," & HexToDecimal(Mid(polyStyleColor, 5, 2)) & "," & HexToDecimal(Mid(polyStyleColor, 3, 2)) & ")"
shpNew.Cells("FillForegndTrans").FormulaU = "=" & CInt(HexToDecimal(Mid(polyStyleColor, 1, 2)) * 100 / 255) & " %"
shpNew.name = "Polygon_" & Format(i, "000")
setProp shpNew, "Name", "Name", 0, """" & name & """"
setProp shpNew, "Description", "Description", 0, """" & description & """"
shpMap.ContainingPage.Layers("Polygon").Add shpNew, 0
End If
Next i
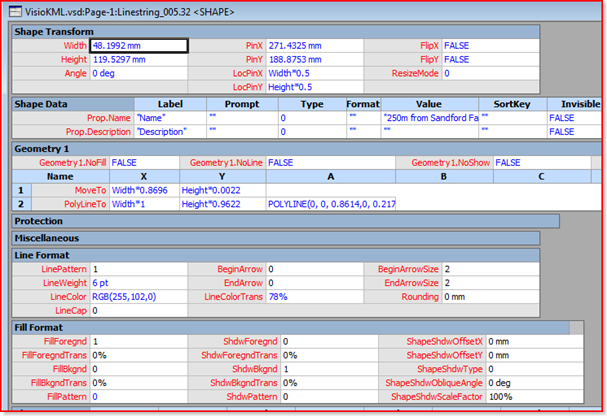
Paths (LineStrings)
I decided to use the DrawPolyline method for LineStrings too, however, I discovered there is a bug in Visio that means that a Polyline with NoFill set to True cannot be found by SpatialNeighbors. This is important because I plan to use the SpatialNeighbors function later for exporting Kml. However, I found a workaround, which is to set the NoFill to False, but to set the FillPattern to 0 (None).
Dim linestrings As MSXML2.IXMLDOMNodeList
Dim linestring As MSXML2.IXMLDOMElement

    Set linestrings = xdoc.getElementsByTagName("LineString")
addLayer shpMap.ContainingPage, "LineString"
For i = 1 To linestrings.Length
Set linestring = linestrings.Item(i - 1)
setCoords linestring, vertexes
For j = 0 To UBound(vertexes, 2)
ReDim Preserve xyArray(1 To ((j + 1) * 2))
xyArray(((j + 1) * 2) - 1) = dLeft + ((CDbl(vertexes(0, j) - dMinLon) / (dMaxLon - dMinLon)) * dWidth)
xyArray((j + 1) * 2) = dBottom + ((CDbl(vertexes(1, j) - dMinLat) / (dMaxLat - dMinLat)) * dHeight)
Next j

        'Ensure that the shape starts or ends within the map shape
If shpMap.HitTest(xyArray(1), xyArray(2), 0) > 0 _
And shpMap.HitTest(xyArray(UBound(xyArray) - 1), xyArray(UBound(xyArray)), 0) > 0 Then
Set placemark = linestring.ParentNode
setAttribs placemark, name, description, styleUrl
'Exclude the MDL shape, if present
If Not name = MDDLName Then
lineStyleColor = dicStyles(Mid(styleUrl, 2))(0)
lineStyleWidth = dicStyles(Mid(styleUrl, 2))(1)
Set shpNew = shpMap.ContainingPage.DrawPolyline(xyArray, 0)
shpNew.Cells("LineColor").FormulaU = "=RGB(" & HexToDecimal(Mid(lineStyleColor, 7, 2)) & _
"," & HexToDecimal(Mid(lineStyleColor, 5, 2)) & "," & HexToDecimal(Mid(lineStyleColor, 3, 2)) & ")"
shpNew.Cells("LineColorTrans").FormulaU = "=" & CInt(HexToDecimal(Mid(lineStyleColor, 1, 2)) * 100 / 255) & " %"
shpNew.Cells("LineWeight").FormulaU = "=" & lineStyleWidth & " pt"
shpNew.name = "Linestring_" & Format(i, "000")
setProp shpNew, "Name", "Name", 0, """" & name & """"
setProp shpNew, "Description", "Description", 0, """" & description & """"
'A Polyline with NoFill set to True cannot be found by SpatialNeighbors
shpNew.Cells("Geometry1.NoFill").FormulaU = False
shpNew.Cells("FillPattern").FormulaU = 0
shpMap.ContainingPage.Layers("LineString").Add shpNew, 0
End If
End If
Next i
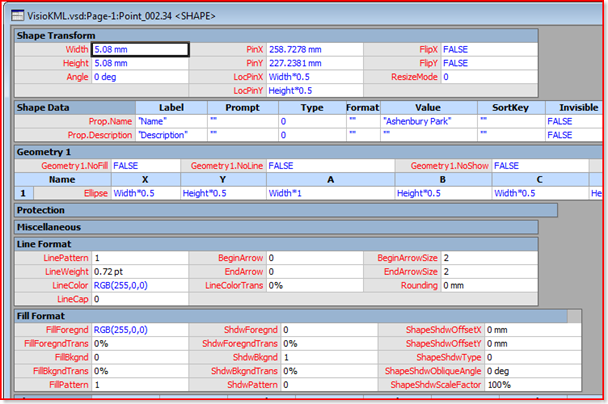
PushPins (Points)
I could have considered translating a pushpin as an instance of a Visio master, but I thought that I would keep it simple (for now) and use the DrawEllipse function. Of course, you need to do a little displacement to account for PinX/Y of the ellipse being in the centre of the shape.
Dim pins As MSXML2.IXMLDOMNodeList
Dim pin As MSXML2.IXMLDOMElement
Const PinRadius As Double = 0.1
Set pins = xdoc.getElementsByTagName(“Point”)
addLayer shpMap.ContainingPage, “Point”
For i = 1 To pins.Length
Set pin = pins.Item(i – 1)
setCoords pin, vertexes
For j = 0 To UBound(vertexes, 2)
ReDim Preserve xyArray(1 To ((j + 1) * 2))
xyArray(((j + 1) * 2) – 1) = dLeft + ((CDbl(vertexes(0, j) – dMinLon) / (dMaxLon – dMinLon)) * dWidth)
xyArray((j + 1) * 2) = dBottom + ((CDbl(vertexes(1, j) – dMinLat) / (dMaxLat – dMinLat)) * dHeight)
Next j
‘Ensure that the shape is within the map
If shpMap.HitTest(xyArray(1), xyArray(2), 0) > 0 Then
Set placemark = pin.ParentNode
setAttribs placemark, name, description, styleUrl
Set shpNew = shpMap.ContainingPage.DrawOval(xyArray(1) – PinRadius, xyArray(2) + PinRadius, _
xyArray(1) + PinRadius, xyArray(2) – PinRadius)
shpNew.Cells(“LineColor”).FormulaU = “=RGB(255,0,0)”
shpNew.Cells(“FillForegnd”).FormulaU = “=RGB(255,0,0)”
shpNew.name = “Point_” & Format(i, “000”)
setProp shpNew, “Name”, “Name”, 0, “””” & name & “”””
setProp shpNew, “Description”, “Description”, 0, “””” & description & “”””
shpMap.ContainingPage.Layers(“Point”).Add shpNew, 0
End If
Next i
Finally
Just to finish off neatly, I returned the selection to the original target map shape
Visio.ActiveWindow.DeselectAll
Visio.ActiveWindow.Select shpMap, Visio.VisSelectArgs.visSelect
Well, that completes my demonstration of how you can import KML files into Visio, although there are some refinements and additions that one can make. For example, it would be fairly trivial to create hyperlinks on each shape for any moreInfoUrl or photoUrl elements that are found.
I have uploaded the Visio file and sample KML file for downloading from : VisioKML.zip
I have started looking at creating KML files from Visio now…..
Hyperlinks to SharePoint Lists from Visio Shapes
My previous post showed how to link Visio Timelines to a SharePoint Calendar ( http://bvisual.spaces.live.com/blog/cns!3350D61BC93733A9!552.entry ), and I glibbly mentioned how you can create hyperlinks automatically on the shapes from the SharePoint list. Well, that was true, but the example shown goes to a SharePoint page, and it didn’t work. So, I feel I need to demonstrate a fix for it.

[Read more…] about Hyperlinks to SharePoint Lists from Visio Shapes