• Skip to main content
  • Skip to primary sidebar
  • Skip to footer

bVisual

  • Home
  • Services
    • How Visio smartness can help your business
    • Visio visual in Power BI
    • Visio Consulting Services
    • Visio Bureau Services
    • Visio Training and Support Services
  • Products
    • Visio Shape Report Converter
    • SS Plus
    • LayerManager
    • visViewer
    • Metro Icons
    • Rules Tools for Visio
    • The Visio 2010 Sessions App
    • Multi-Language Text for Visio
    • Document Imager for Visio
    • multiSelect for Visio
    • pdSelect for Visio
  • Case Studies
    • Case studies overview
    • Using Visio in Education for GIS
    • Visualizing Construction Project Schedules
    • Visio Online Business Process Mapping
    • Nexans Visio Template
    • CNEE Projects, WorldCom
    • Chase Manhattan Bank
  • News
    • Recent news
    • News archive
  • Resources
    • Articles➡
      • ShapeSheet Functions A-Z
      • Comparing Visio for the Web and Desktop
      • Customising Visio Shapes for the Web App
      • Key differences between the Visio desktop and web apps
      • Using the Visio Data Visualizer in Excel
      • Using Visio in Teams
      • Creating Visio Tabs and Apps for Teams with SharePoint Framework (SPFx)
      • Designing Power Automate Flows with Microsoft Visio
      • Innovative uses of Visio Lists
    • Webcasts ➡
      • Visio in Organizations
      • My session and other Visio sessions at MSIgnite 2019
      • Power up your Visio diagrams
      • Vision up your Visio diagrams
      • The Visio 2010 MVP Sessions
    • Visio Web Learning Resources
    • Books➡
      • Visualize Complex Processes with Microsoft Visio
      • Mastering Data Visualization with Microsoft Visio
      • Microsoft Visio Business Process Diagramming and Validation
      • Visualizing Information with Microsoft Visio
  • Blog
    • Browse blog articles
    • Visio Power BI articles
    • Visio for Web articles
    • A history of messaging and encryption
  • About us
    • About bVisual
    • Testimonials
    • Bio of David Parker
    • Contact Us
    • Website Privacy Policy
    • Website terms and conditions
    • Ariba Network

Shape Design

Published on January 10, 2019 by David Parker

Replacing Images in Visio Shapes by Changing Data

I wrote an article last year about Swapping Images in a #Visio Shape manually, but I want to be able to do this whenever a Shape Data value changes. This is because I use I invariably use shapes linked to data. I also want to be able to have multiple images within a single grouped shape, and all of them changing when their referenced Shape Data values change. I believe that this will be more adaptable for a lot of scenarios than trying to repurpose Data Graphic Icon Sets ( see  Make Your Own Visio Data Graphic Icons Sets … automatically). I also discovered that the Shape.ChangePicture(…) function can just as easily work with urls as it can with network file paths, so even more possibilities are opened up! For example, the Visio Online JavaScript API has the ability to overlay an image (see ShapeView.addOverlay(…)).
So, I have created some macros to provide quick and easy selection, positioning and updating of images within a group shape.
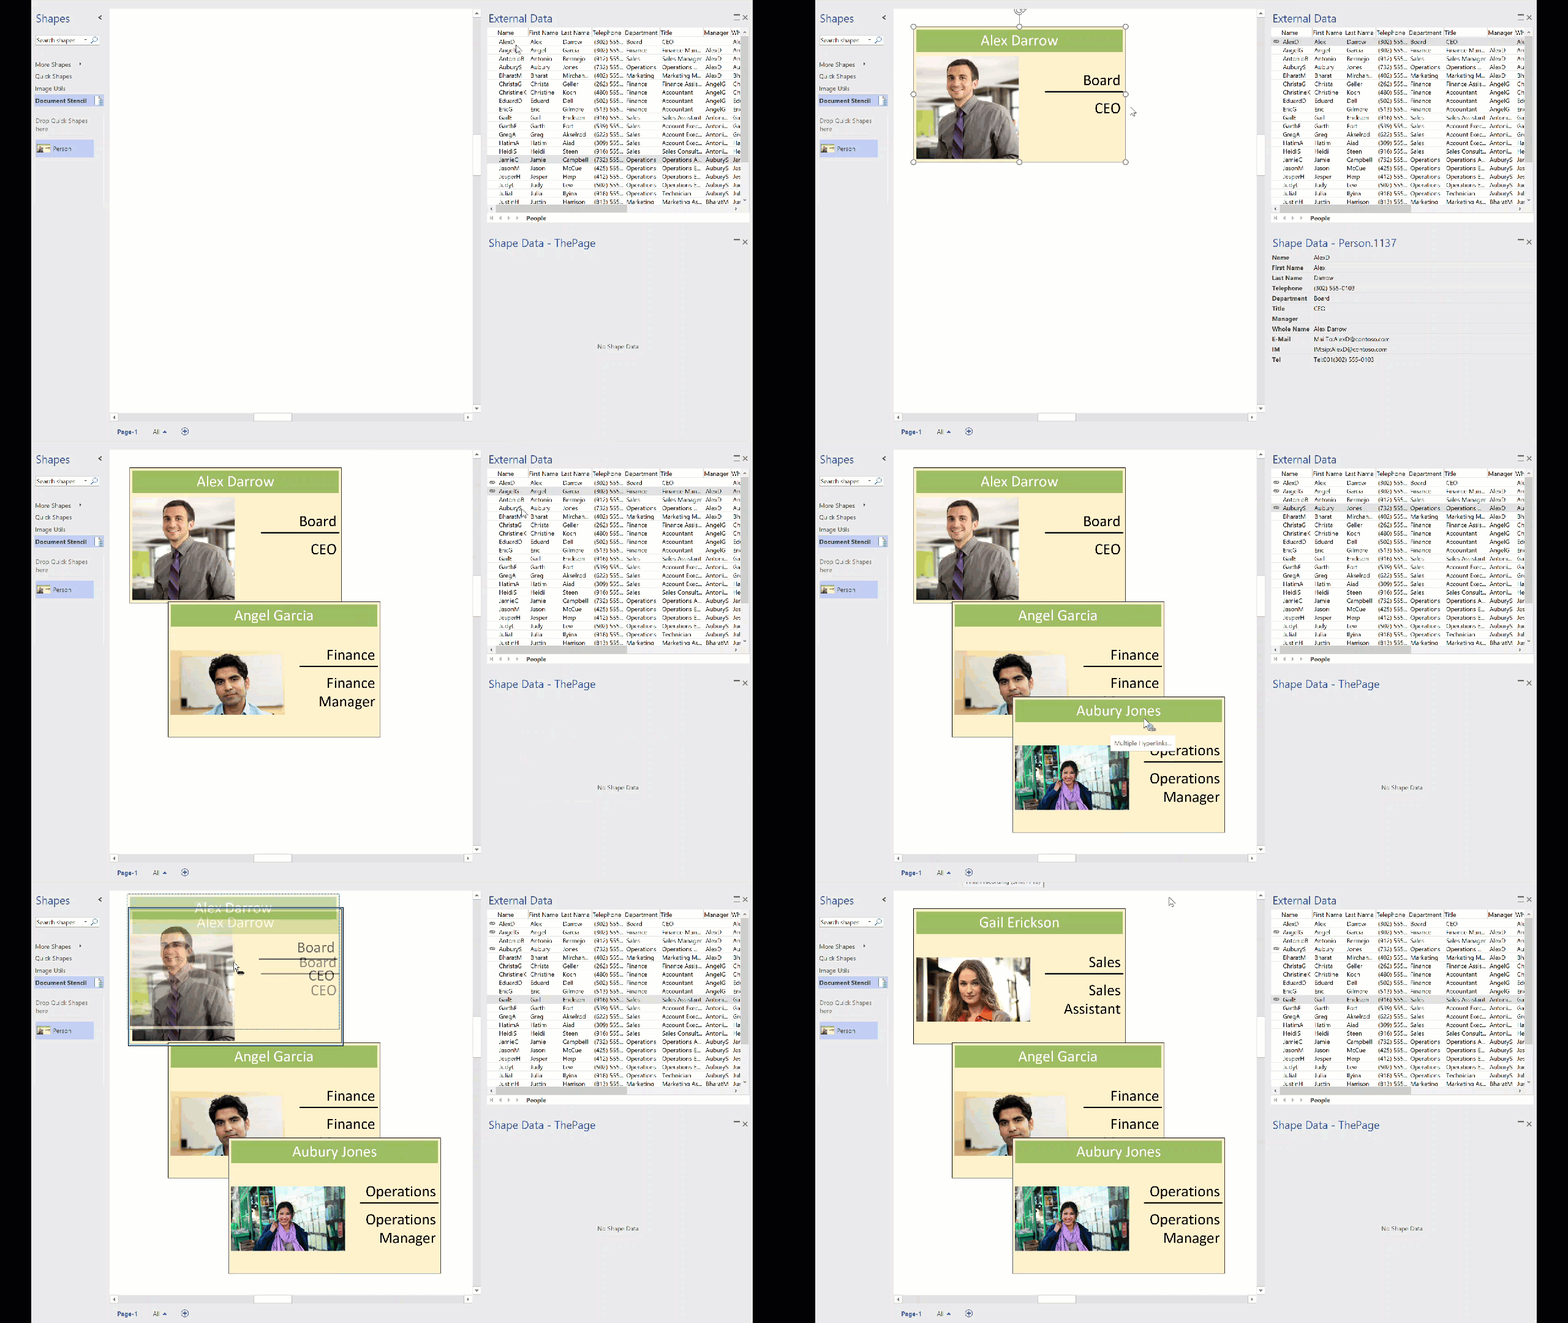
personphotosbydata


I decided to present this article with VBA code rather than my preferred C# so that a stencil could be downloaded to provide instant usability, rather than having to install an add-in. It can be download from Image Utils.vssm, and should then be placed in to My Shapes folder, so that it becomes available to open in Visio. When it is opened, then the macros will need to be enabled.
There are just five public macros:
[Read more…] about Replacing Images in Visio Shapes by Changing Data

Filed Under: Excel, External Data, Geographic, Images, Org Charts, Shape Data, VBA, Visio Tagged With: Link Data to Shapes, Macros, ShapeSheet, VBA

Published on December 13, 2018 by David Parker

Controlling Visio layers with linked data

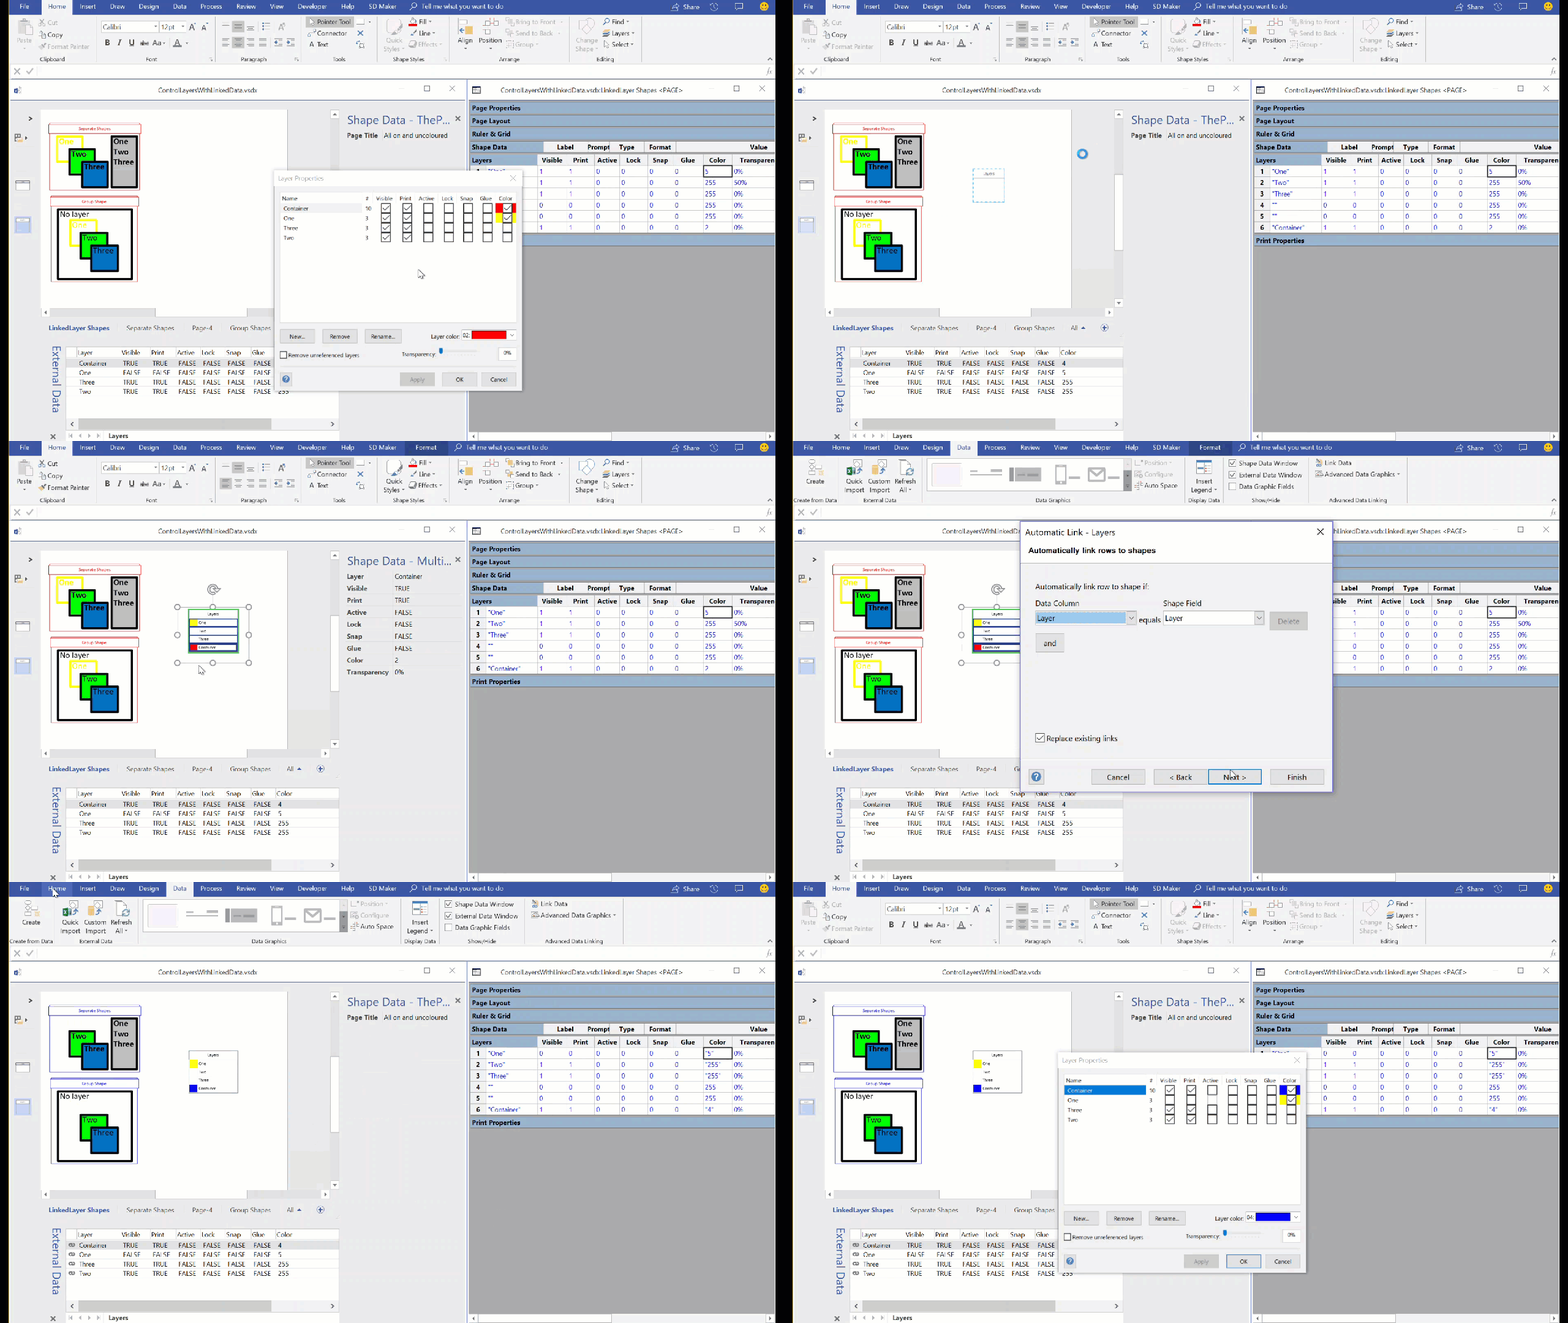
Readers of my blog will know that I use the layers in Visio pages to change the display for different scenarios. My macro to toggle layers on/off has been very popular, and I have written an add-in to manage layers that is widely used. However, I was recently asked if the layer settings can be controlled from linked data. Linking data in Visio has been available in all desktop editions, except Standard, since 2007, and I have written many articles and two books extolling this feature, but I haven’t so far controlled layer settings with it, so this article describes how this can be done … as shown in the following screen recording!

UpdatingLayersFromData
[Read more…] about Controlling Visio layers with linked data

Filed Under: Layers, Shape Data, ShapeSheet Formulas, Visio Tagged With: Layers

Published on October 24, 2018 by David Parker

Fixing the Layers problem with Callouts in Visio

I recently re-discovered an issue with callouts in Visio for a couple of projects that I am working on, and so I had to find a fix. The problem is that the callouts become dis-associated from their target shapes if either the layer visibility of the callout or the target shape is toggled off, and then back on again. This will result in a diagram with shapes without any connected callouts, so moving any of the target shapes will not move their associated callouts with them! I initially came up with a workaround that involved some jiggery-pokery with sub-shapes and layers, but it seems that the problem could have easily been averted if Microsoft had incorporated one specific User-defined Cell from the very start…


First, I should be clear which callouts I am talking about because the word has been used and abused over the years … This article refers to the callouts that are inserted from the Insert / Diagram Parts ribbon group. These are part of the Structured Diagrams concept that was introduced with Visio 2010.

[Read more…] about Fixing the Layers problem with Callouts in Visio

Filed Under: Callouts, Layers, Visio Tagged With: Callouts, ShapeSheet

Published on July 31, 2018 by David Parker

Enhancing the Built-In Containers in Visio

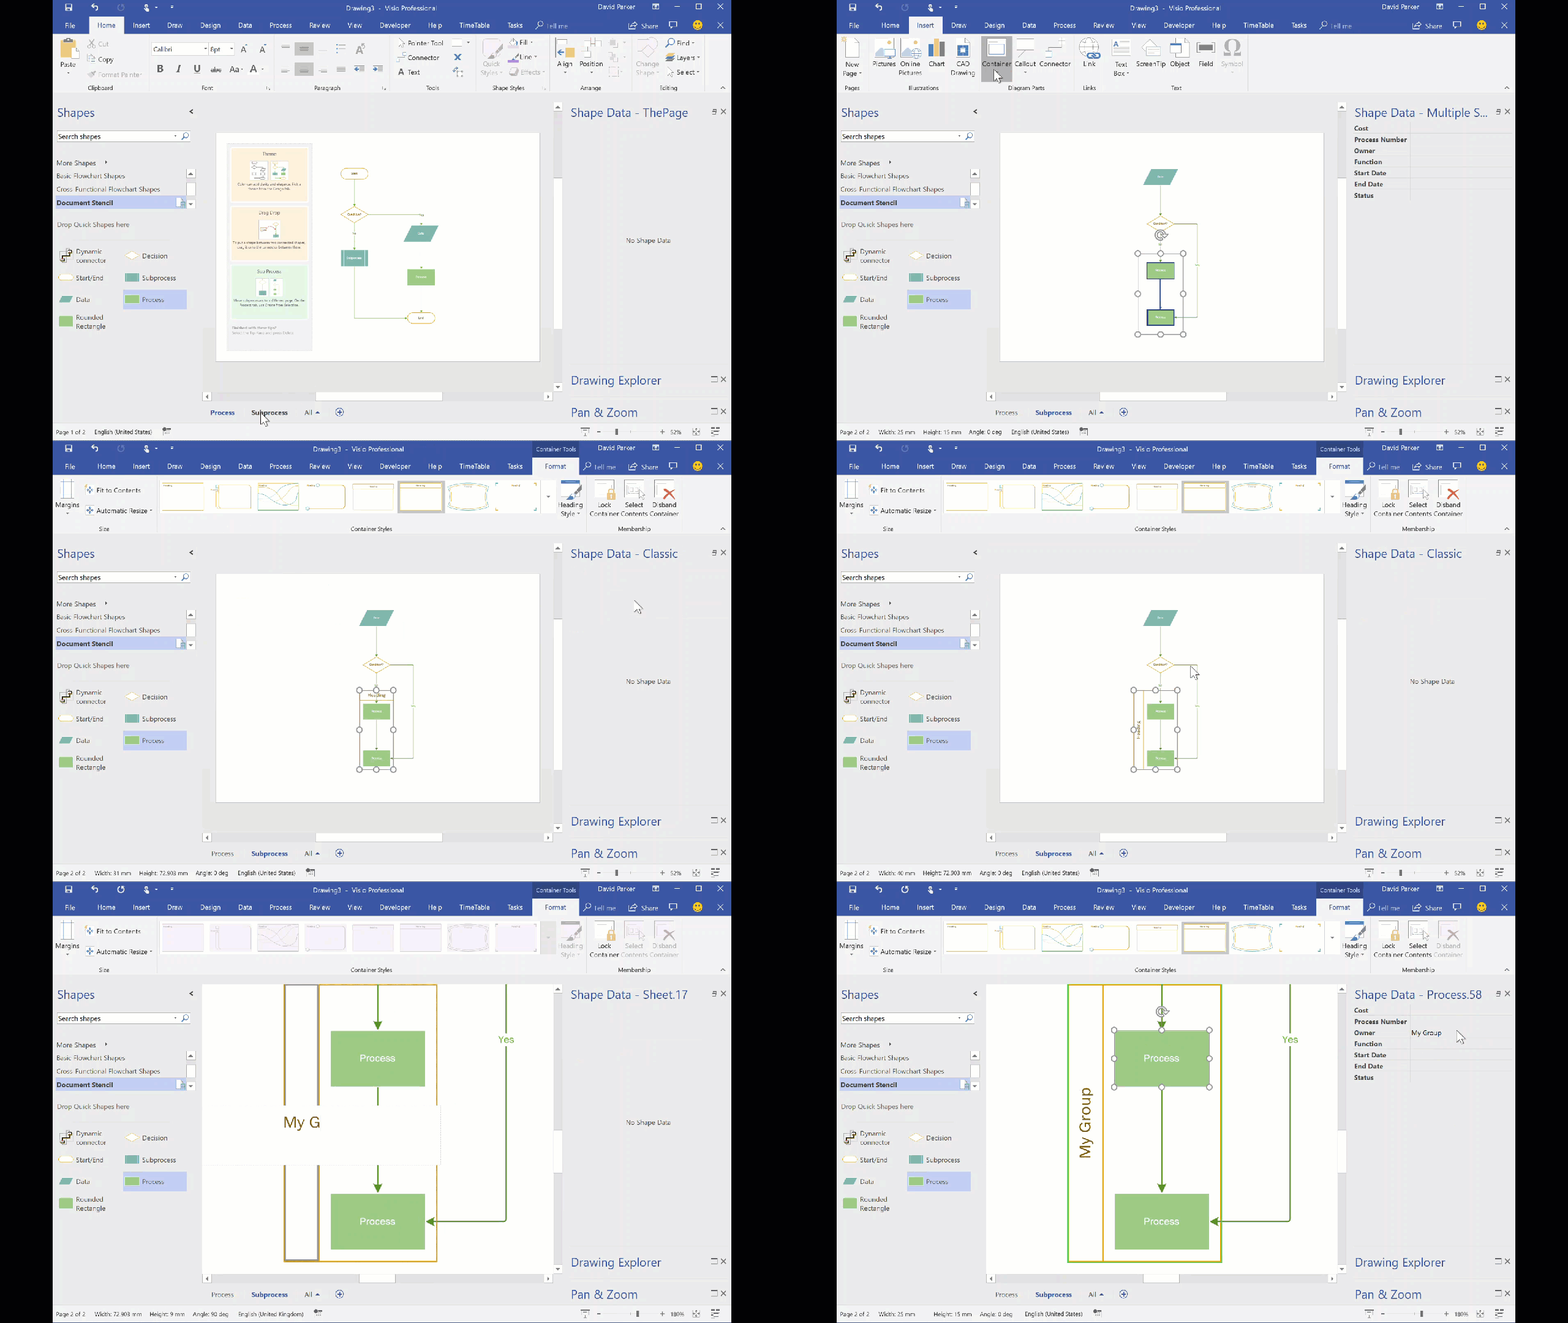
The concept of Structured Diagrams was introduced in Visio 2010 to provide core functionality for a variety of the templates in Visio, such as the Cross-Functional Flowchart, BPMN Diagram and Wireframe Diagram. This is primarily evident as Containers, Lists and Callouts and they can be customized (see Custom Containers, List and Callouts ), as shown in some of my previous articles ( see https://blog.bvisual.net/?s=container). One example of this extension can be found in all of the flowchart shapes that placed into a swimlane in a cross-functional flowchart. They have a Shape Data row, Function, that automatically inherits the text entered into the header of the swimlane. In another example, a Visio user can use Insert / Diagram Parts / Container to visually group other shapes together, and update the header text of the container. Well, I often do want my custom shapes to inherit the text of a container, so, in this article, I show how the built-in containers can be enhanced to provide this ability.

InheritingContainerText

You should be aware that I often exploit the fact that Visio creates a local copy of each master shape that it uses within a document. This can be modified and set to match master by name on drop, to ensure that it is the one to use, even if the original Microsoft provided version is used. In this case, I use this trick to create hidden, enhanced versions of the containers that are available in the gallery of containers. Microsoft also do this with the Dynamic connector shape in a number of their own templates.
If you examine the Function Shape Data row of any of the flowchart shapes, then you will find the formula:

[Read more…] about Enhancing the Built-In Containers in Visio

Filed Under: Containers, Process Flows, ShapeSheet Formulas, Visio, Visio 2016 Tagged With: Containers, ShapeSheet, ShapeSheet Functions

Published on June 19, 2018 by David Parker

Really Snapping to Grids in Visio

Visio has the ability to refine the options for snapping shapes to just grids, but this does not necessarily mean that shapes will automatically position themselves on a grid, or that the size is a multiple of a grid. What if you want some shapes to always be positioned on a fixed grid, and the width and height to always be a multiple on the horizontal and vertical grids respectively? What if you want the grid to start at the top left rather then the default bottom left? Fortunately, the ShapeSheet of the page and shapes can provide this ability, without the need for any external code.


You can set the page to have Fixed horizontal and vertical grids, each with different minimum spacing, if necessary. You can set the grid and ruler origins using the Ruler & Grid dialog, but it will be always relative to the bottom left corner of the page. So this can be a problem if you change the print margins or the page size, if you really want the grid origin to remain in another position, like top left.
You can just leave the Grid for snapping, and even change its strength to Strong, and even enter a larger number manually. This can help with snapping to the grids, but it is not enforced to be exclusive to the grids.

[Read more…] about Really Snapping to Grids in Visio

Filed Under: Shape Data, ShapeSheet Formulas, TimeTable, Visio Tagged With: ShapeSheet Functions

Published on June 15, 2018 by David Parker

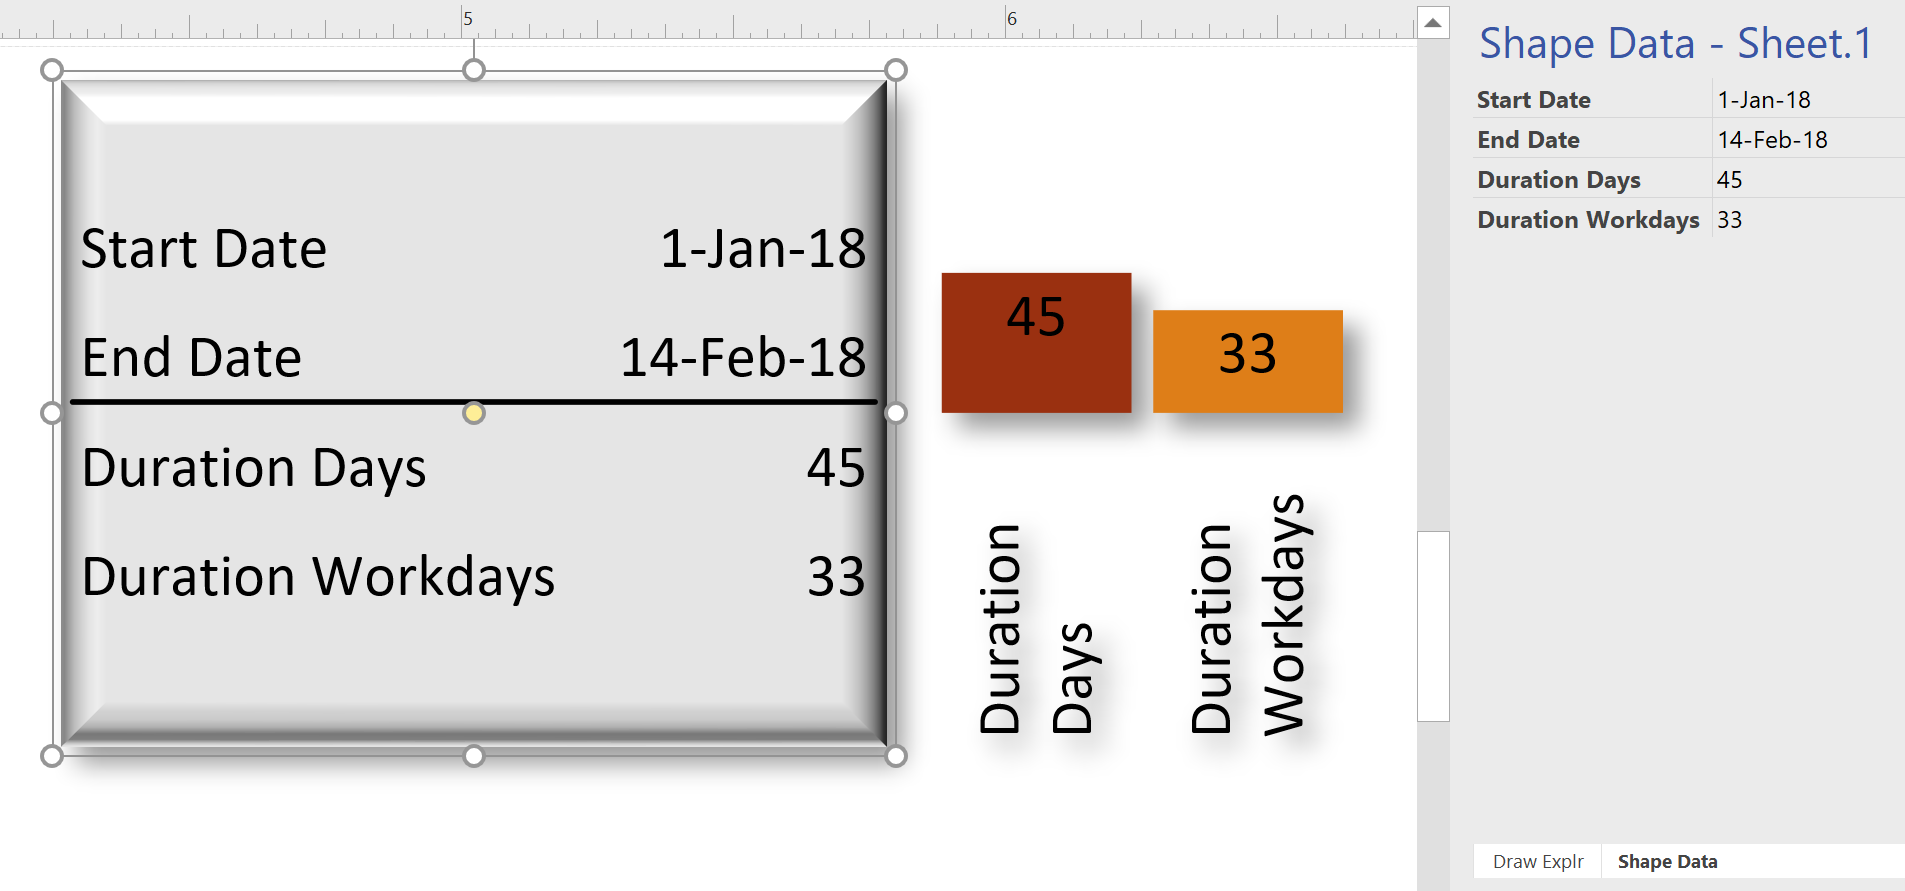
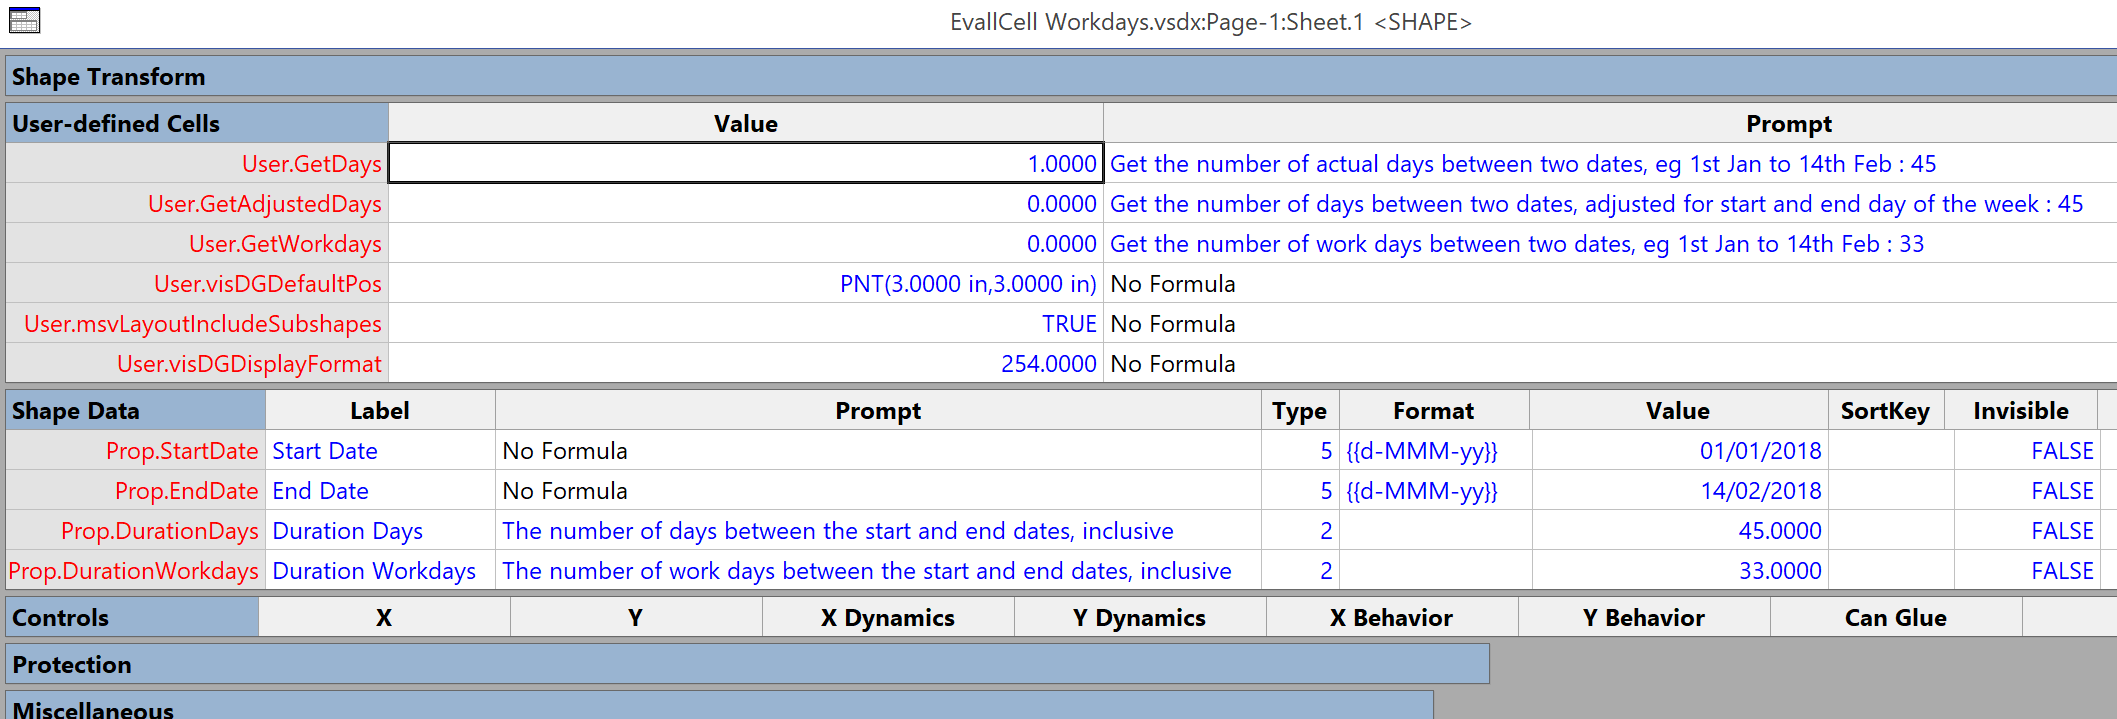
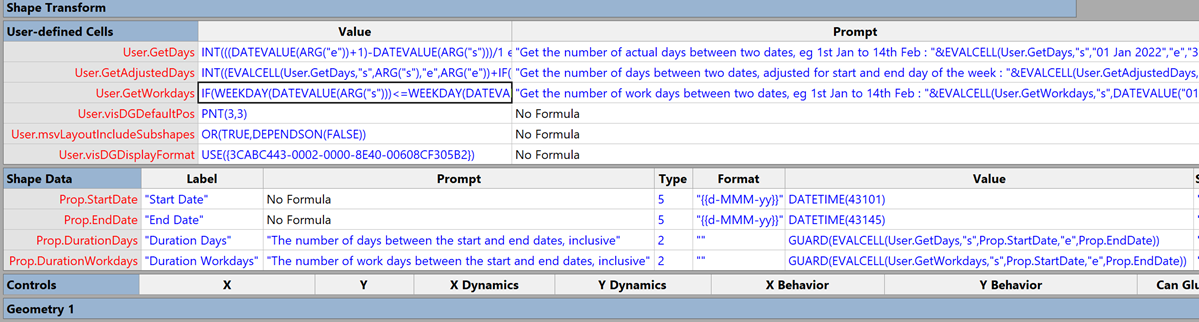
Using EVALCELL() in Visio to calculate Workdays

I recently agreed to calculate the number of workdays between two dates in Visio, without realising how difficult it is. Excel users are lucky because it has the NETWORKDAYS() function, but Visio users are not so fortunate. However, Visio does have the EVALCELL function which can be extremely useful in cases like this. I got the inspiration from one of the answers in StackOverflow for a SQL user who also needed a solution.

[Read more…] about Using EVALCELL() in Visio to calculate Workdays

Filed Under: ShapeSheet Formulas, TimeTable, Visio Tagged With: ShapeSheet Functions

  • « Go to Previous Page
  • Page 1
  • Interim pages omitted …
  • Page 16
  • Page 17
  • Page 18
  • Page 19
  • Page 20
  • Interim pages omitted …
  • Page 36
  • Go to Next Page »

Primary Sidebar

  • LinkedIn
  • Twitter

Recent Posts

  • Introducing a free Visio Report Runner application
  • Protecting the integrity of custom Visio masters
  • Docked Stencils in Visio for the Web
  • My Visio Books and Old pre-C# Work
  • Migrating from Lucidchart to Visio?

Categories

Tags

Accessibility Add-Ins AdvancedInstaller Connectors Containers Data Export Data Graphics Data Import Data Visualizer Educational Excel GraphDatabase Hyperlinks Icon Sets JavaScript LayerManager Layers Legend Link Data to Shapes MSIgnite Office365 Org Chart PowerApps PowerBI PowerQuery Processes Setup and Deployment Shape Data Shape Design ShapeSheet ShapeSheet Functions SharePoint 2013 SQL Teams Validation VBA Video Visio Visio 2007 Visio for the desktop Visio for the Web Visio Online Visio Services Visio Viewer Webinar

Footer

bVisual Profile

The UK-based independent Visio consultancy with a worldwide reach. We have over 25 years experience of providing data visualization solutions to companies around the globe.

Learn more about bVisual

  • Amazon
  • E-mail
  • Facebook
  • LinkedIn
  • Twitter
  • YouTube

Search this website

Recent posts

  • Introducing a free Visio Report Runner application
  • Protecting the integrity of custom Visio masters
  • Docked Stencils in Visio for the Web
  • My Visio Books and Old pre-C# Work
  • Migrating from Lucidchart to Visio?

Copyright © 2026 · Executive Pro on Genesis Framework · WordPress · Log in