I wrote about ensuring high contrast between text and the background of Visio shapes in my last article. The RGB values actually came from an imported SharePoint list that has a lookup to a list that contains the RGB values of named colours. Having solved how to display the correct text colour for high contrast in Visio, I wanted to the same in a SharePoint column, but first I had to learn how to use the RGB values to format the background colour.
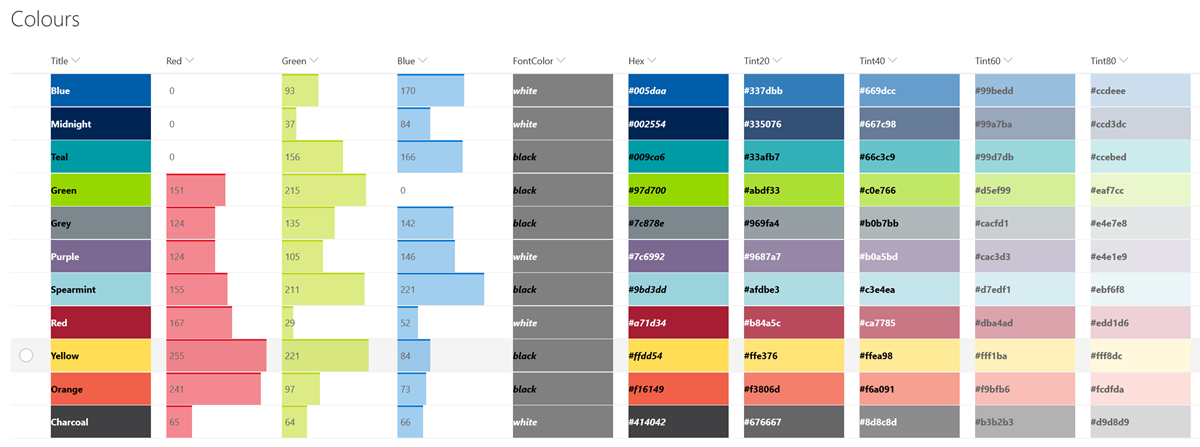
My good friend Chris Roth, aka VisGuy, has already produced Visio ShapeSheet formulas to convert RGB values to Hex values. so I adaptively re-used his idea to create a formula that I could use in a SharePoint calculated column, called Hex.
First, I compressed his multiple User-defined Cells rows into a single formula: