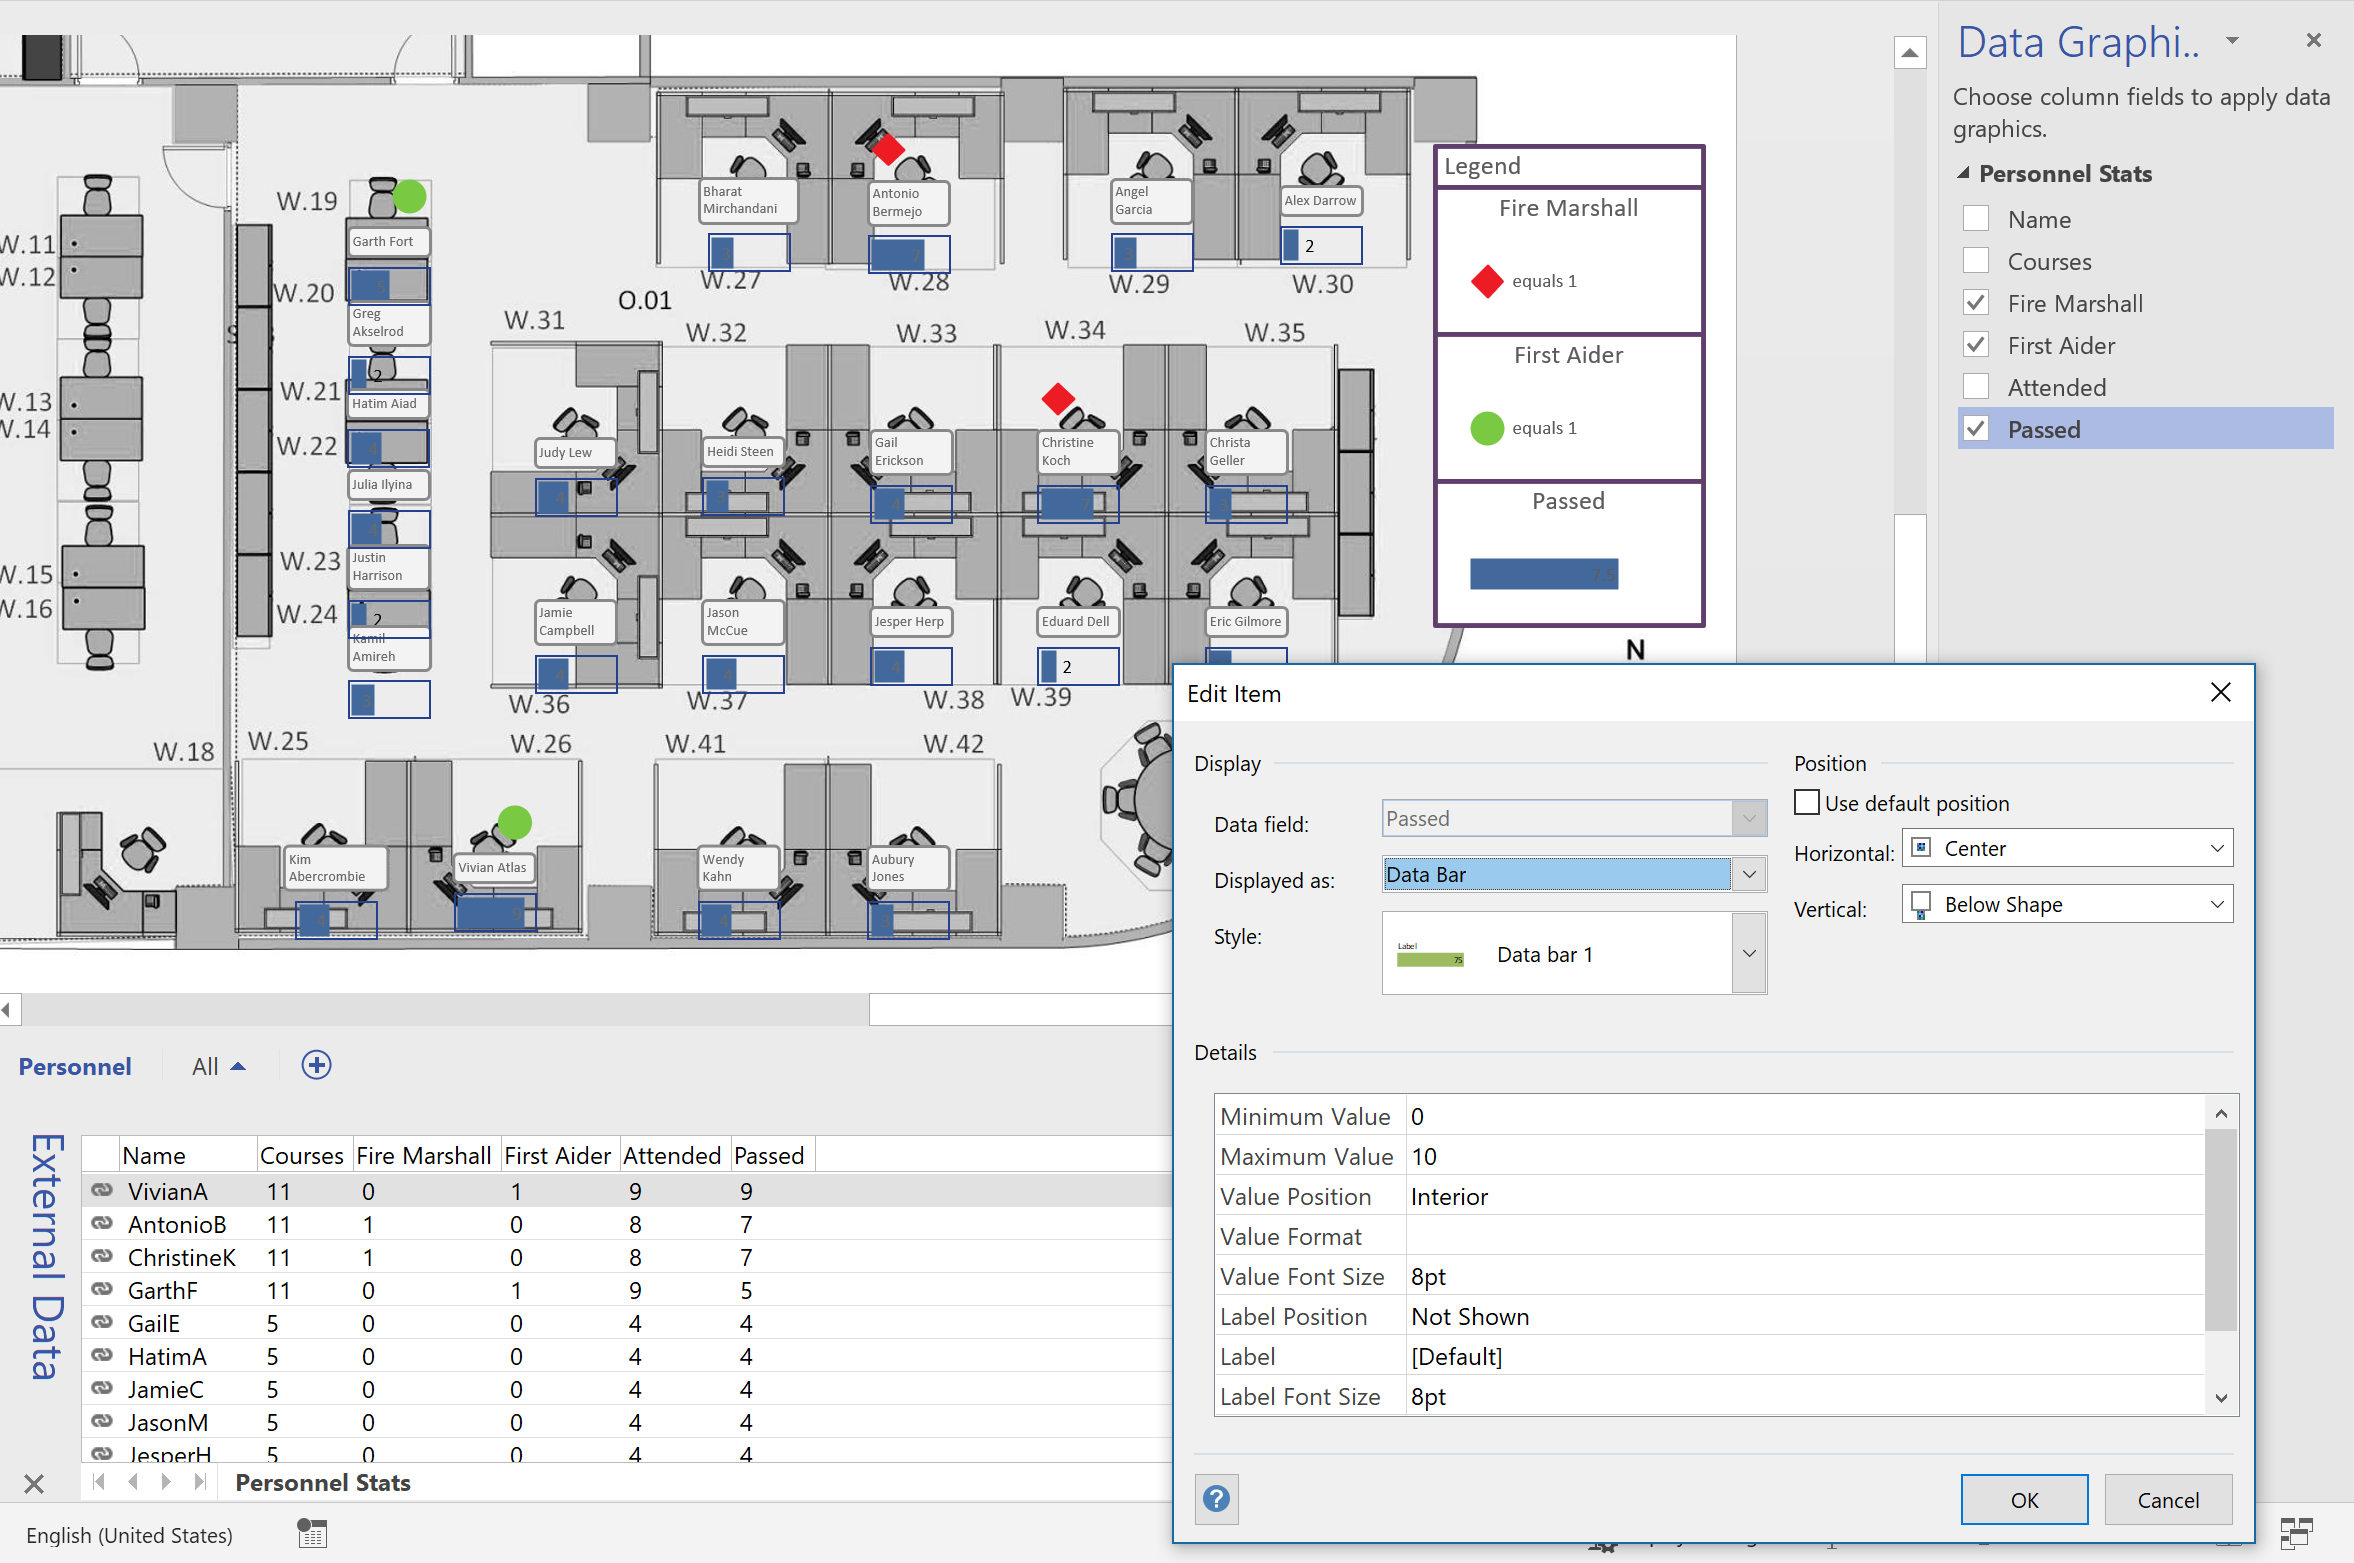
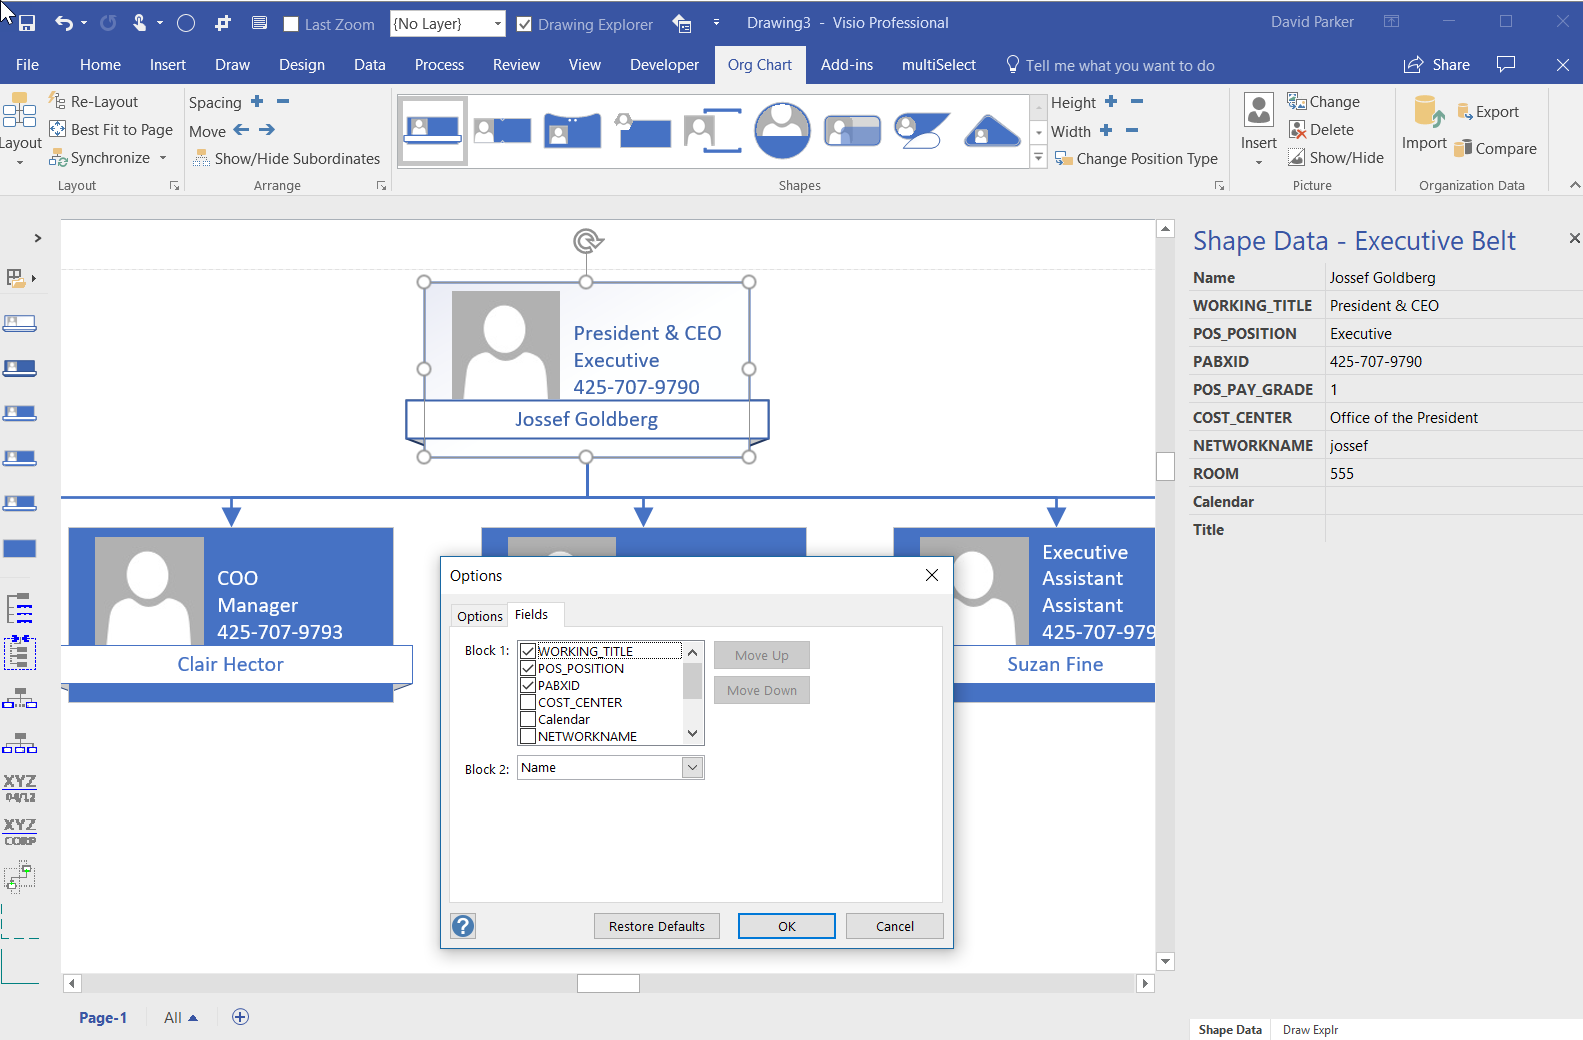
I really enjoy linking data to Visio diagrams, either directly or using the Visio custom visual in Power BI. This visual has the ability to display PowerQuery data as text or color, but not as icons or data bars. These last two features are something that can be used natively in Visio, and automatically updated in Visio Online. I have previously urged Microsoft to add these abilities to the Visio custom visual in Power BI, but there is no sign of it appearing just yet. The custom visual actually removes any Data Graphics ( Text Callouts, Icon Sets, Data Bars or Color by Value) that may already exist in a Visio diagram when it is embedded into Power BI. This reduces the number of shapes in the visual (there is currently a low limit) and, in any case, the data should be displayed from Power BI.
I want to be able to display some data as icons and data bars within the Visio diagram, so what is the alternative? Fortunately, there is a way using text symbol characters and the wonderful Power Query formulas!
Excel
Aliasing Data Columns for Visio Organization Chart Wizard
One of the most frequently used components of Visio is the Organization Chart Wizard (OrgChWiz), but it is also one of the most frustrating because of its apparent inflexibility. I was recently asked how to use different table column names with the wizard because the originating ODBC source could not be touched. Well, I have previously used Access to modify and enhance tables in this situation, but the OrgChWiz is quite old, and does not like using the newer Access queries as a data source unfortunately. If the basic table column names do not match the default column names in the organization chart shapes, then there may be superfluous Shape Data rows created on each shape and the ability to change the shape style is compromised, and the Shape Data rows get quite confused!
The Organization Chart template opens with the Belts – Organization Chart Shapes stencil open by default, although the Master shapes used can be replaced with those on one of the other nine using the Org Chart / Shapes gallery:
Countdown to MSIgnite for Visio sessions
Only a couple of days to go before Microsoft Ignite conference starts here in Orlando. Yes, I am here a week early to “acclimatize” 🙂 , but I have not been idle since I will be presenting in three sessions!
[Read more…] about Countdown to MSIgnite for Visio sessionsPreviewing the Visio Custom Visual in PowerBI
It is time to talk about the new Visio custom visual for PowerBI. You may have read about it at Visio Power BI example and Add Visio visualizations to Power BI reports, but I wanted to add my findings. First, it is great to see this feature, but it is not yet the finished article. However, I hope I can show that it can be an extremely useful addition to the business intelligence toolset from Microsoft. I think that the existing Link Data to Shapes and Data Graphics features in Visio desktop are considered to be Operational Intelligence capabilities, whereas this new custom visual for PowerBI is definitely Business Intelligence. This is a different discipline, and I have been developing some guidelines for good practice when using Visio with PowerBI. In this article, I will demonstrate how I created a PowerBI dashboard using graphics and data from last years Microsoft Ignite conference.
Let me set the expectations because I am working with a preview of the Visio custom visual.
[Read more…] about Previewing the Visio Custom Visual in PowerBIData Visualizer for Visio Pro for Office 365 – Part 2
I walked though the steps to create a Cross-Functional flowchart automatically from an Excel table in my last article ( Data Visualizer for #Visio Pro for Office 365 – Part 1 ), but I often prefer to use a relational data source, such as Access or SQL Server, to store and organise my data. Therefore, I describe how Excel‘s Get Data (nee PowerQuery) can be used to merge together the data in a relational data source as a single table suitable for Data Visualizer in Visio Pro for Office 365.
[Read more…] about Data Visualizer for Visio Pro for Office 365 – Part 2Data Visualizer for Visio Pro for Office 365 – Part 1
Microsoft have just released Data Visualizer for Viso Pro for Office 365! This great new feature provides you with the ability to create diagrams from an Excel table automatically. It currently comes with two new templates for creating Basic or Cross-Functional flowcharts, but the feature can be used for many other different types of diagrams.
[Read more…] about Data Visualizer for Visio Pro for Office 365 – Part 1