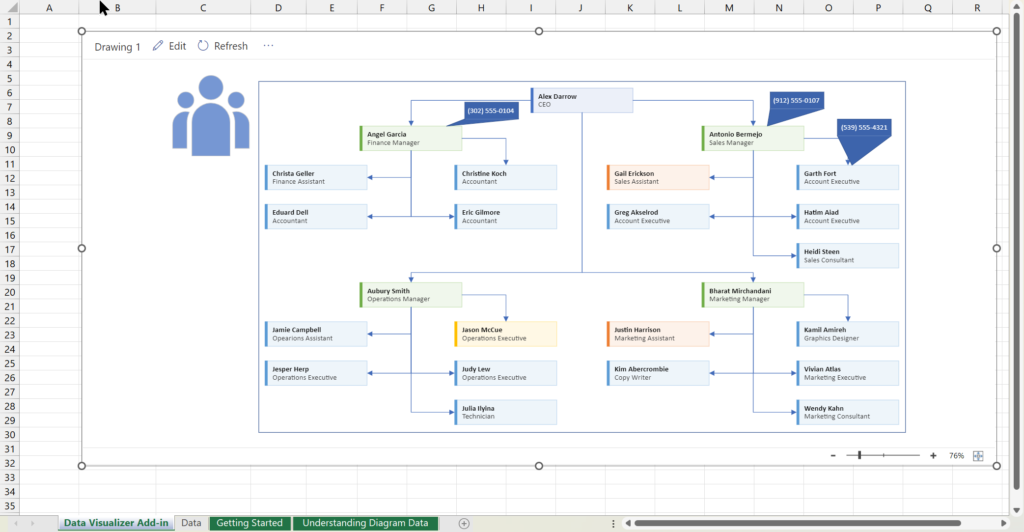
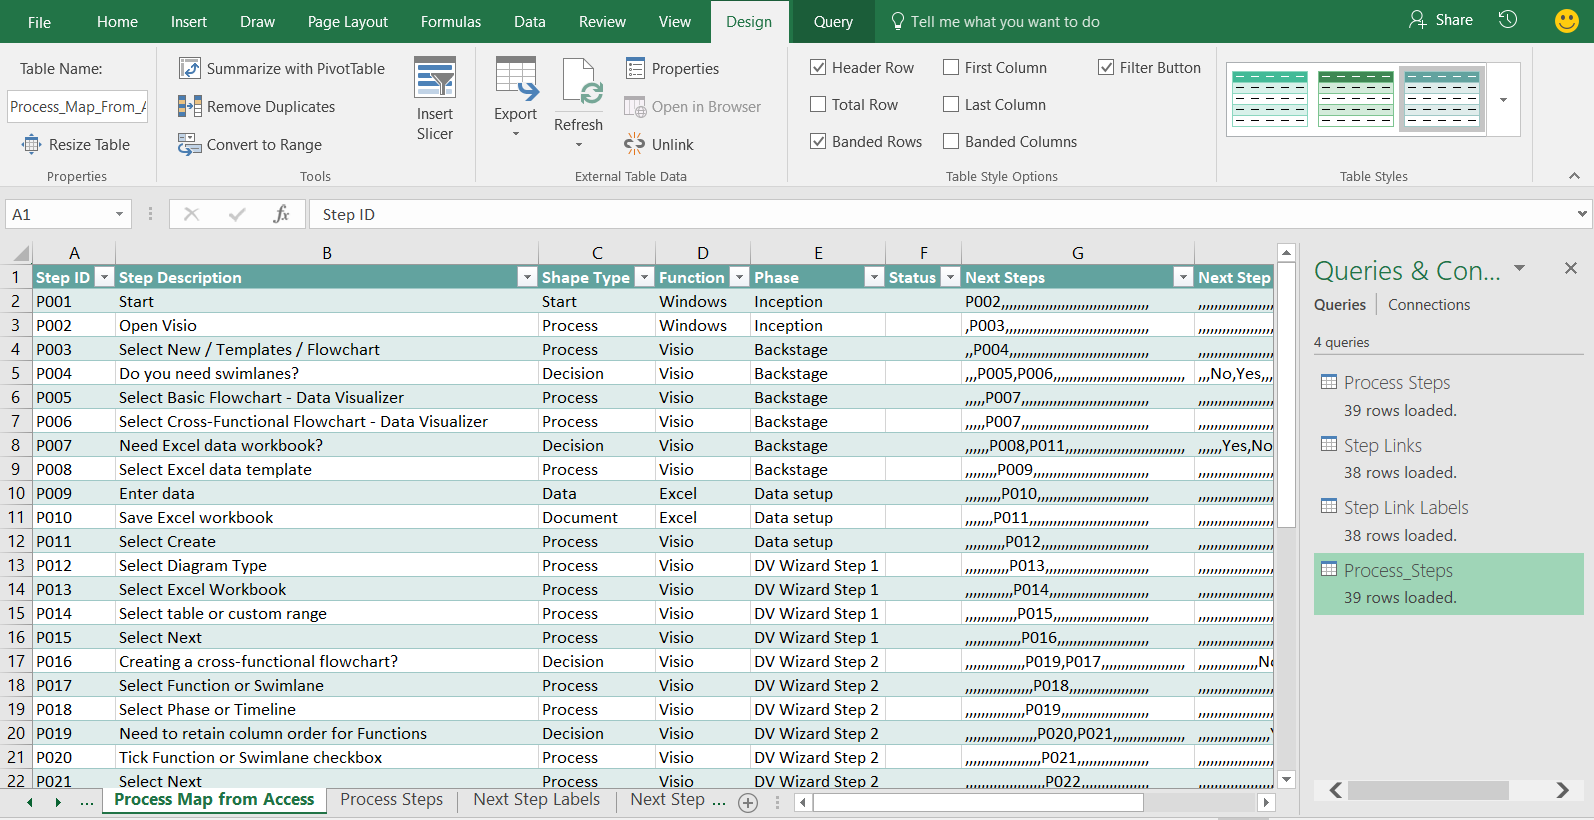
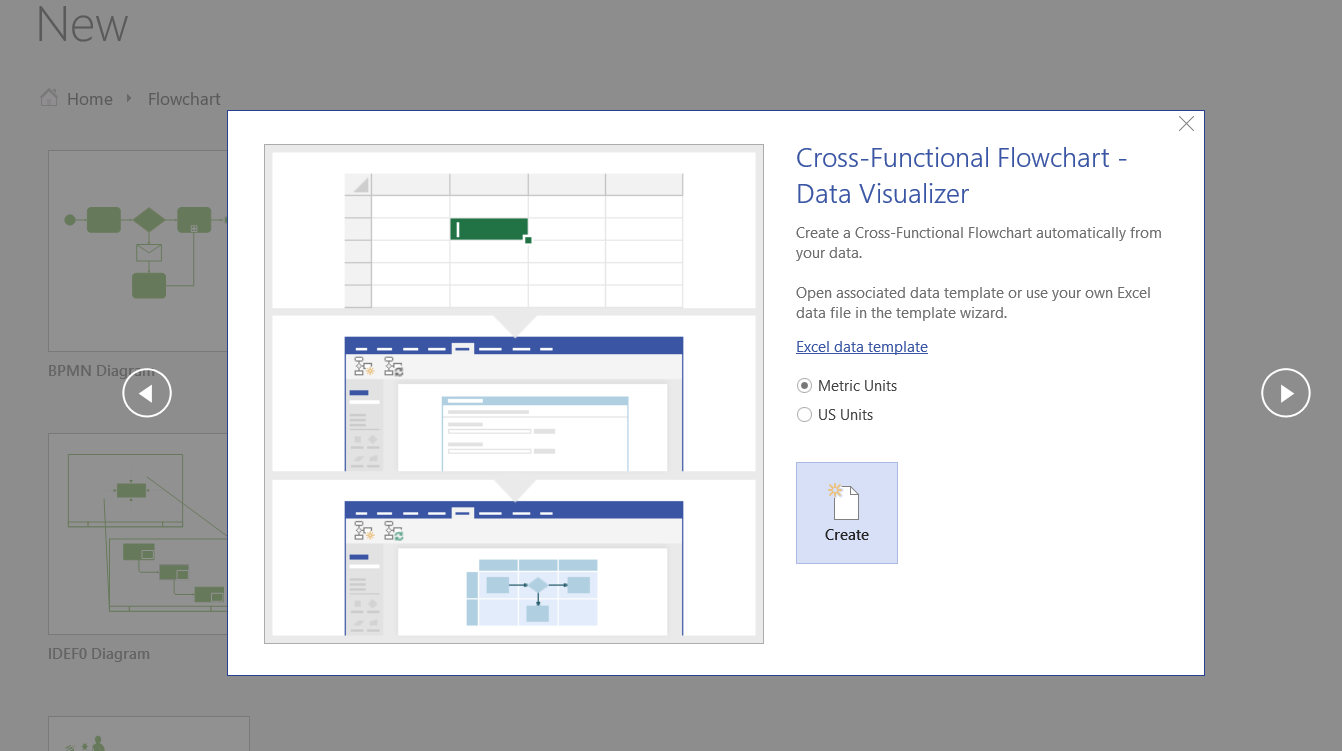
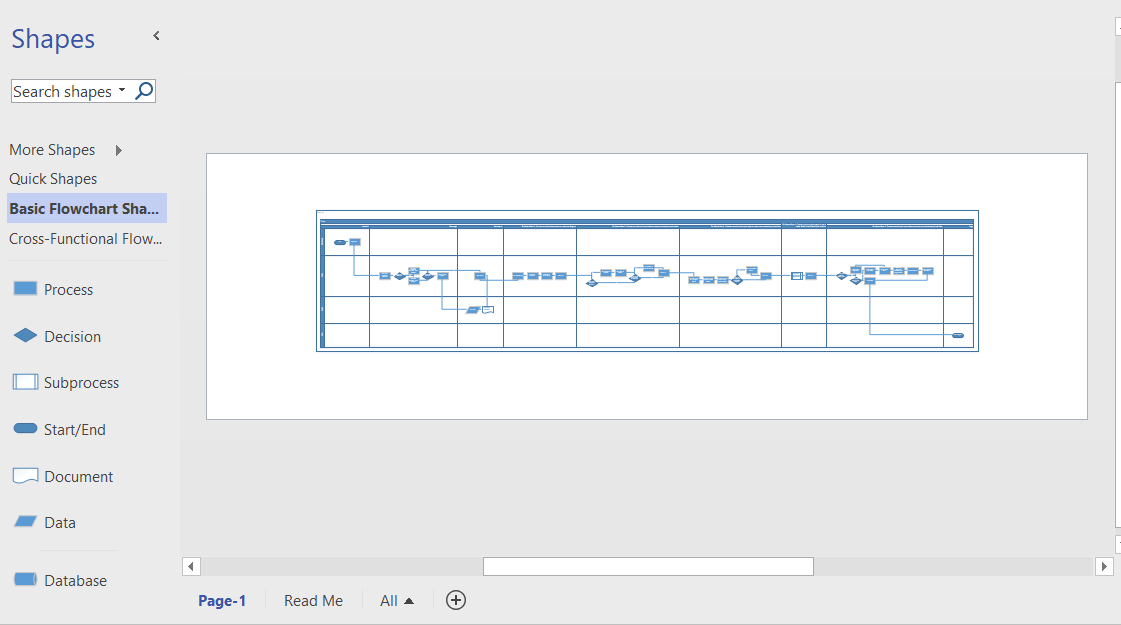
I re-vamped some of my content about the Visio Data Visualizer add-in for Excel in my last post, so I thought I should expand a bit more on the Data Visualizer feature in Visio for Desktop (Visio Plan 2) and Excel for Desktop. I have described it in detail in previous posts, but I never published the process diagram I created for the Data Visualizer Wizard in Visio. So, I thought I would use it to demonstrate a few cool features of Visio for Desktop.
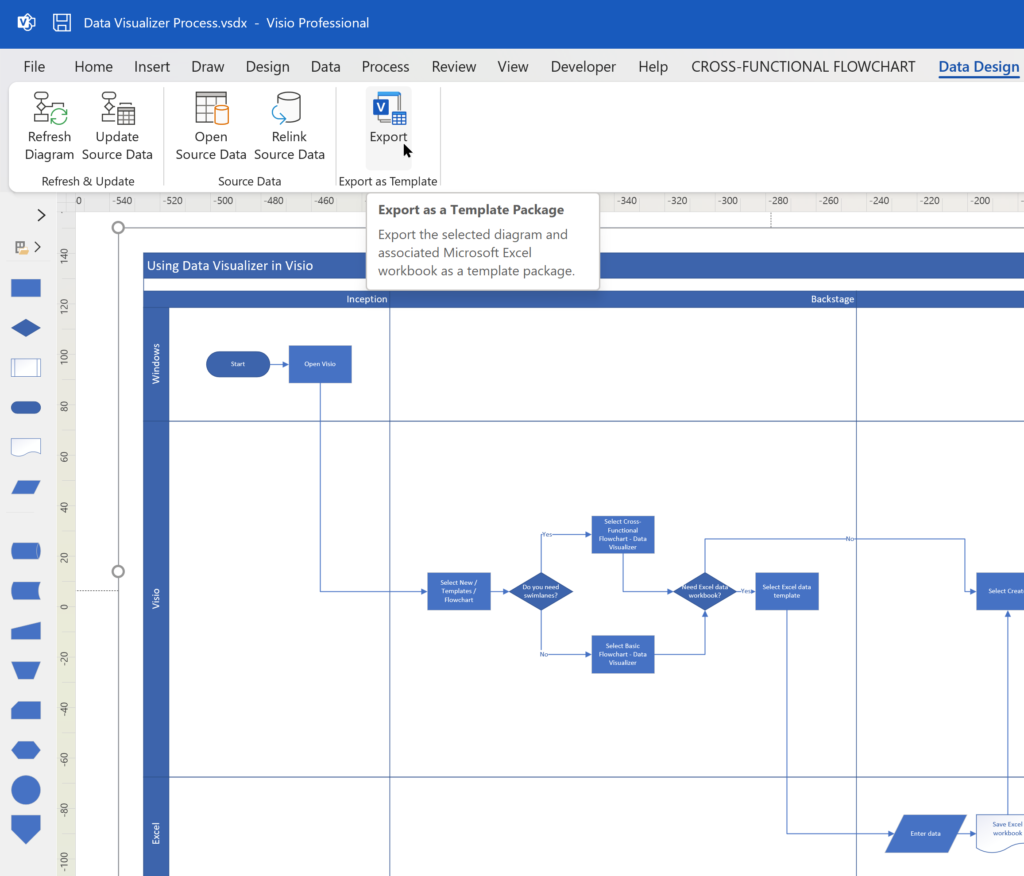
[Read more…] about Binding Visio and Excel with Data VisualizerData Visualizer
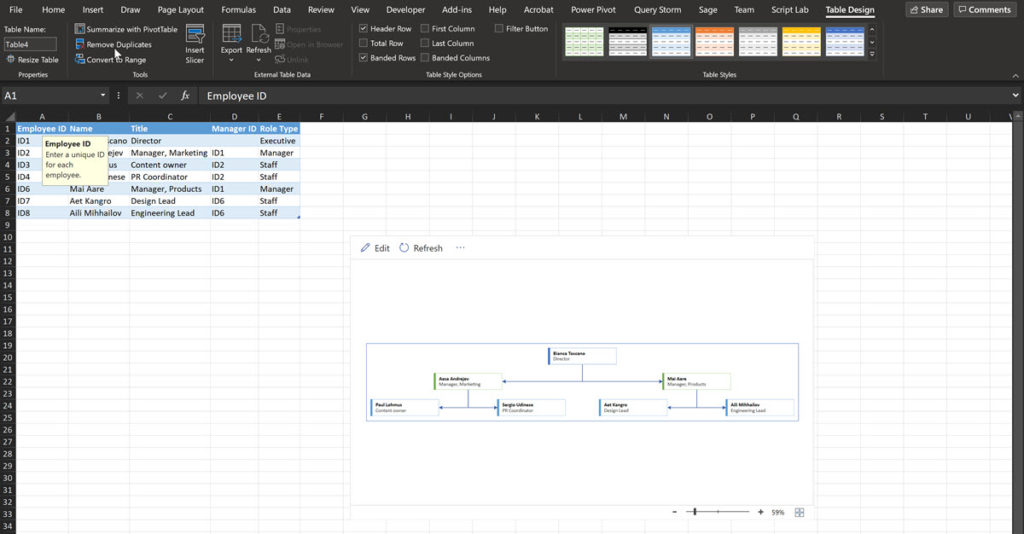
Editing Visio Data Visualizer in Excel
I have previously described how to use the Visio Data Visualizer add-in in Excel, but I didn’t make it clear how you can edit the diagram created if you have a Visio license. So, I have recorded three short videos to briefly explain this.
[Read more…] about Editing Visio Data Visualizer in ExcelVisio Data Visualizer Tips
The Microsoft Visio product team have released a great video introduction to the Visio Data Visualizer, but even that does not reveal all of its power. So, here are some tips about using the Microsoft Visio Data Visualizer add-in in Excel. Firstly, the add-in currently offers three different types of diagram, and each have a number of alternative layout arrangements.
- Basic Flowchart – 4 layouts
- Cross-Functional Flowchart – 5 layouts
- Organization Chart – 5 layouts
Although these are the proposed diagram types, there is no reason why other types of data, such as network devices, cannot be used with any of them.
[Read more…] about Visio Data Visualizer TipsUsing some Visio Shape Data in Visio for the Web
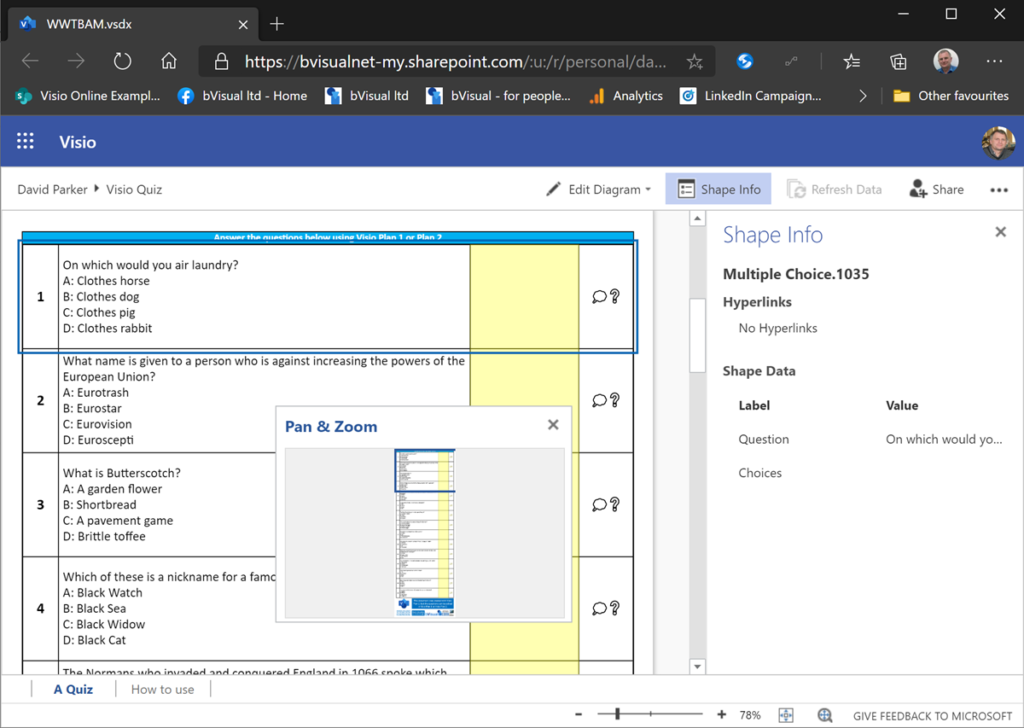
Like a lot of UK TV viewers last week, I watched Quiz, a drama about Major Charles Ingram who apparently cheated his way to the jackpot in Who Wants to be a Millionaire. Some of the questions that he was asked were quoted in that show, and I was surprised how easy the last two questions were for me, but that was probably because of my own education as a building architect. However, I decided to lookup the rest of the questions, and I would have fallen before getting to those questions unless my Phone-A-Friend could have helped me on one in particular. At the same time, I was thinking about the differences between Visio desktop and web editions (yeah, really!), so I have created a Visio document that contains all of the questions that the Major answered correctly. This document can be viewed by everyone and downloaded. If it is saved into OneDrive or SharePoint Online and then viewed online.
[Read more…] about Using some Visio Shape Data in Visio for the WebVisio news from MS Ignite 2019
Microsoft Ignite 2019 at the huge Orange County Conference Conference Center in Orlando is over for another year. 30,000 attendees over 6 days, and I have seen my first sunlight today since I arrived in Florida last Saturday! So, it is time to review just what was announced about Visio, and how much Visio is appreciated.
Data Visualizer for Visio Pro for Office 365 – Part 2
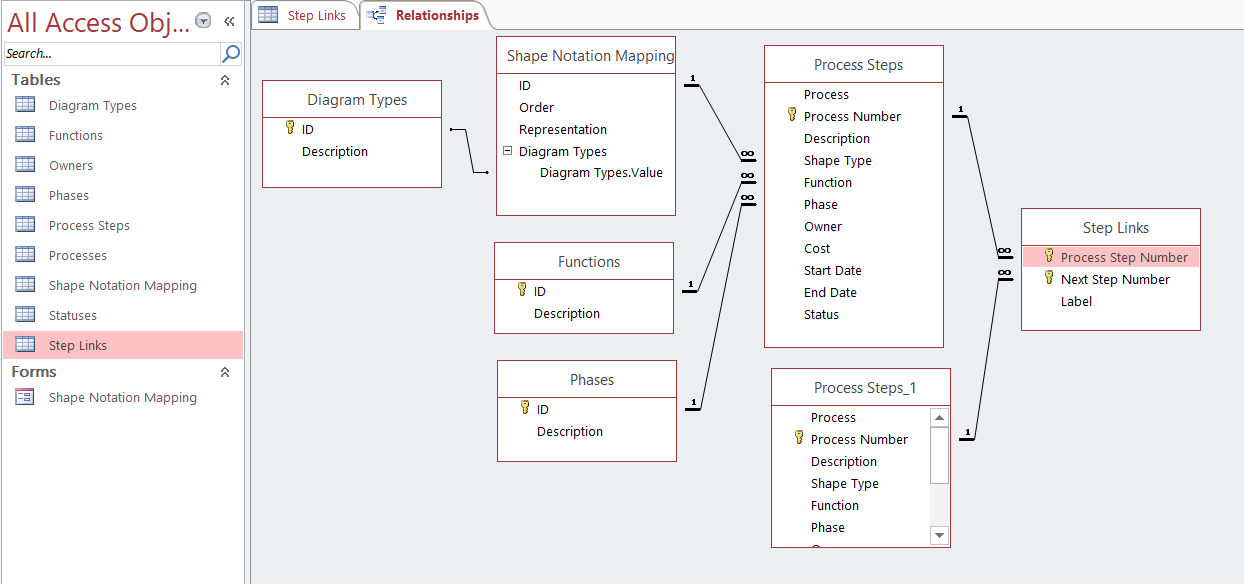
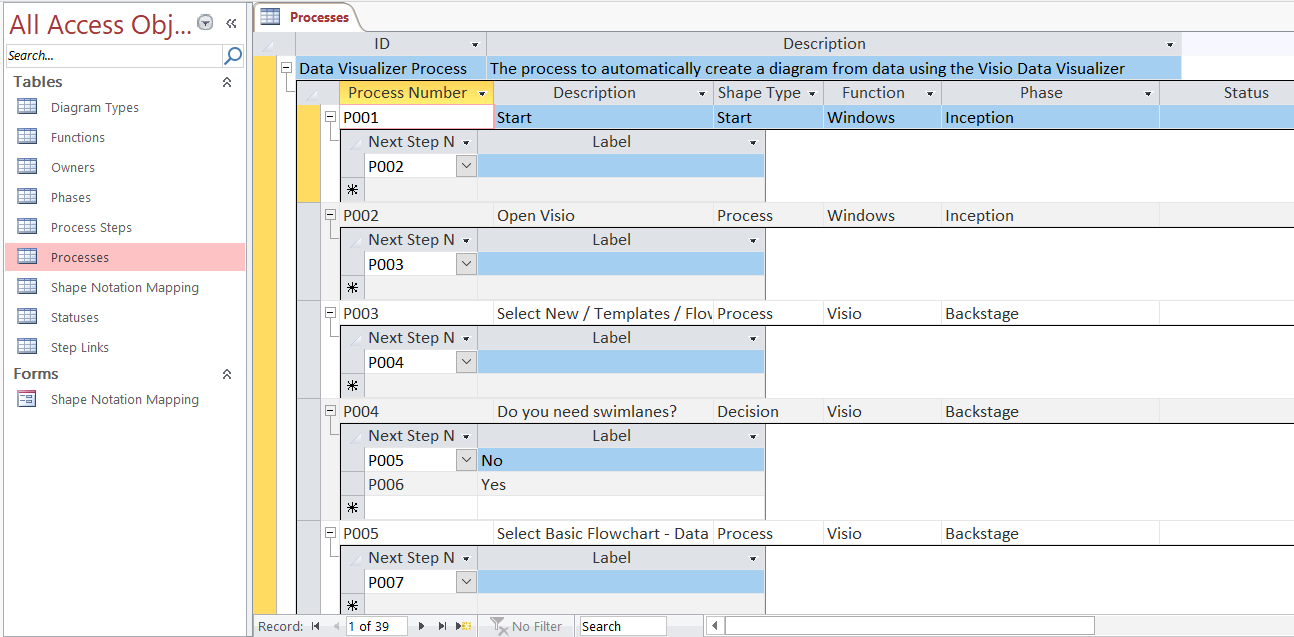
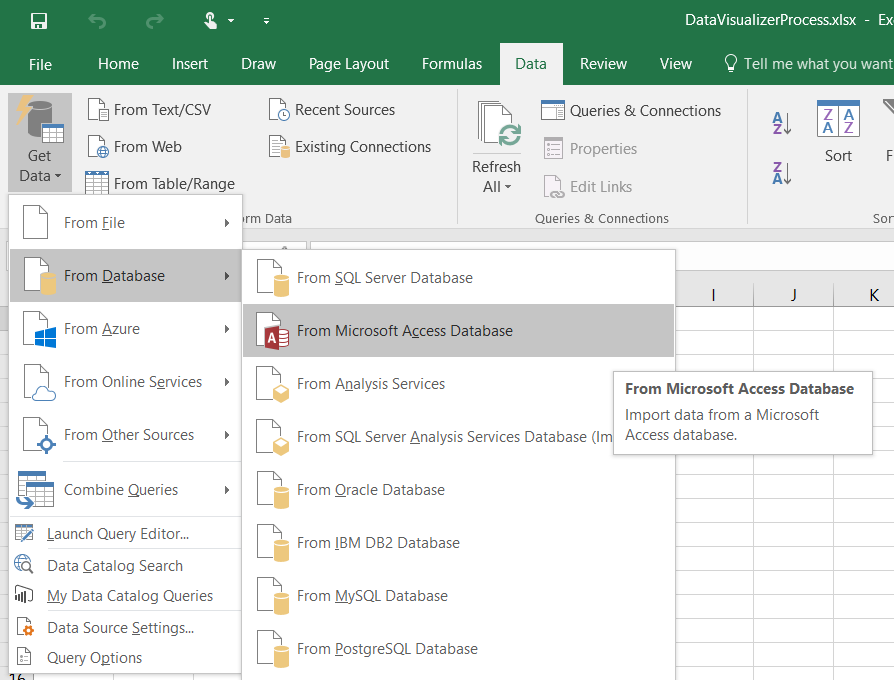
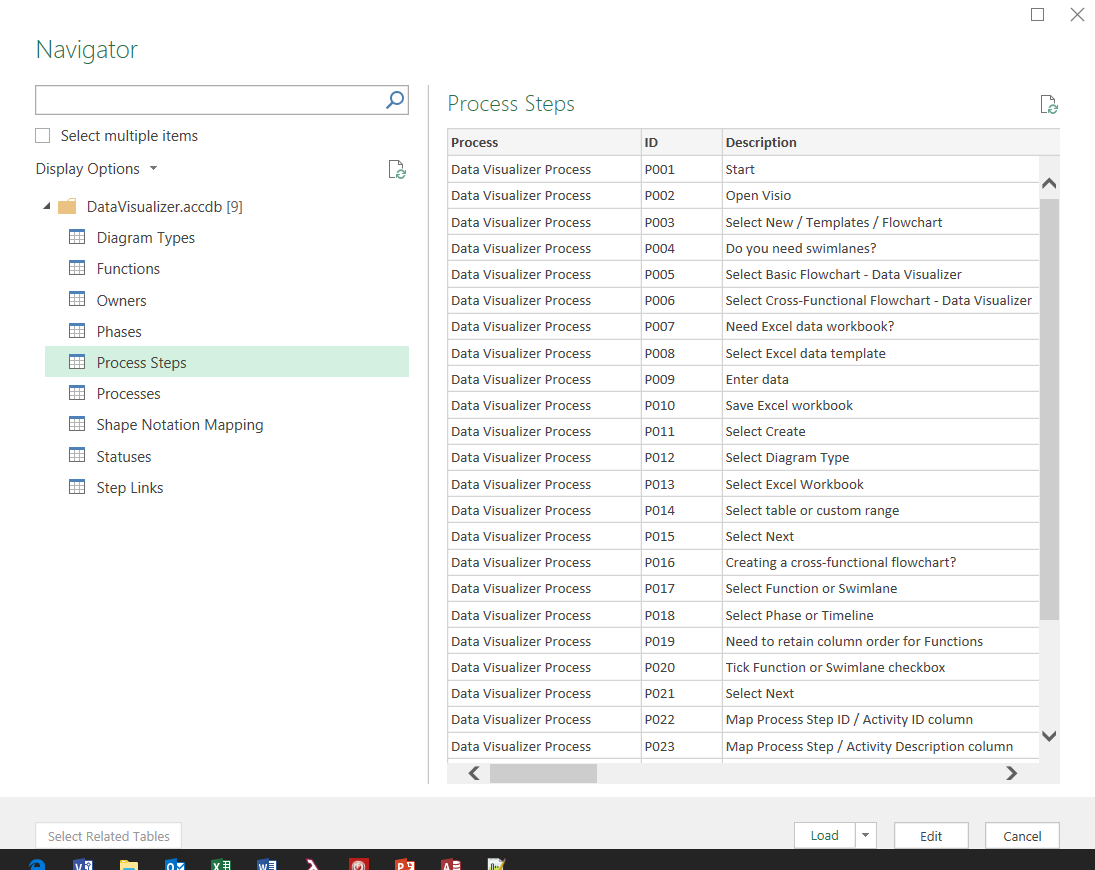
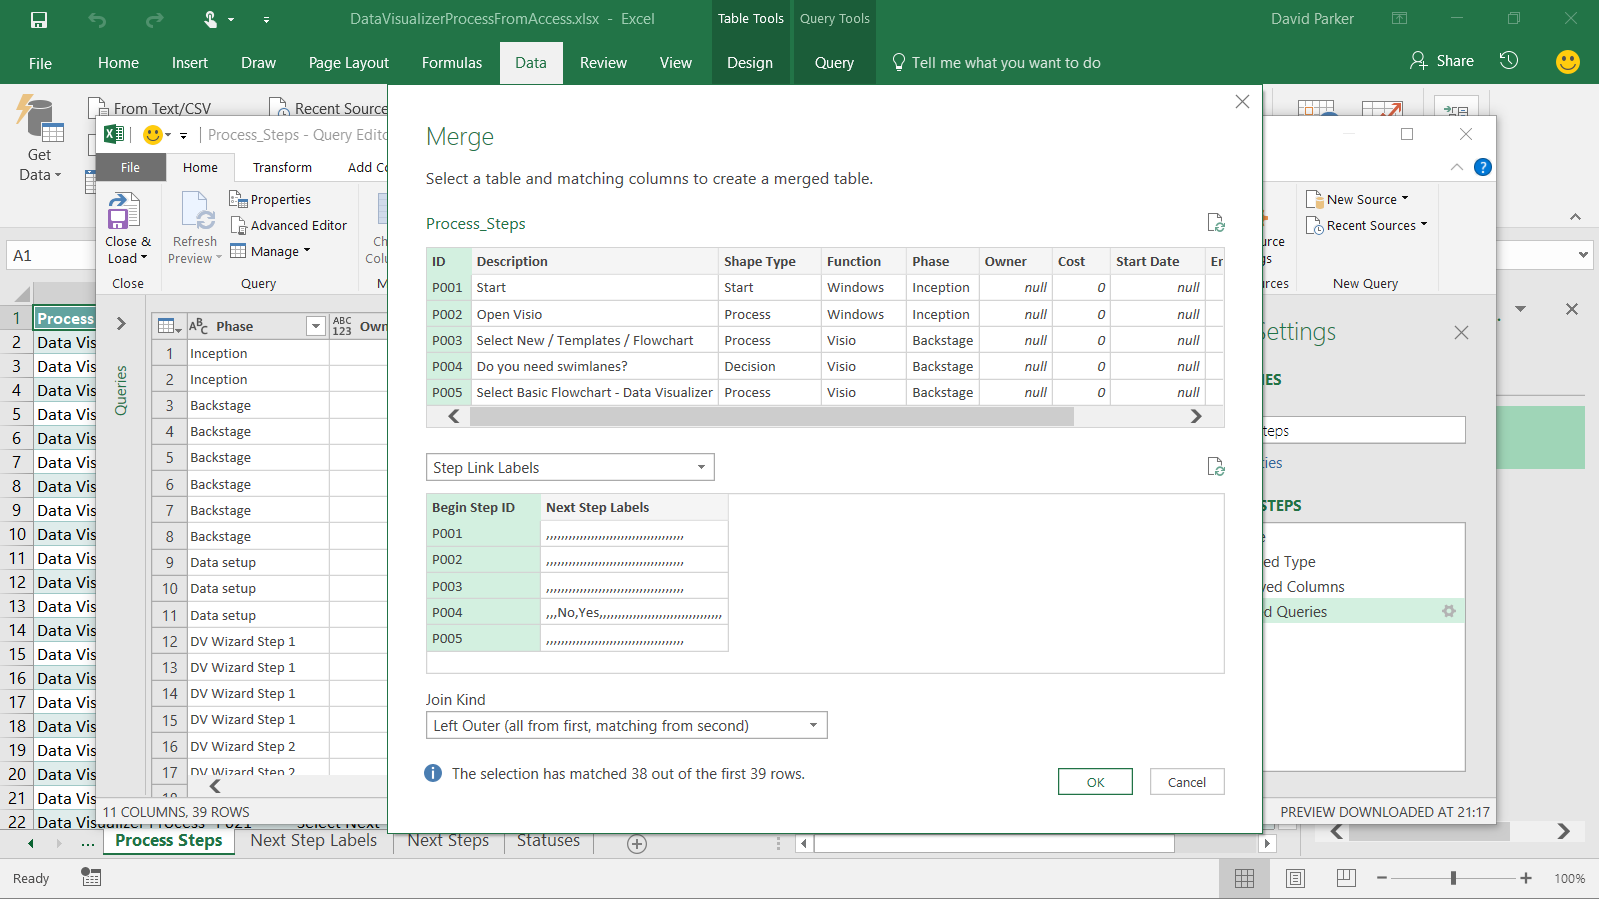
I walked though the steps to create a Cross-Functional flowchart automatically from an Excel table in my last article ( Data Visualizer for #Visio Pro for Office 365 – Part 1 ), but I often prefer to use a relational data source, such as Access or SQL Server, to store and organise my data. Therefore, I describe how Excel‘s Get Data (nee PowerQuery) can be used to merge together the data in a relational data source as a single table suitable for Data Visualizer in Visio Pro for Office 365.
[Read more…] about Data Visualizer for Visio Pro for Office 365 – Part 2