I needed to display the week number of dates in a Visio project of mine, but there is no WeekNum(…) function built-in, so I had to write one, and allow for the date that the week numbers begin in to be varied from 1st January. I also needed to allow for the week numbers to go backwards from the specified week number begin date.
Excel has a WeekNum(..) function, which can take an optional parameter for the day of the week to begin on, and an IsoWeekNum(..) function, and the following table shows the values change for the first 35 days of the year:
[Read more…] about Writing a WeekNum(…) function for Visio
bVisual Blog by David Parker
What makes Visio smart?
I have been running my Visio consultancy for over 20 years now, and I have created Visio solutions for many organisations, big and small, across many countries. Most of them know that Visio can do much more than they know how to do, but they do not know how it can be done. I usually do a short demo to explain where the smartness in Visio comes from, so I thought I would share a little bit of this knowledge with a couple of videos that, I think, show why Visio is so smart!
[Read more…] about What makes Visio smart?Narrated Text in Visio for Accessibility
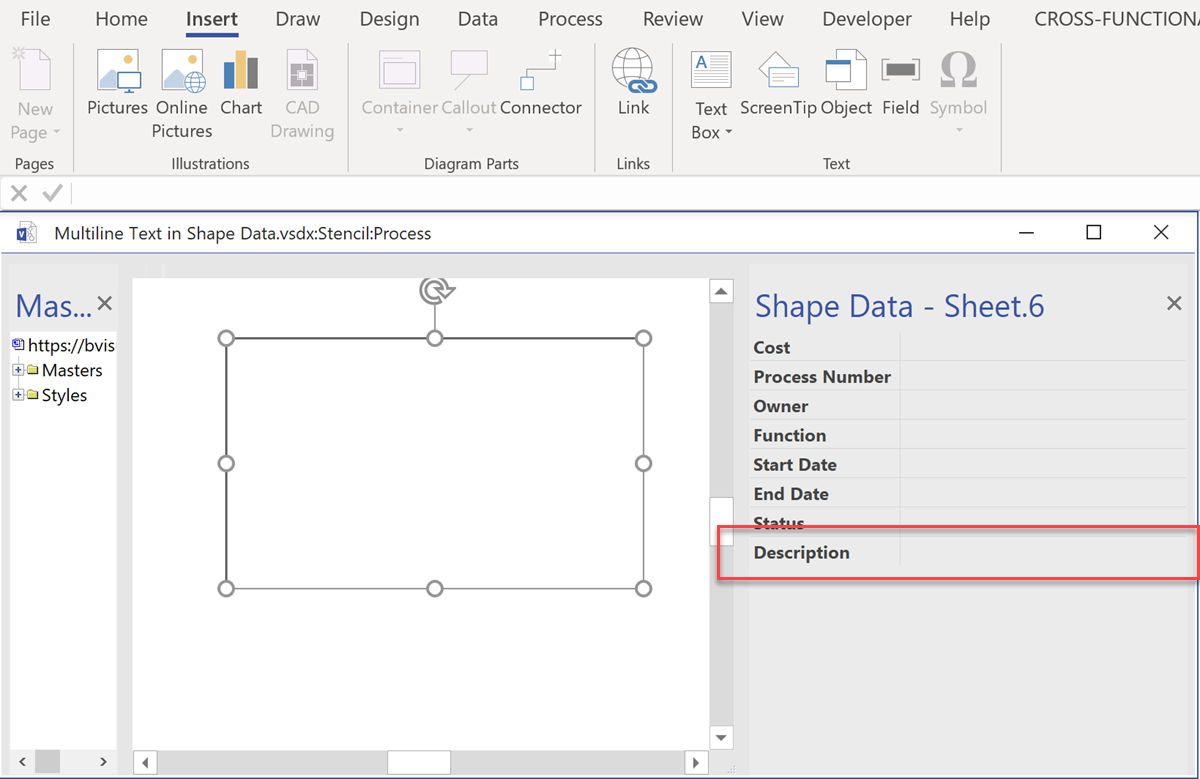
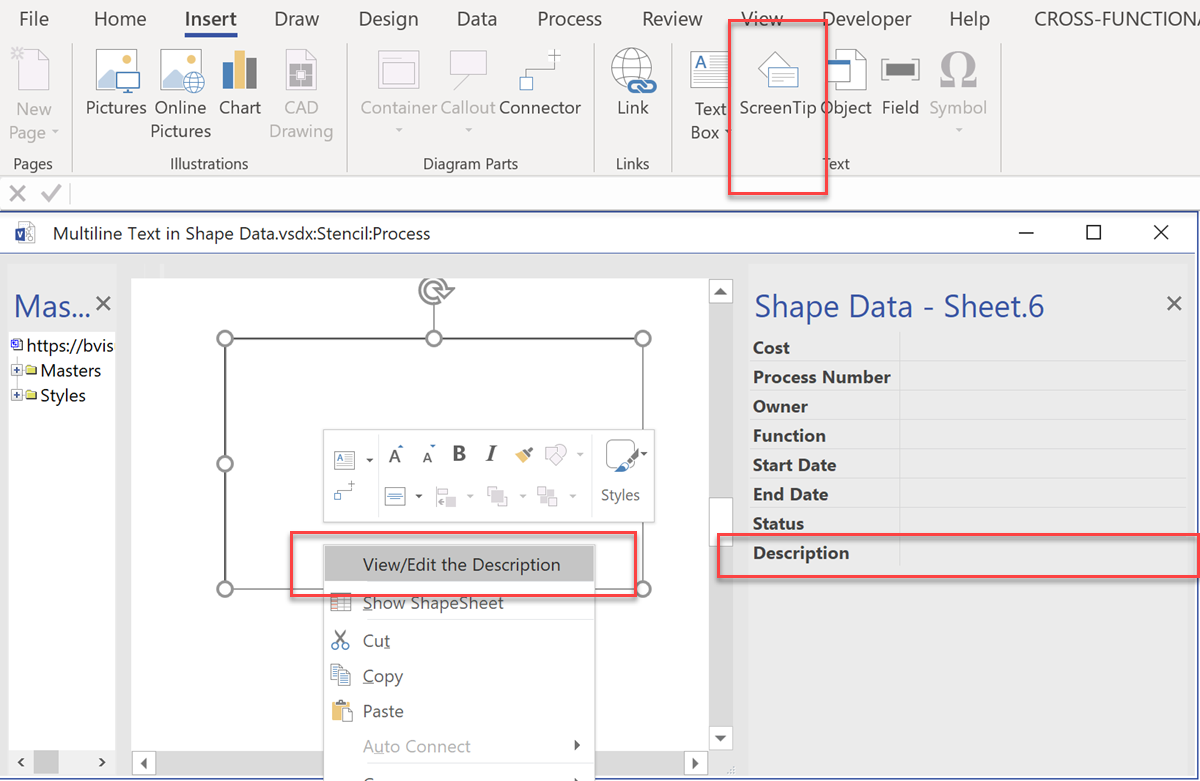
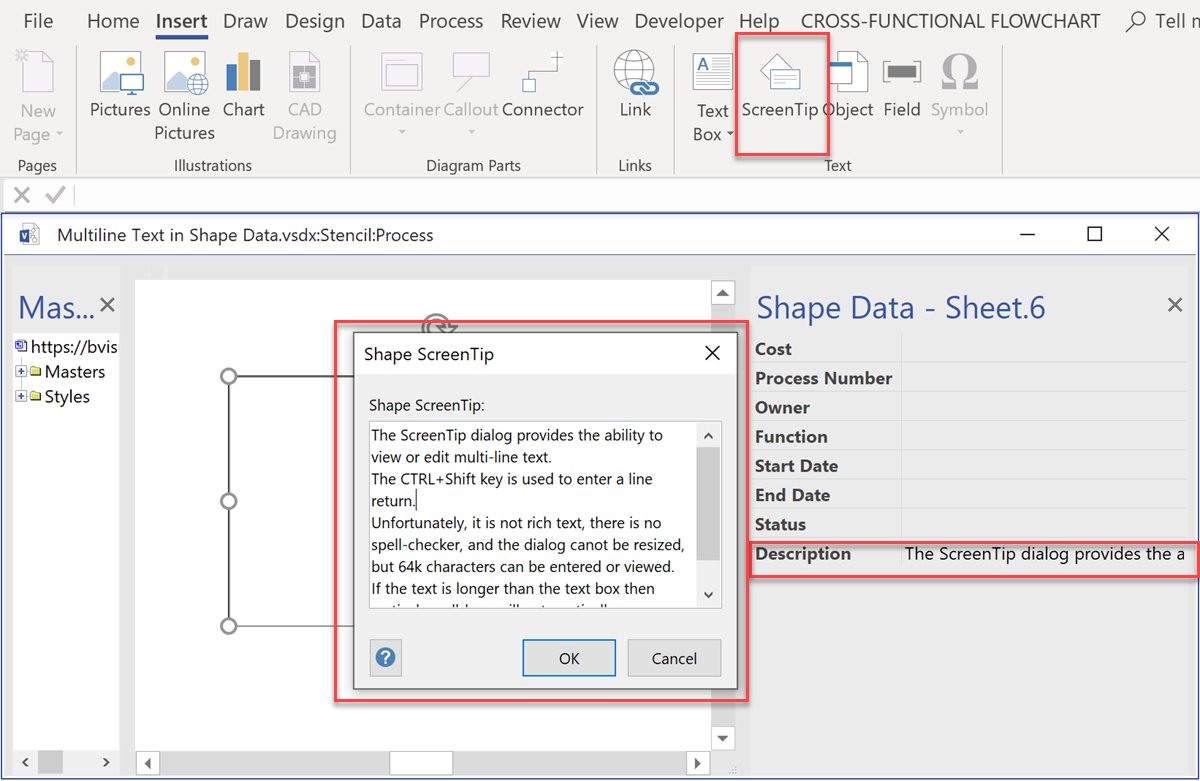
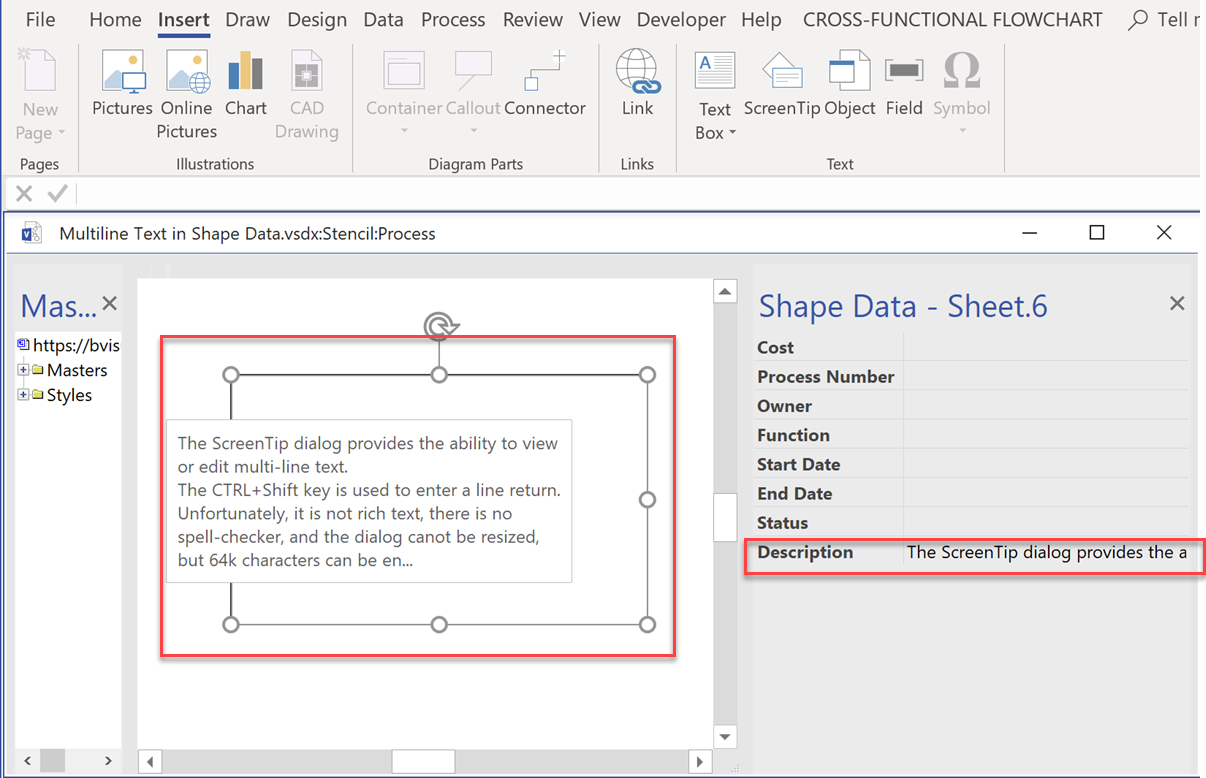
One of the ways that Visio supports accessibility is to provide text that is read out by a screen reader, such as Windows Narrator or JAWS. This Alt Text can be set using Format Shape / Size & Properties tab using the Title and Description text boxes. The Title is the initial text that is read out when a shape is attentioned, and the Description will only read out if the user pauses. The Description text box only allows 255 characters to be entered and displayed, but this is not actually the limit!
[Read more…] about Narrated Text in Visio for AccessibilityUnderstanding Visio Navigation Order
Visio defaults to tabbing from shape to shape in the order that the shapes are added to the page. However, this can end up with an illogical order if you are trying to navigate a diagram with the keyboard, which is often an accessibility requirement. Fortunately, Visio provides a Diagram Navigation pane so that the tab order can be changed, but how does it do it? The following short video shows how the navigation order, displayed as numbers in each shape, is assigned a value as soon as the order is edited.
Accessibility is important in my current project, so understanding how this happens was important to understand, and to surface this order to JavaScript, as we want to list the shapes in a logical order too.
I managed this by adding a User.visNavOrder to the master shape of all the significant masters, and a hidden Shape Data row, labelled “Navigation Order“. This has the following formula for its value:
Triggering Shape Mouse Enter and Leave JavaScript events in Visio Online
I am working on a project where Visio Online process diagrams are embedded within a SharePoint web page, and was surprised that the JavaScript onShapeMouseEnter() event was not being triggered as the mouse cursor moved over some of my shapes. After much searching by myself, and my colleague Seb Craft, we found that only the sub-shapes in the group were firing the event … So what was the problem?
[Read more…] about Triggering Shape Mouse Enter and Leave JavaScript events in Visio OnlineFormatting SharePoint Columns with RGB Color
I wrote about ensuring high contrast between text and the background of Visio shapes in my last article. The RGB values actually came from an imported SharePoint list that has a lookup to a list that contains the RGB values of named colours. Having solved how to display the correct text colour for high contrast in Visio, I wanted to the same in a SharePoint column, but first I had to learn how to use the RGB values to format the background colour.
My good friend Chris Roth, aka VisGuy, has already produced Visio ShapeSheet formulas to convert RGB values to Hex values. so I adaptively re-used his idea to create a formula that I could use in a SharePoint calculated column, called Hex.
First, I compressed his multiple User-defined Cells rows into a single formula: