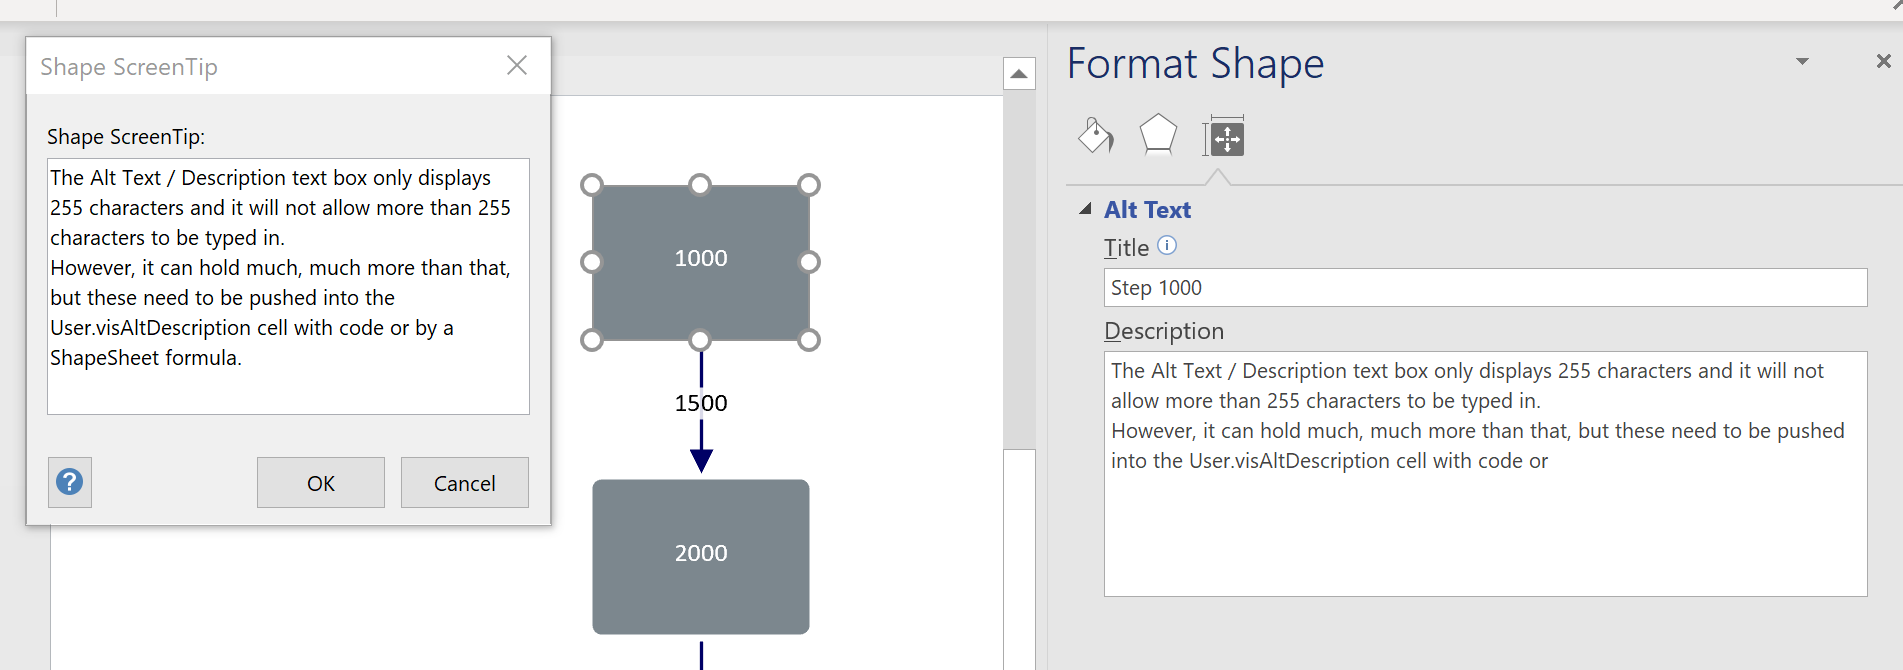
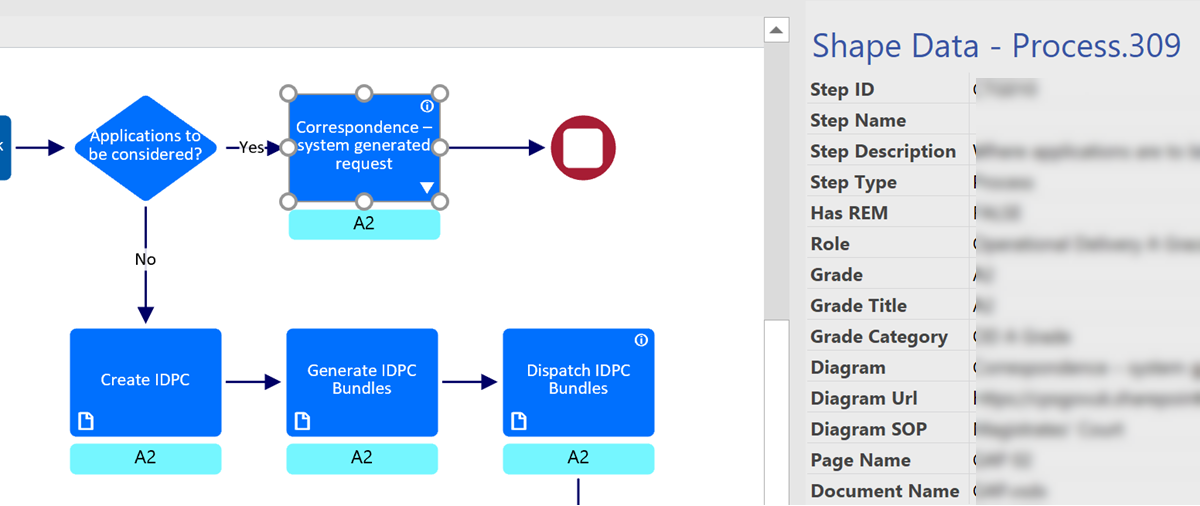
I am working on a project where Visio Online process diagrams are embedded within a SharePoint web page, and was surprised that the JavaScript onShapeMouseEnter() event was not being triggered as the mouse cursor moved over some of my shapes. After much searching by myself, and my colleague Seb Craft, we found that only the sub-shapes in the group were firing the event … So what was the problem?
[Read more…] about Triggering Shape Mouse Enter and Leave JavaScript events in Visio OnlineShapeSheet
Formatting SharePoint Columns with RGB Color
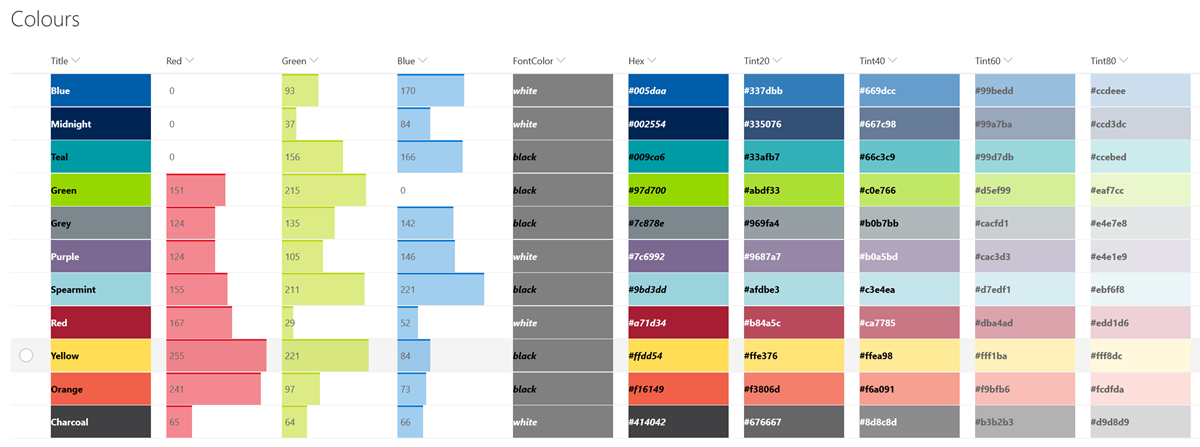
I wrote about ensuring high contrast between text and the background of Visio shapes in my last article. The RGB values actually came from an imported SharePoint list that has a lookup to a list that contains the RGB values of named colours. Having solved how to display the correct text colour for high contrast in Visio, I wanted to the same in a SharePoint column, but first I had to learn how to use the RGB values to format the background colour.
My good friend Chris Roth, aka VisGuy, has already produced Visio ShapeSheet formulas to convert RGB values to Hex values. so I adaptively re-used his idea to create a formula that I could use in a SharePoint calculated column, called Hex.
First, I compressed his multiple User-defined Cells rows into a single formula:
Ensuring High Contrast Text in Visio Shapes
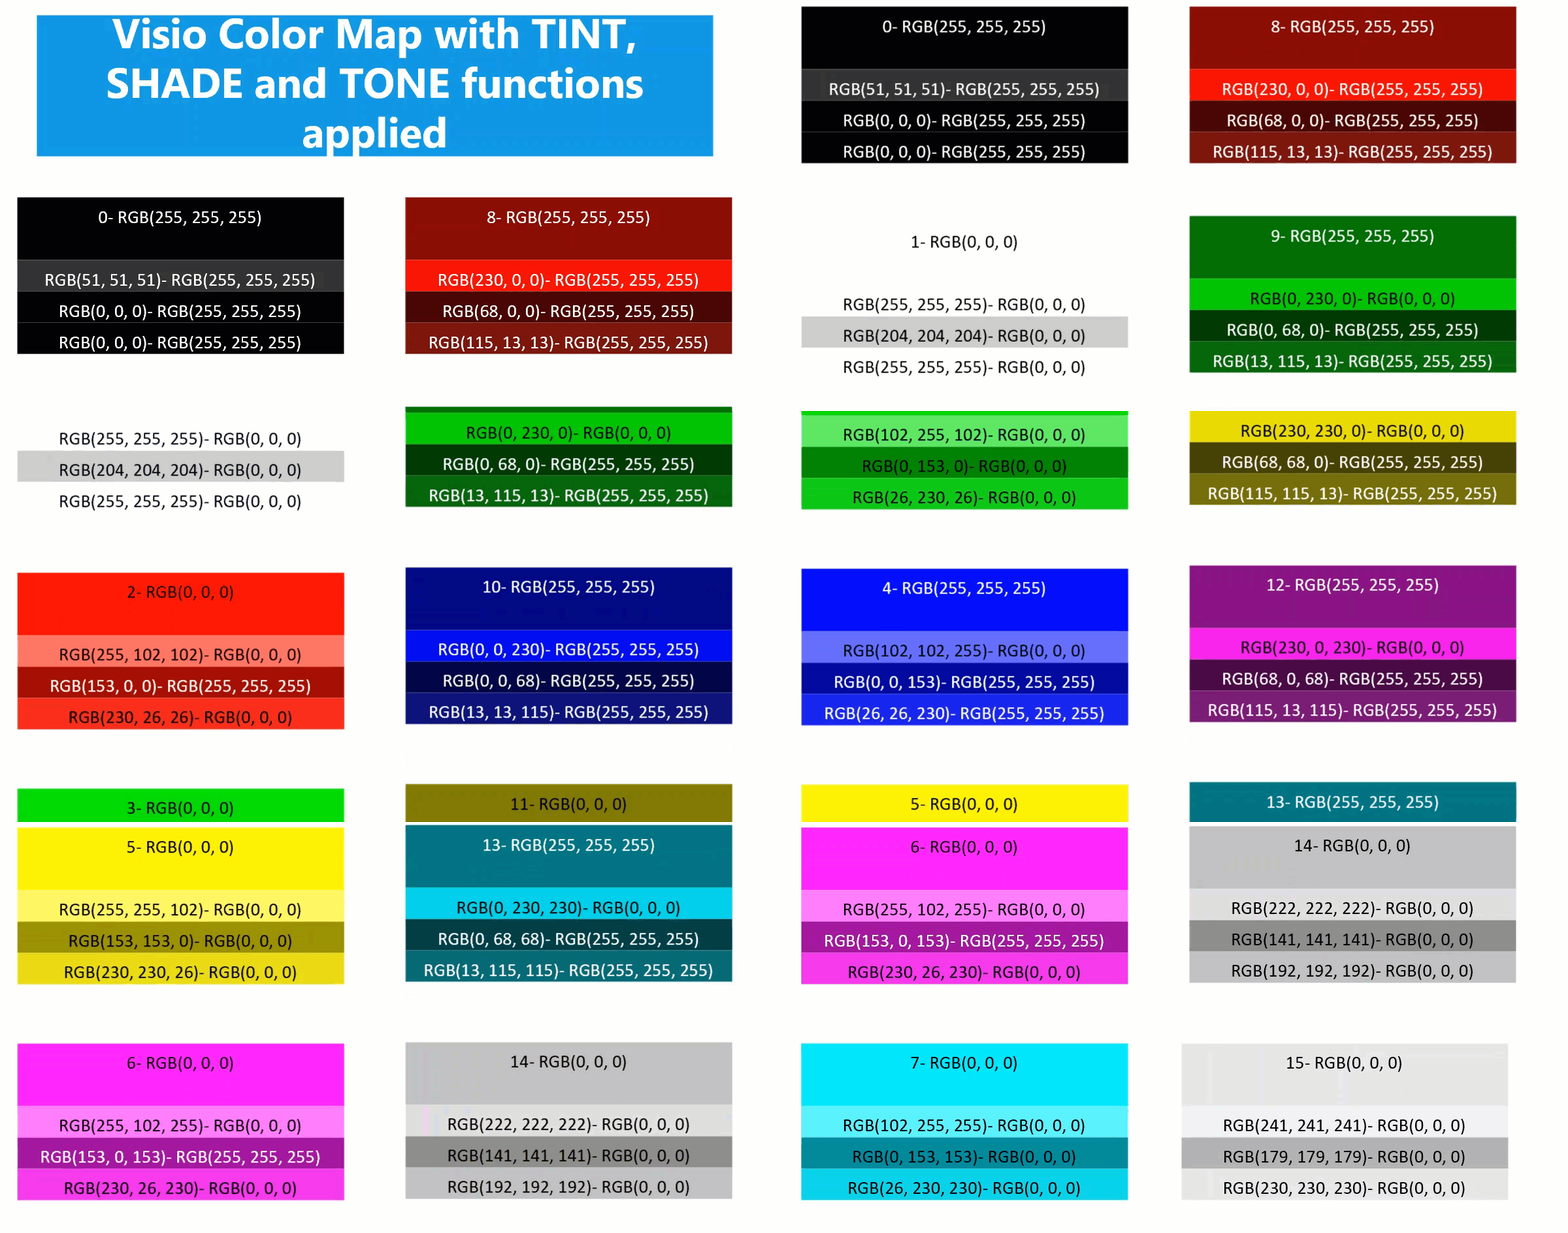
I am working on a project where I need to ensure high contrast of the text in the Visio shapes for accessibility. At first, I attempted to write my own formula but a colleague pointed my to a website that confirms if the contrast is acceptable ( contrast-ratio.com ), and showed me that a few of my examples failed. So the search was on for a better formula than my own. This lead me to a Stack Exchange answer with just what I was looking for (Formula for Color Contrast between Text and Background). All I needed to do was to convert this into a ShapeSheet formula or two, and then I could apply it to the text inside the shapes.
Any text created with Data Graphic Text Callouts cannot have the high contrast formula applied to because they can be moved independent of the background. However any text added with Insert / Field inside the shape changes between black and white with respect to the FillForegnd value in its background.
Following the article above, it is necessary to calculate the lightness, L, of the FillForegnd, and then to check if black or white text is going to provide satisfactory contrast.
Changing Visio Shape Size and Angle with Linked Data
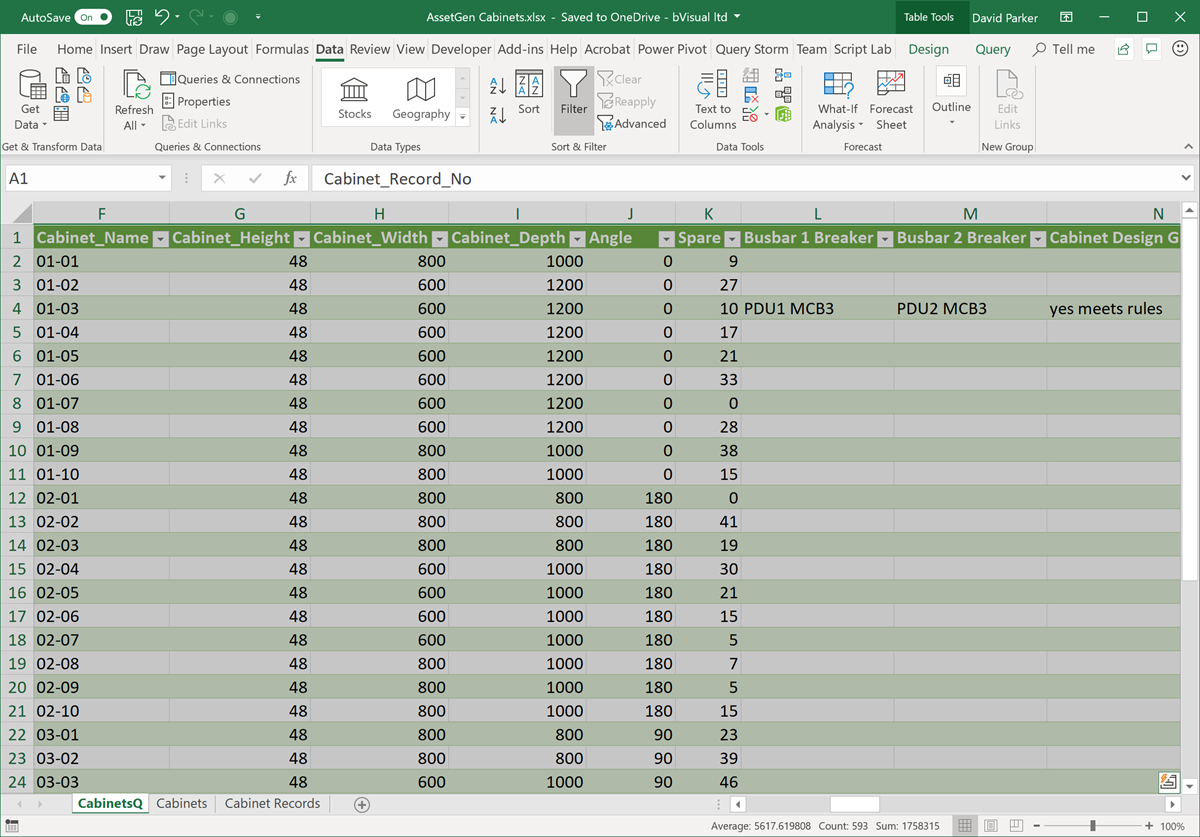
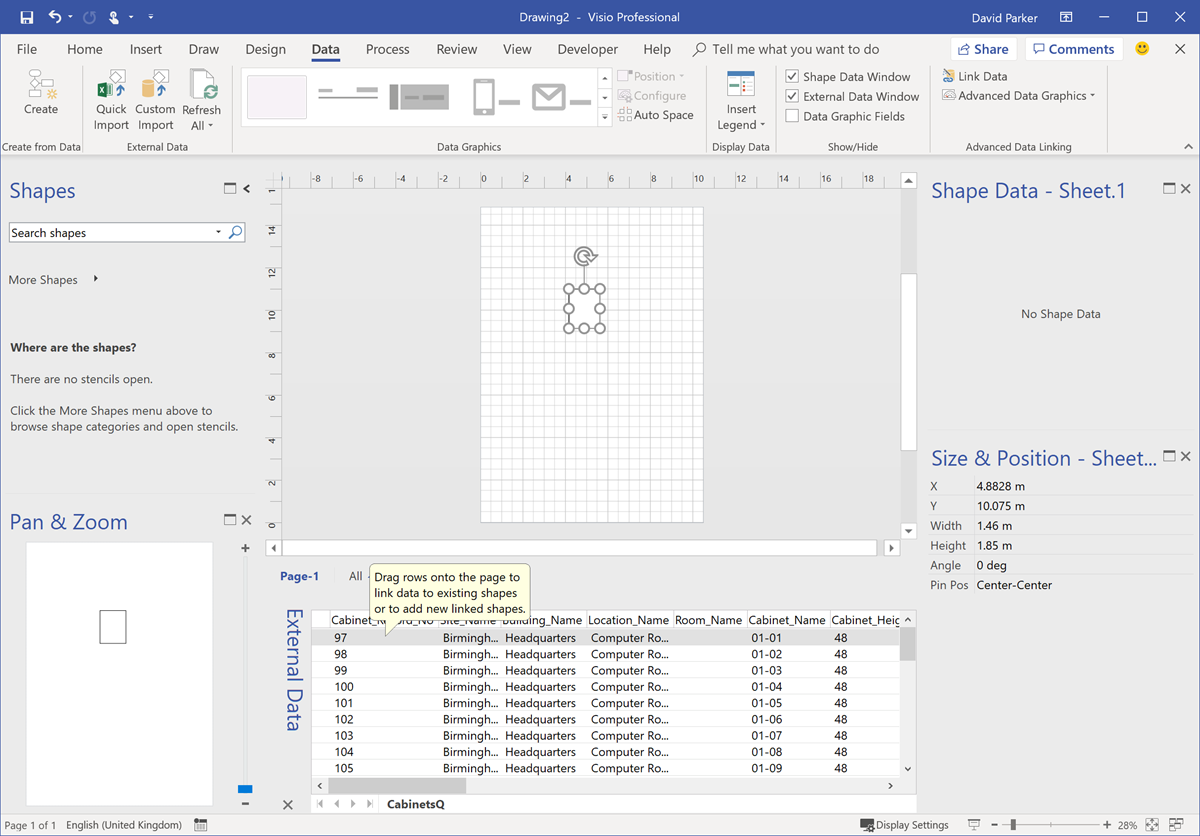
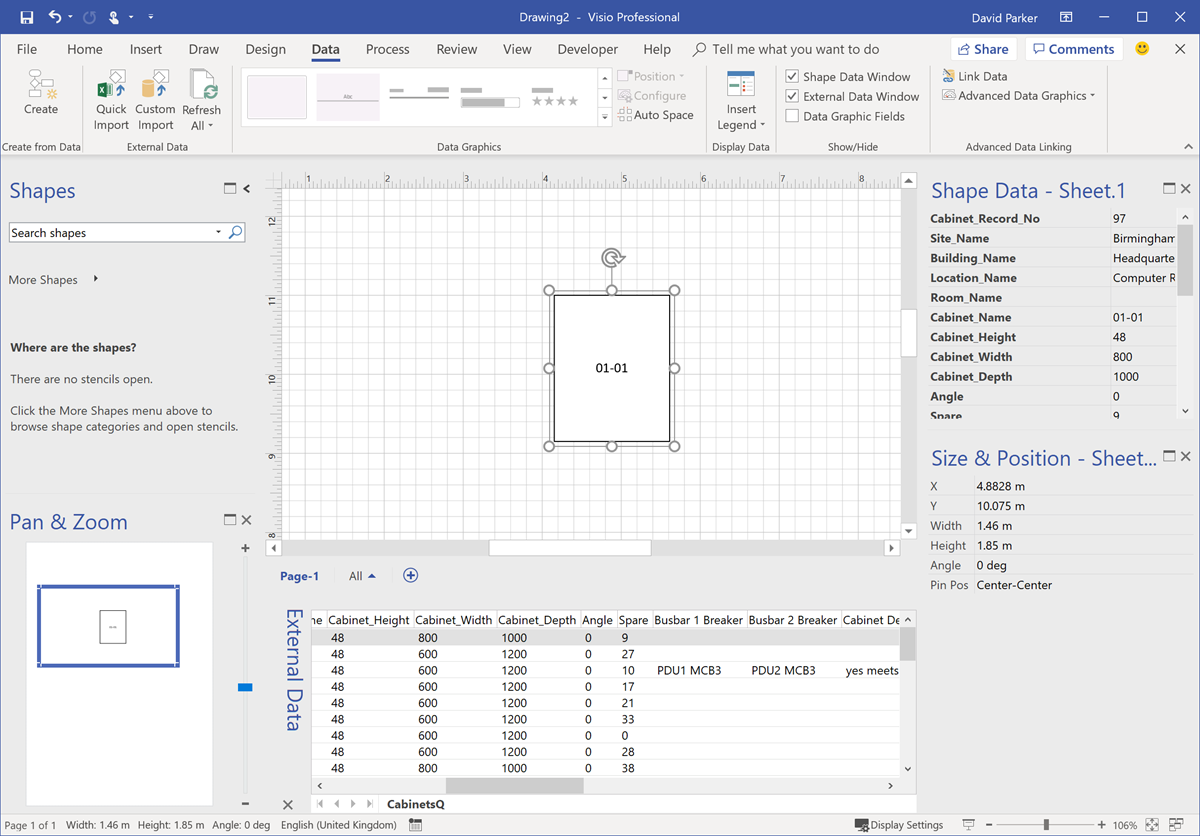
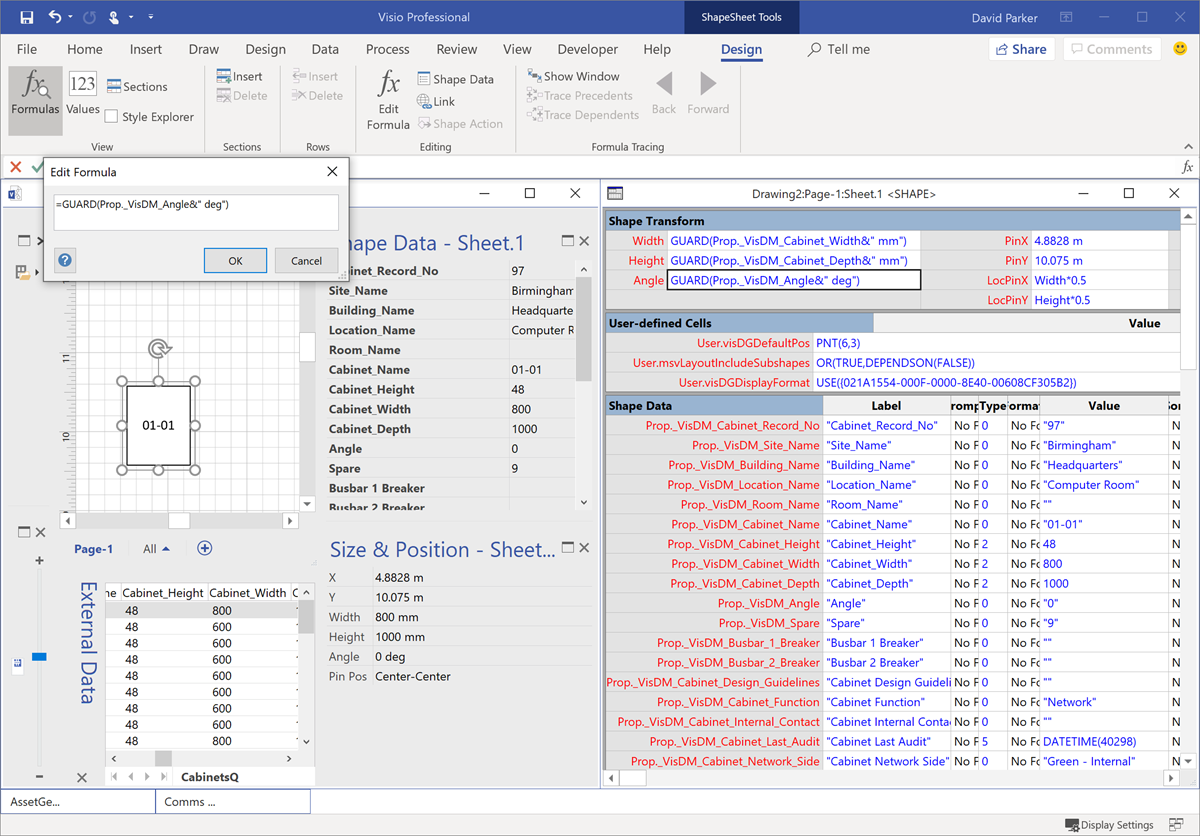
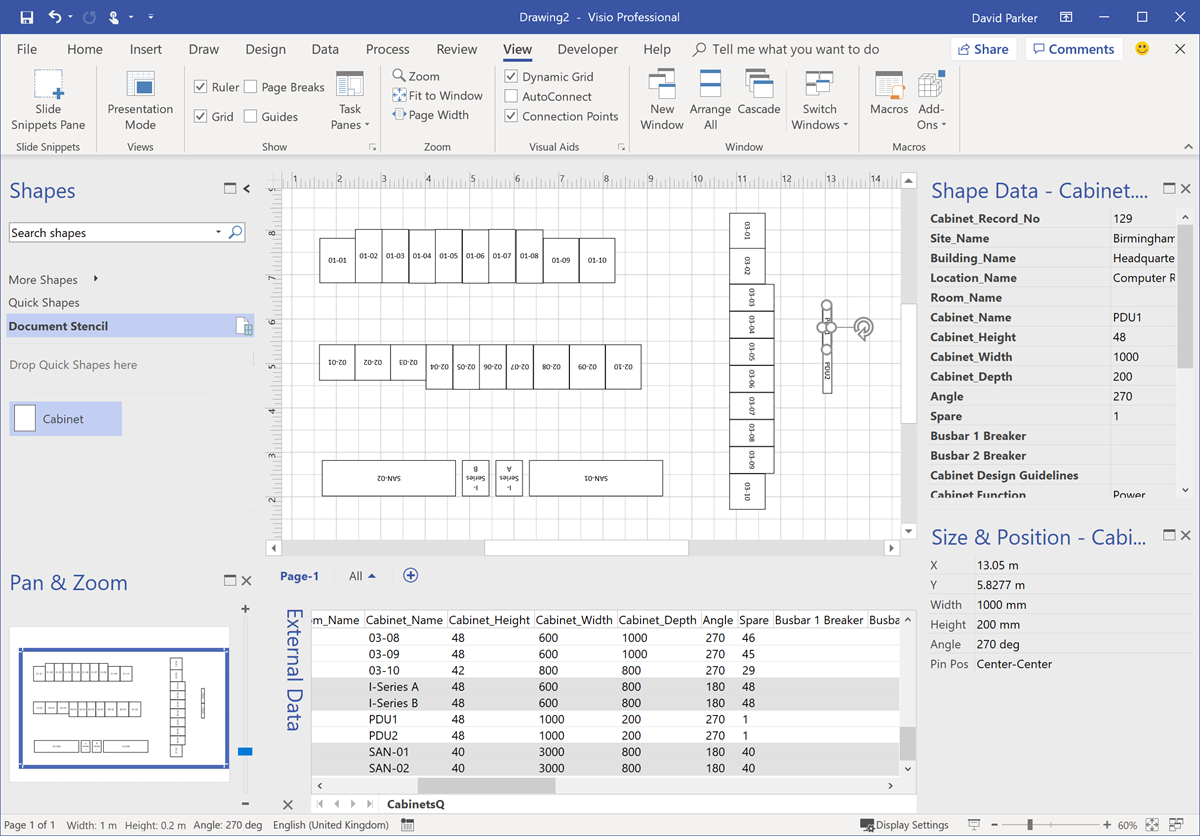
I was recently laying out a computer room floor plan to scale in Visio, from survey data of the cabinets\racks within it, and it occurred to me that I could work a bit smarter than I first thought. Originally, I was going to just add lots of rectangles, size them, rotate them, and label each them with their name. Then I thought, why not use the Width, Depth and Name columns from the survey data to do most of the work for me? It was so simple to do, and only took a few minutes, so I thought I would share my methodology because it demonstrates how easy it is to work smarter with Visio….
These are the simple steps shown above, written out for your education….
[Read more…] about Changing Visio Shape Size and Angle with Linked DataPrototyping Visio ShapeSheet Formulas in Excel
I am working on an application where the horizontal axis of the Visio page represents dates from left to right. In fact, the each of the fixed horizontal grids are 1 day, and I need to have shapes that understand the begin date at the left edge of the shape, and the end date at the right edge of the shape. There is, therefore, a number of elapsed days representing by the width of the shape. However, the underlying grid can either represent all days, or it can be changed to only represent weekdays by omitting the weekends. I struggled to find the best formula to calculate the elapsed days or weekdays between two dates in Visio ShapeSheet formulas, so I turned to Excel to provide an inspiration. The Visio ShapeSheet is modelled on the Excel worksheet, and formulas can be entered into the cells in much the same way. However, the available functions differ since Excel is mainly used for arithmetic and statistics, but Visio is used for graphics and data. In this article, I demonstrate how I used C# and Excel to construct and test formulas for use in a Visio shape.
[Read more…] about Prototyping Visio ShapeSheet Formulas in ExcelReplacing Images in Visio Shapes by Changing Data
I wrote an article last year about Swapping Images in a #Visio Shape manually, but I want to be able to do this whenever a Shape Data value changes. This is because I use I invariably use shapes linked to data. I also want to be able to have multiple images within a single grouped shape, and all of them changing when their referenced Shape Data values change. I believe that this will be more adaptable for a lot of scenarios than trying to repurpose Data Graphic Icon Sets ( see Make Your Own Visio Data Graphic Icons Sets … automatically). I also discovered that the Shape.ChangePicture(…) function can just as easily work with urls as it can with network file paths, so even more possibilities are opened up! For example, the Visio Online JavaScript API has the ability to overlay an image (see ShapeView.addOverlay(…)).
So, I have created some macros to provide quick and easy selection, positioning and updating of images within a group shape.
I decided to present this article with VBA code rather than my preferred C# so that a stencil could be downloaded to provide instant usability, rather than having to install an add-in. It can be download from Image Utils.vssm, and should then be placed in to My Shapes folder, so that it becomes available to open in Visio. When it is opened, then the macros will need to be enabled.
There are just five public macros: