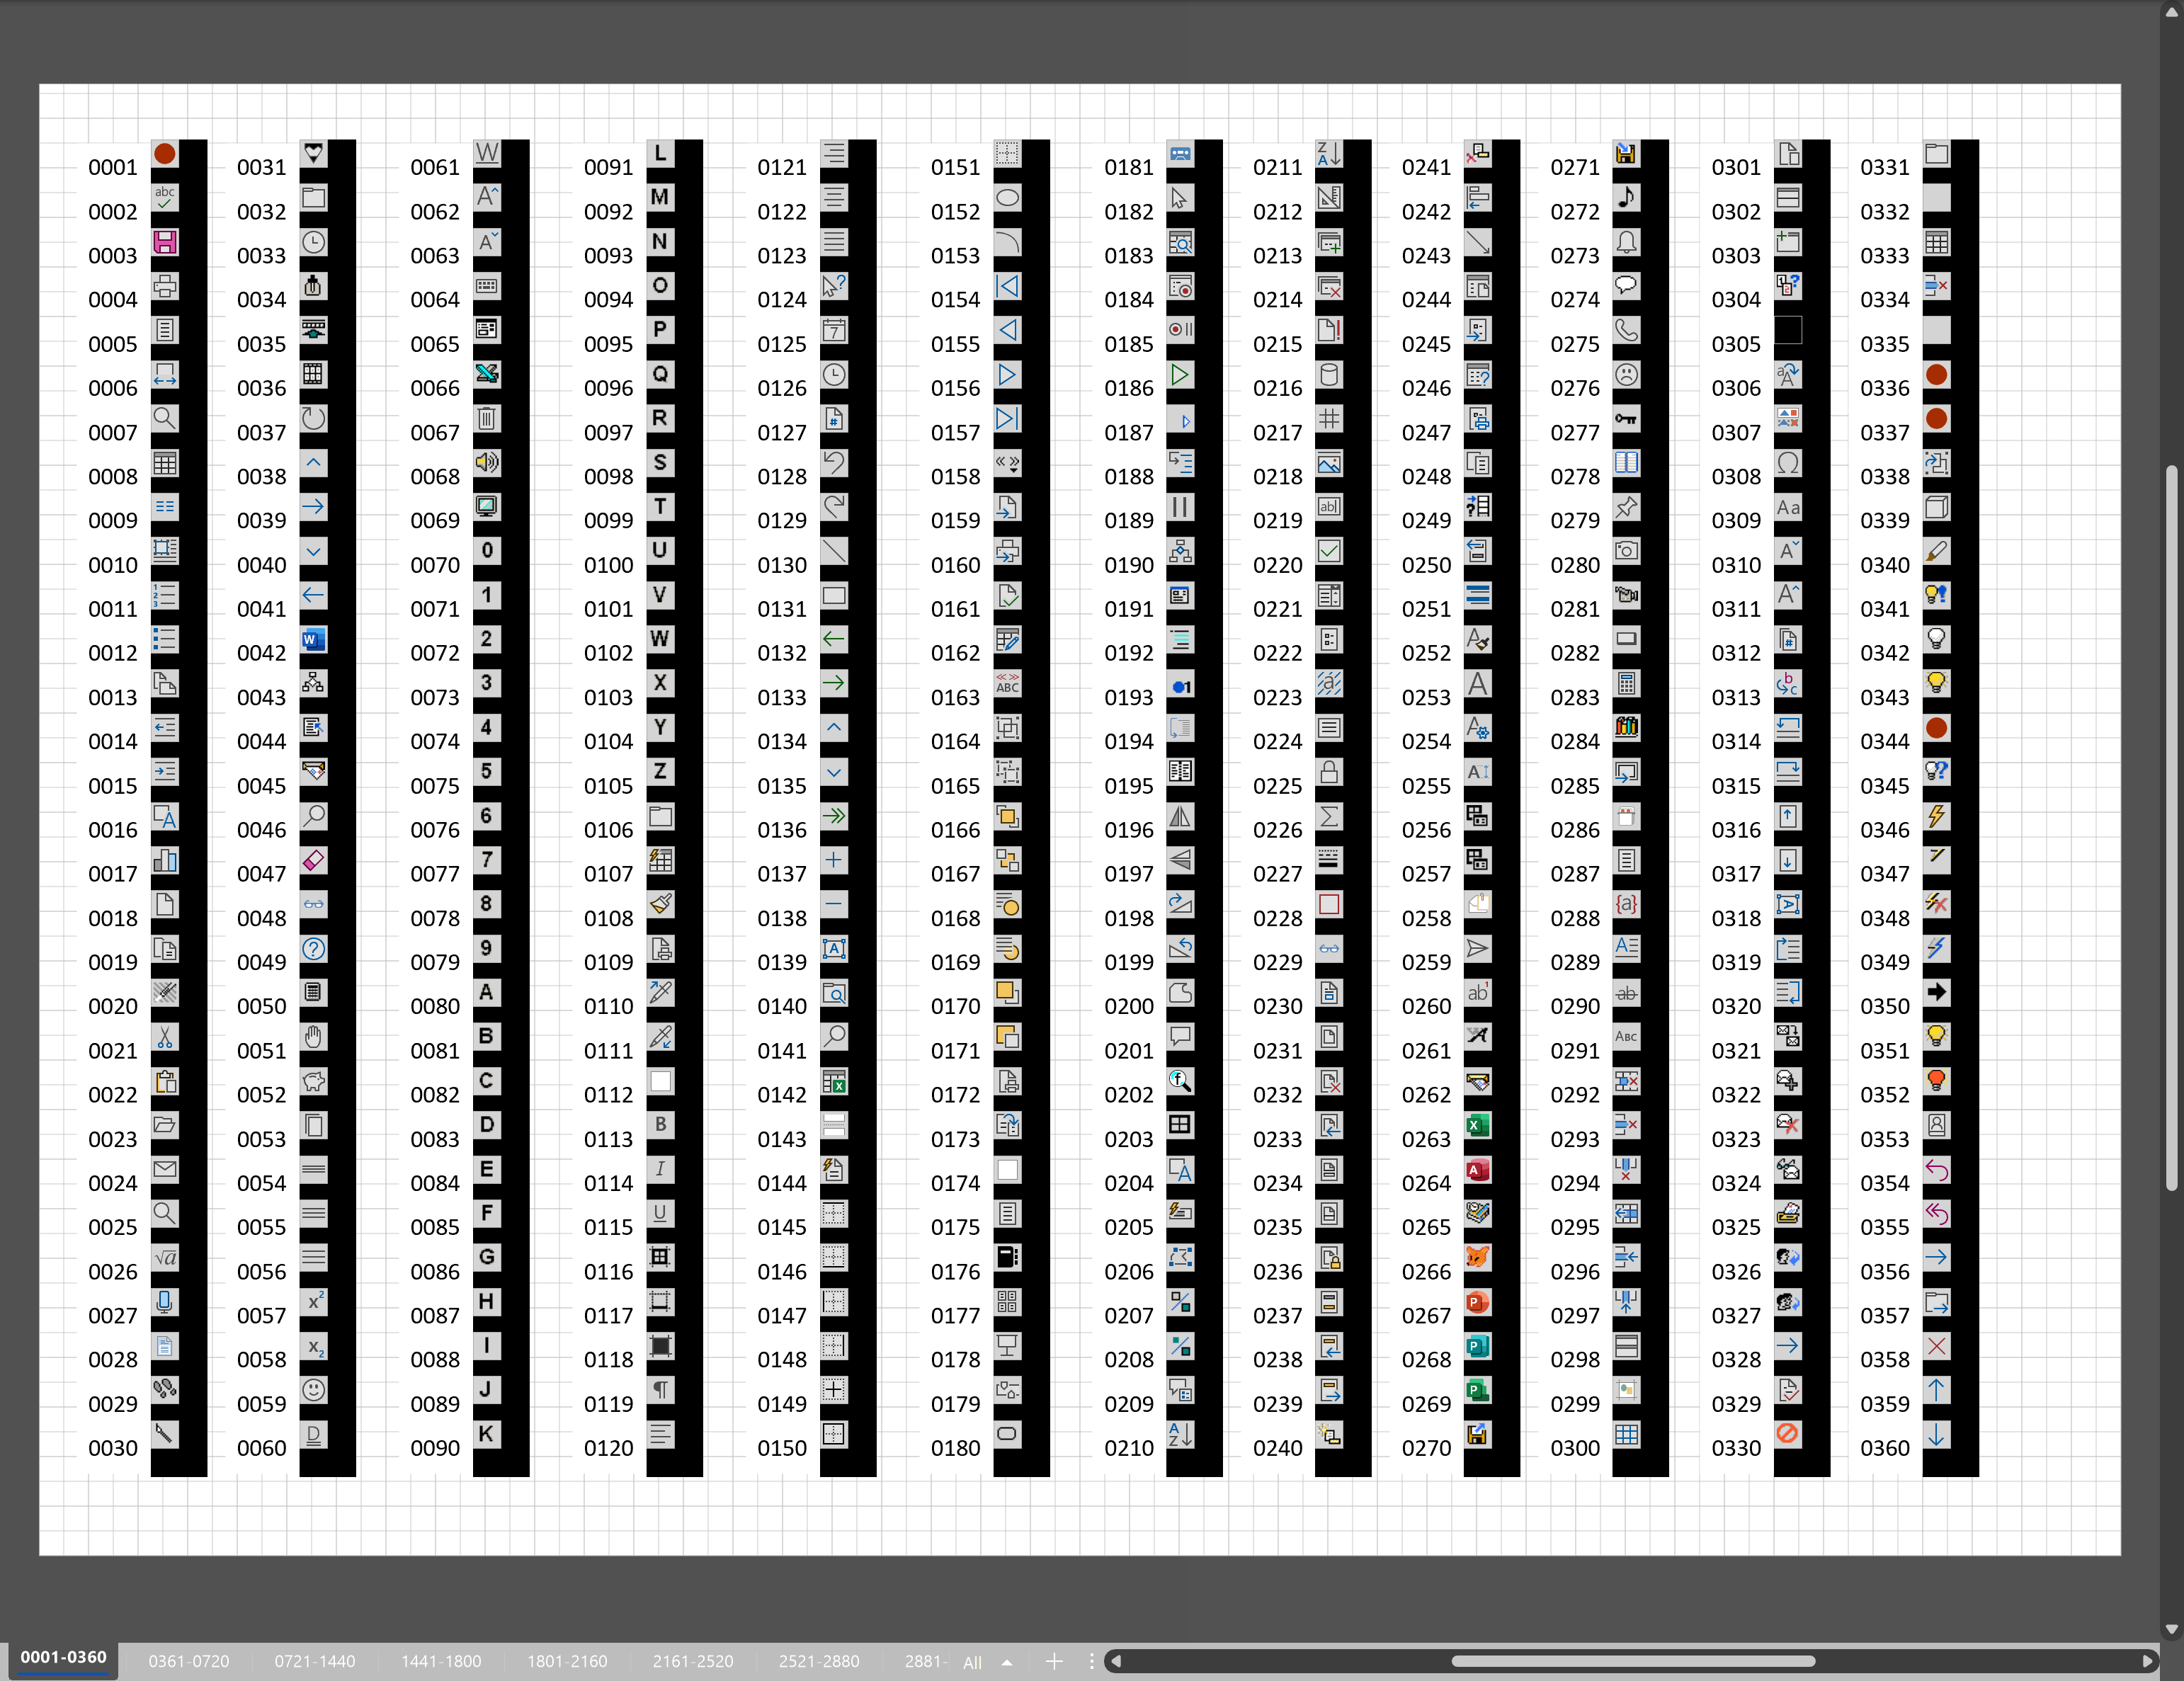
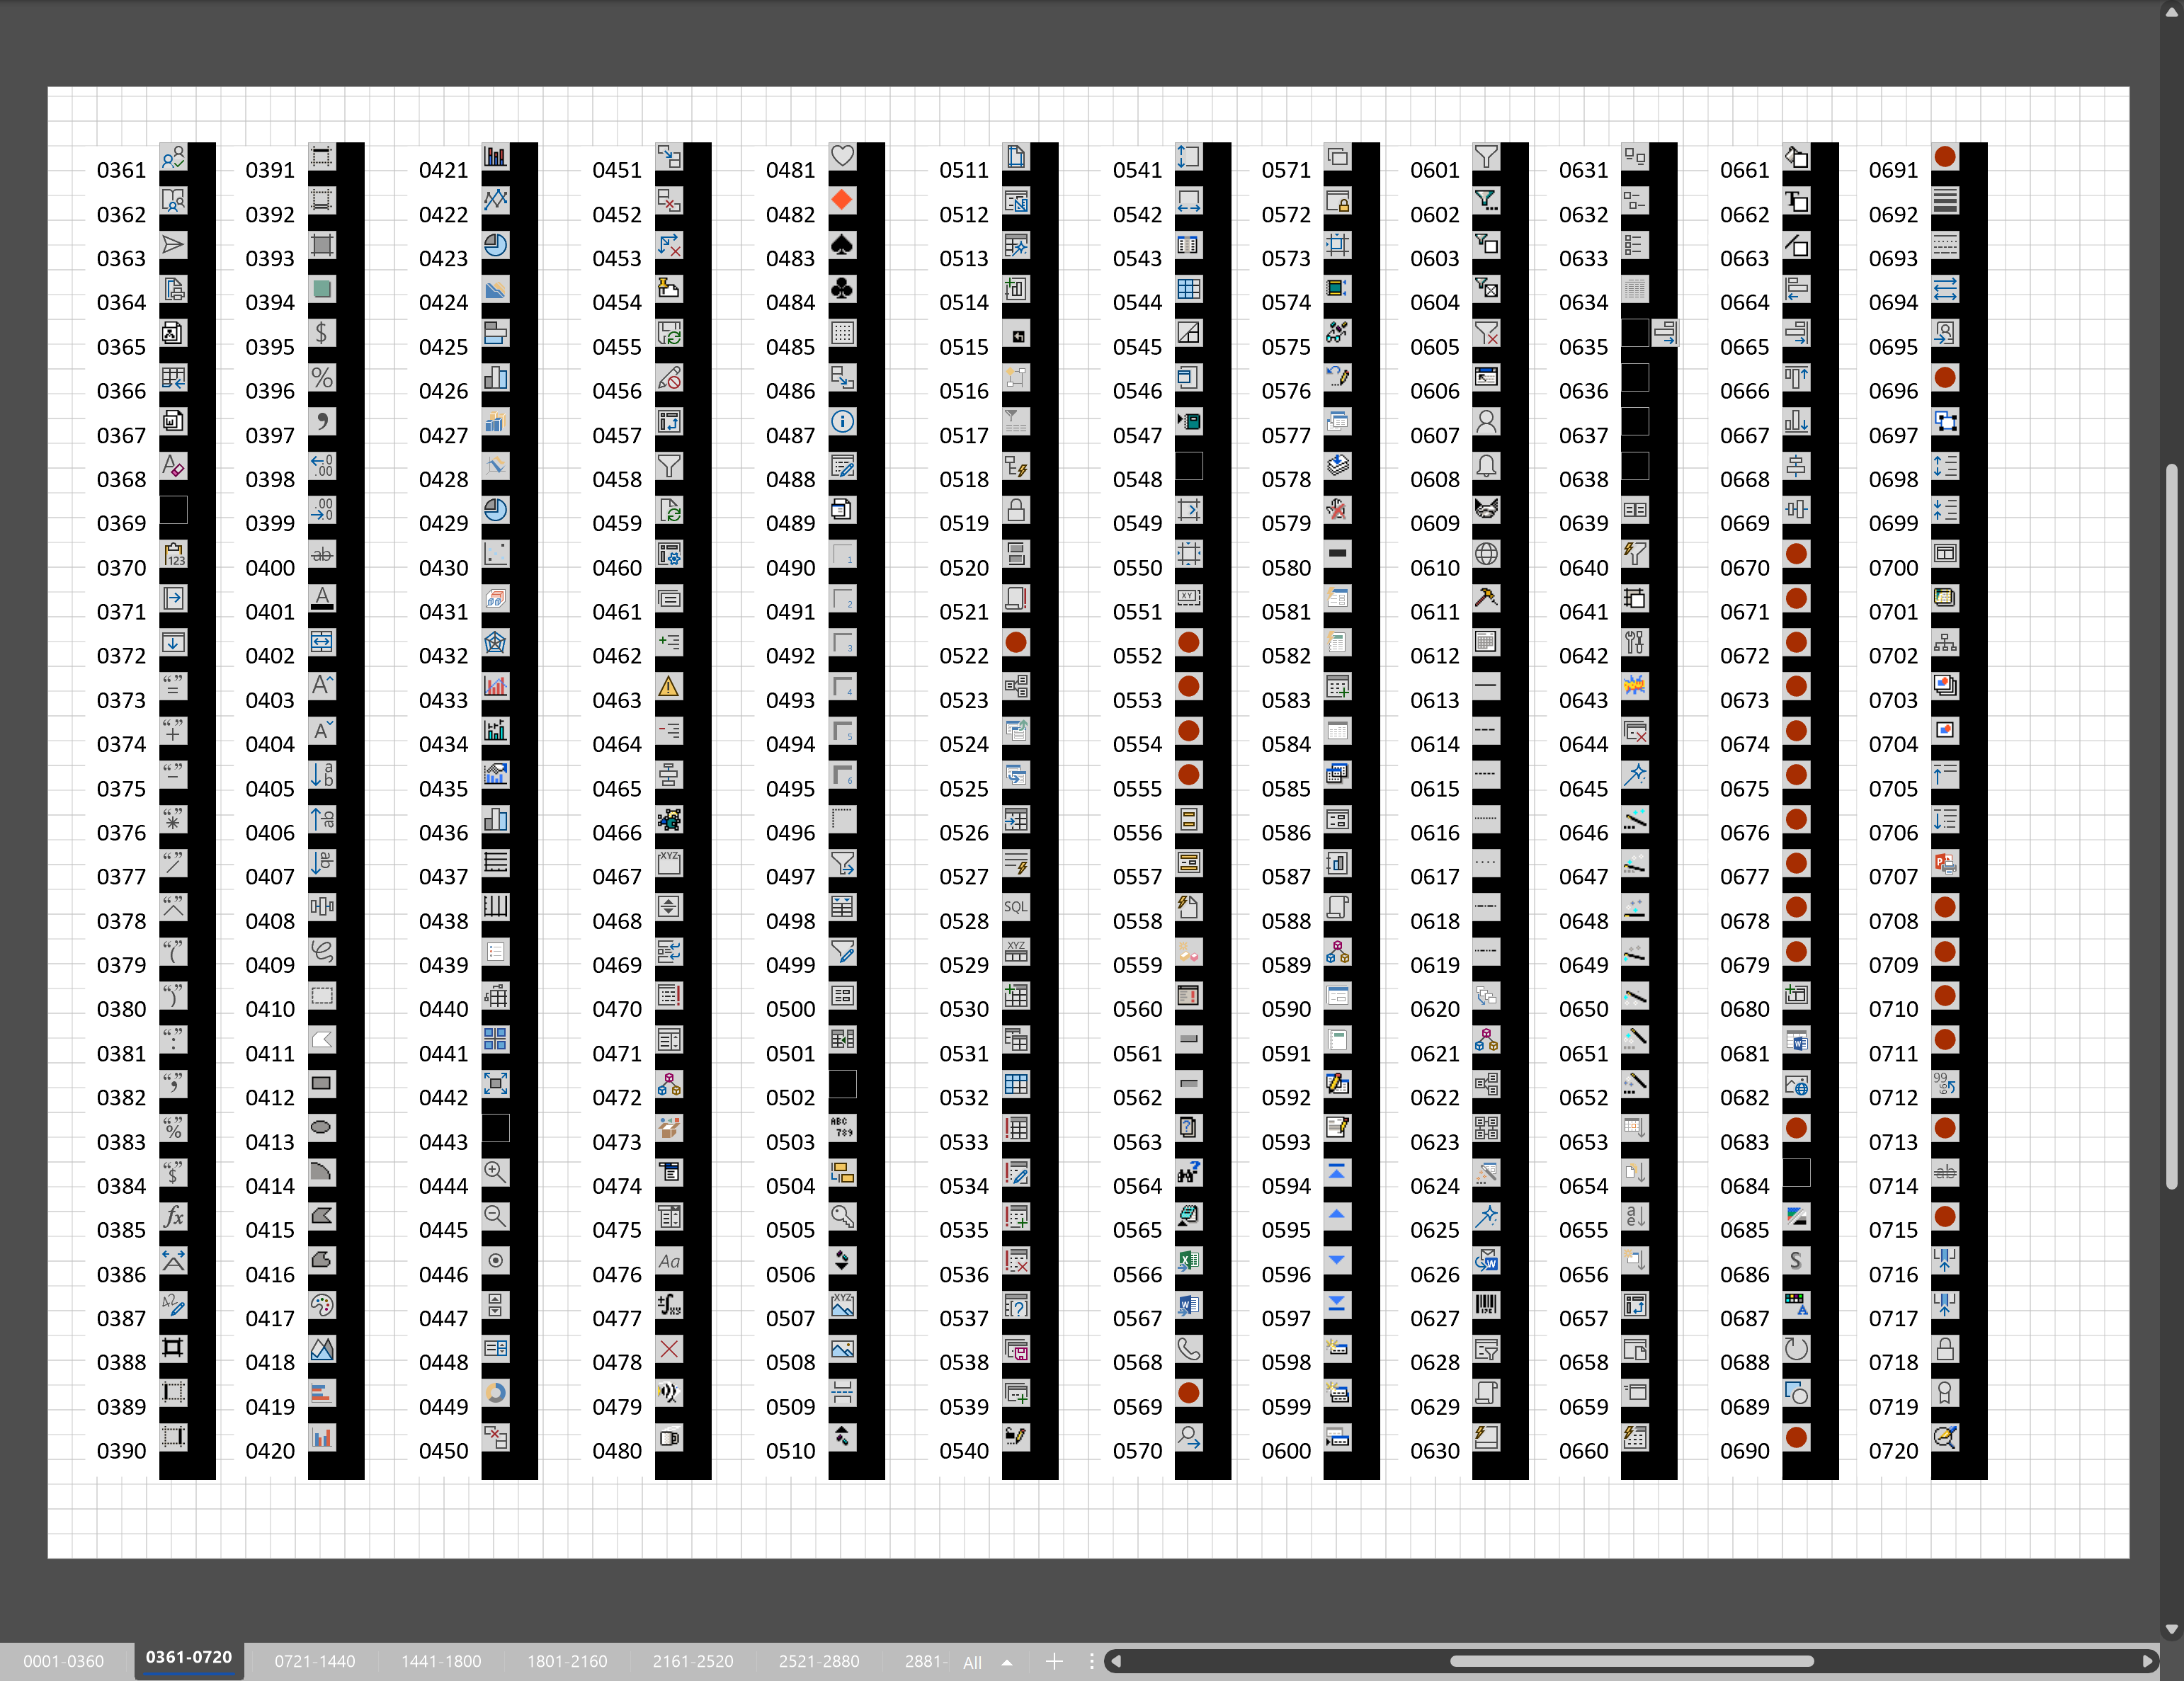
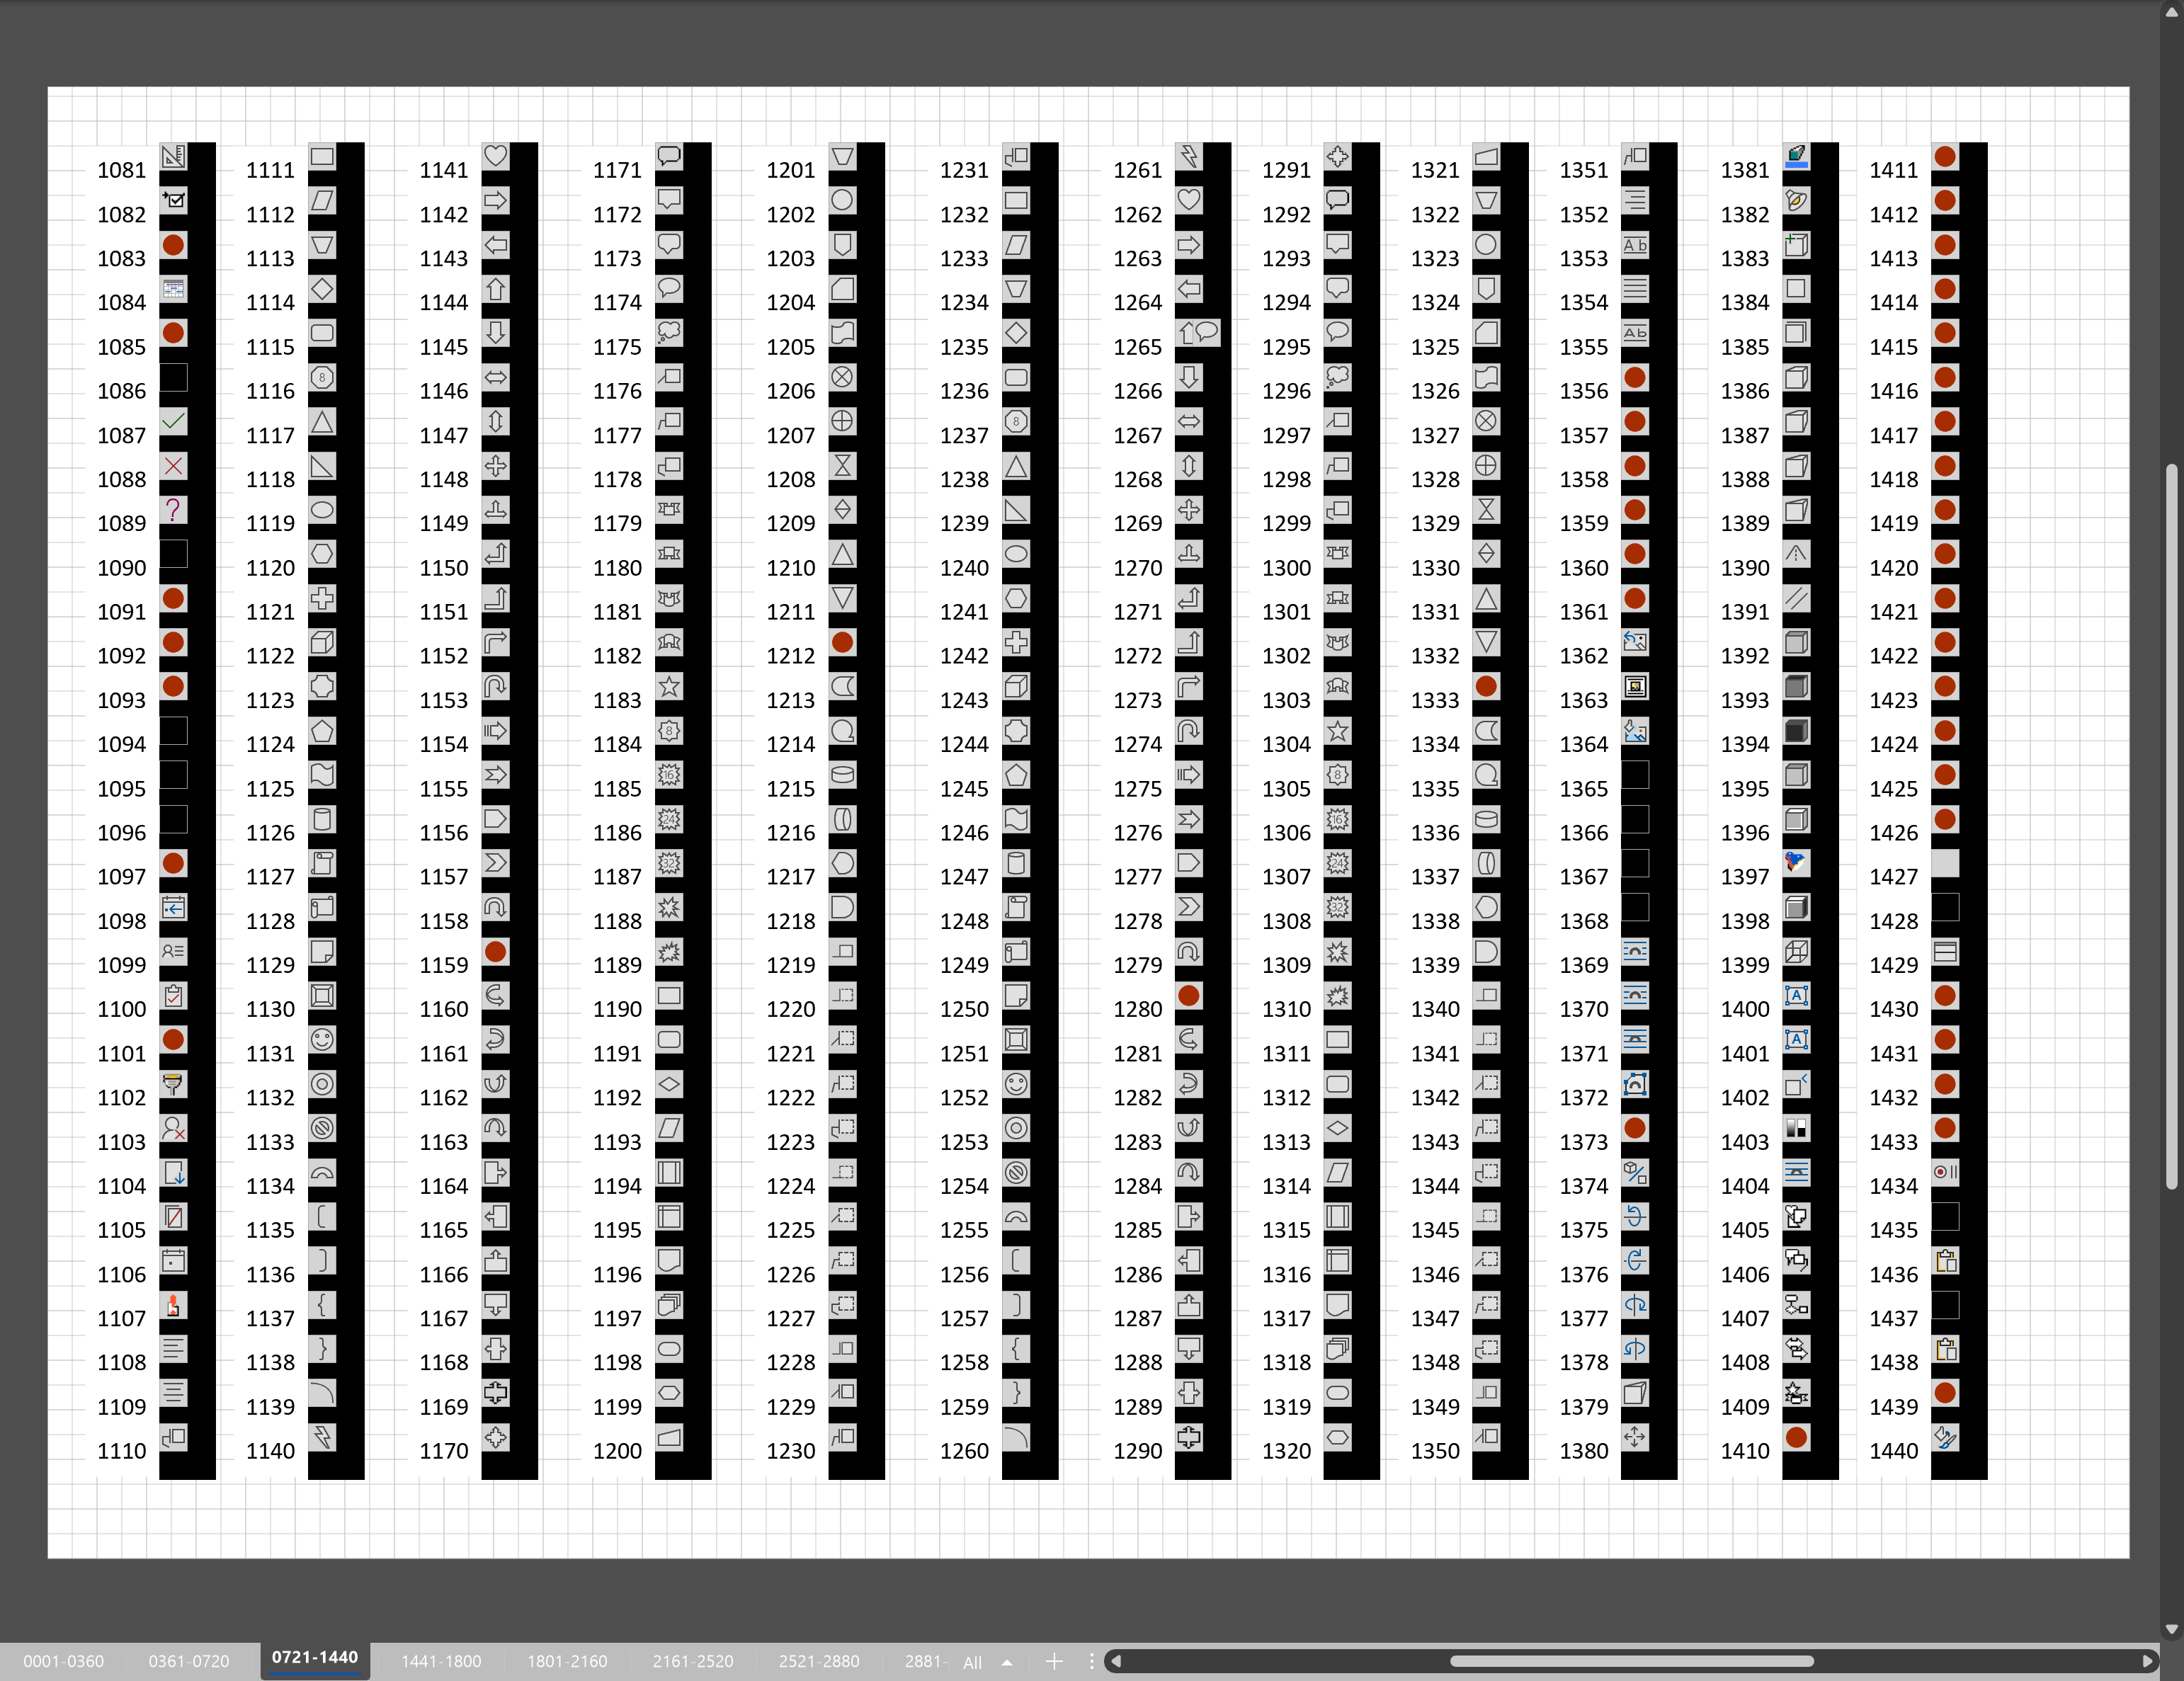
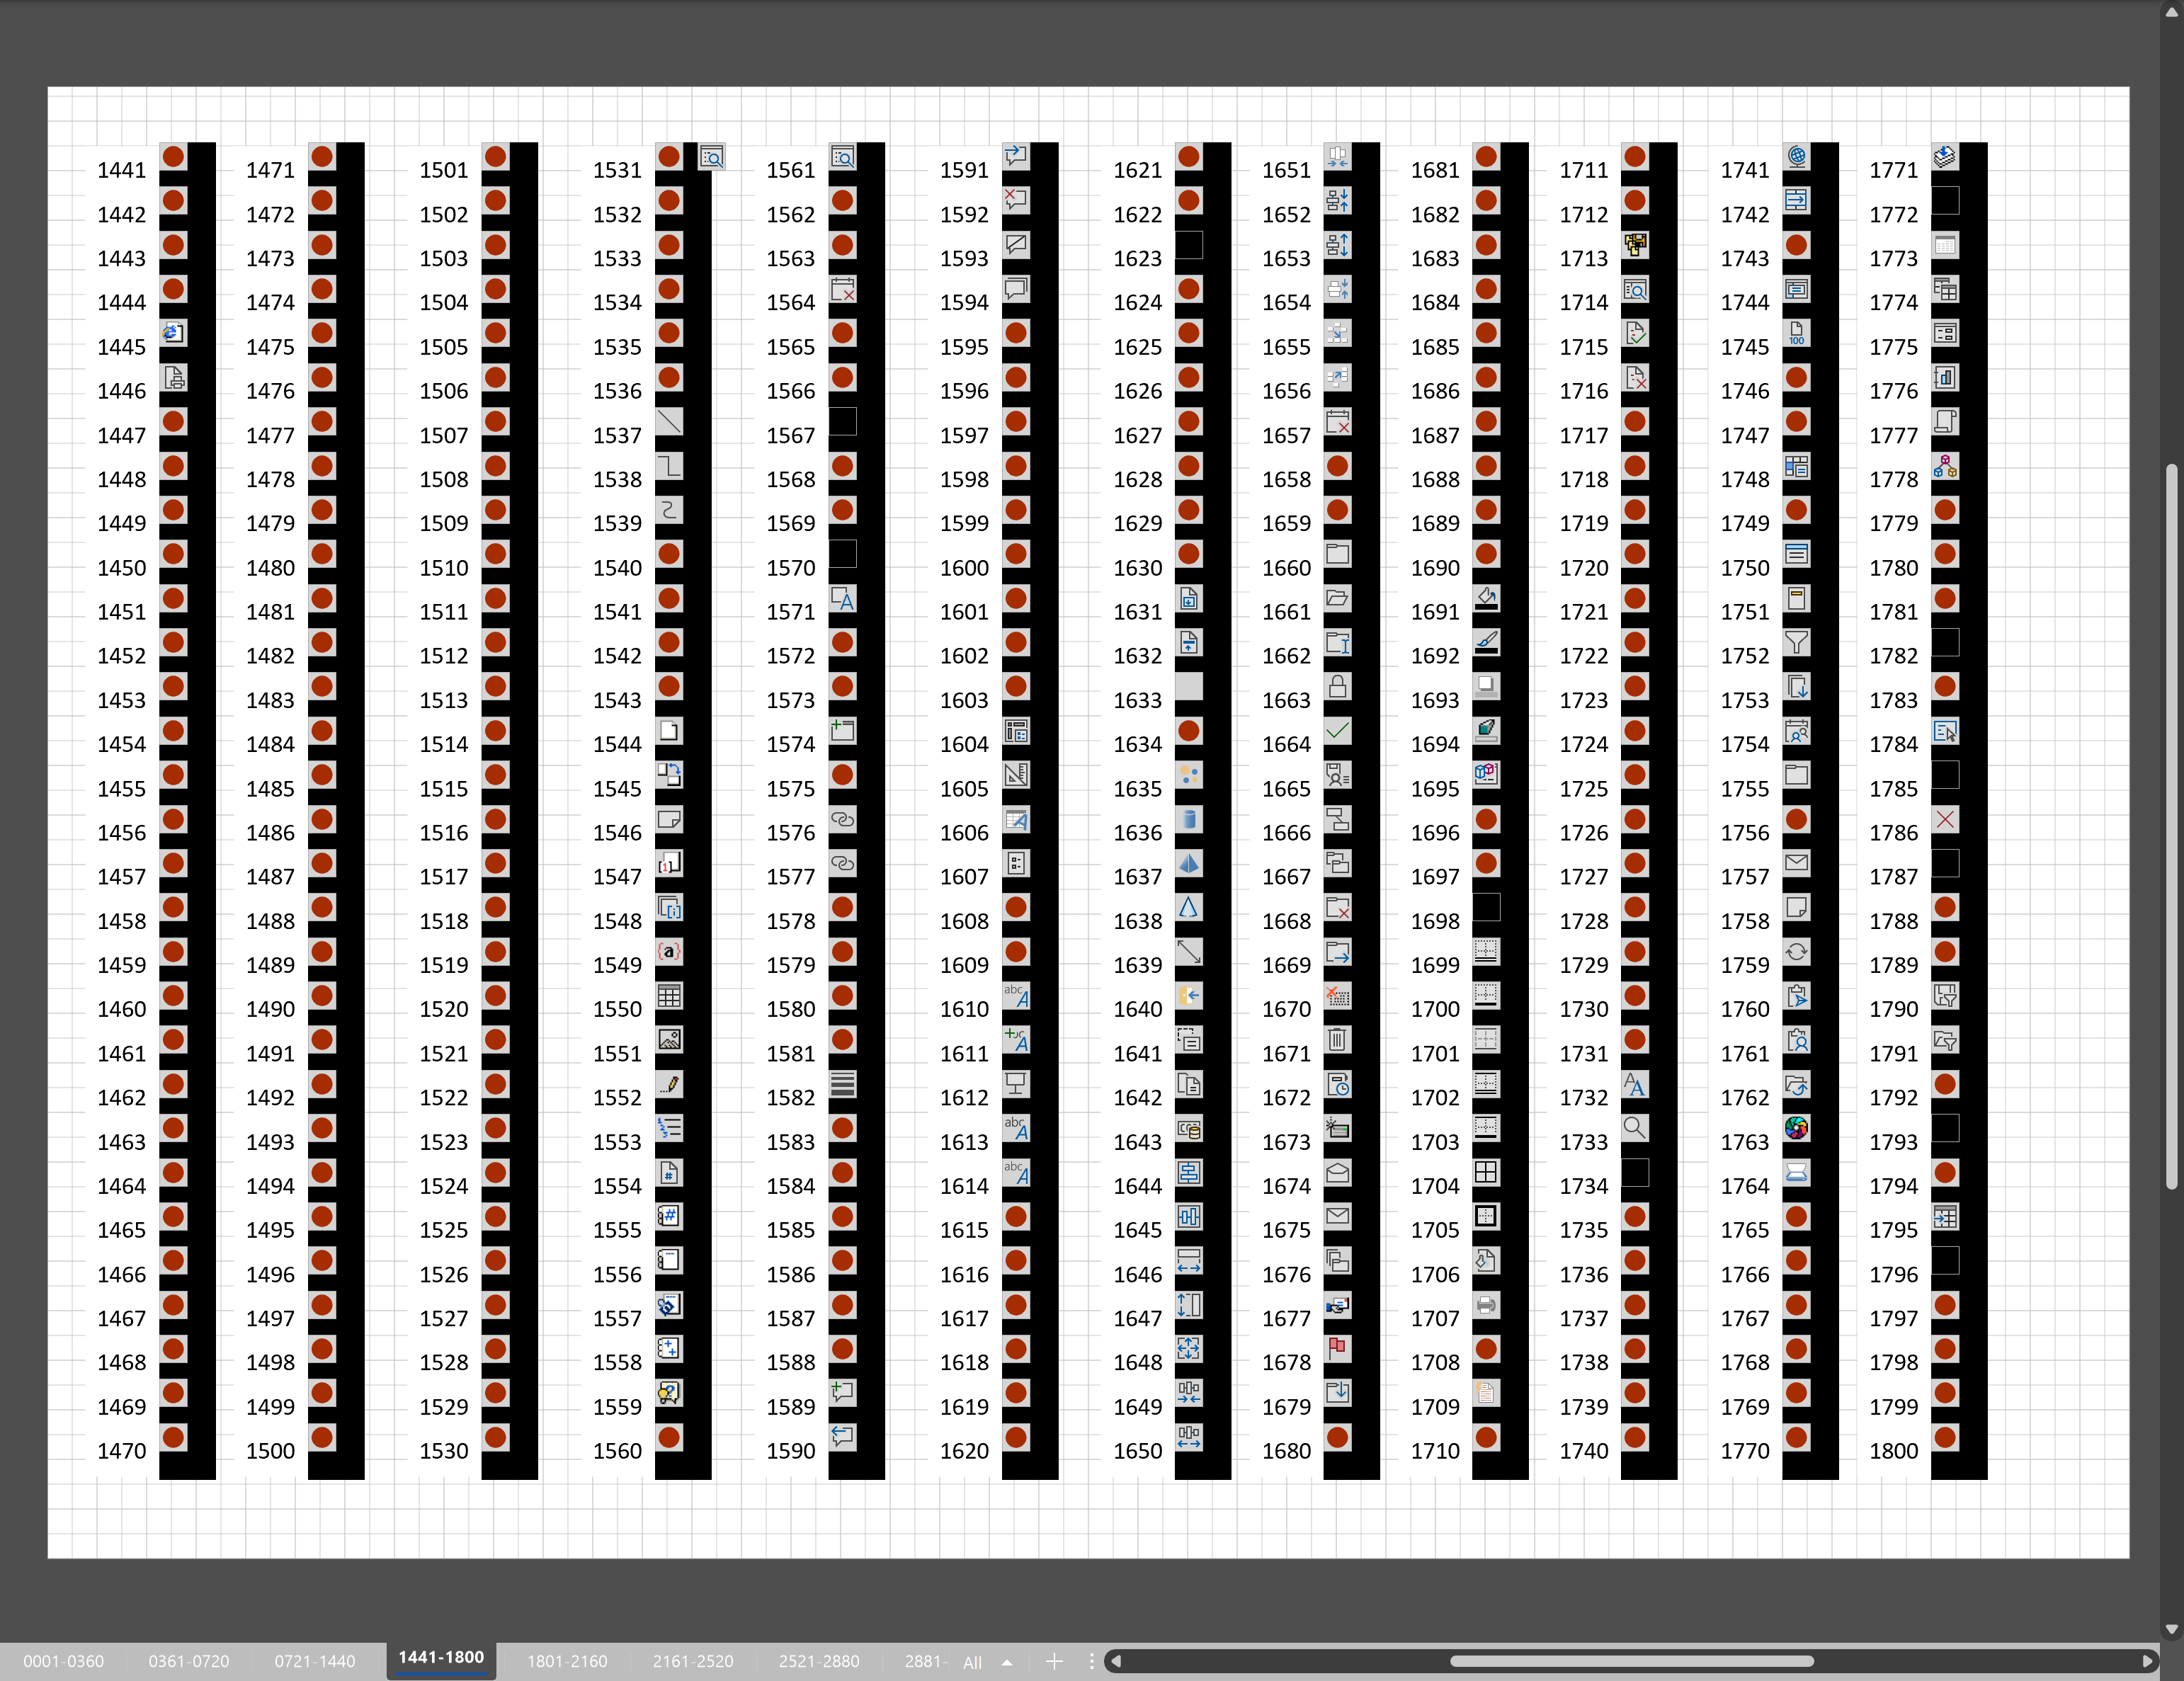
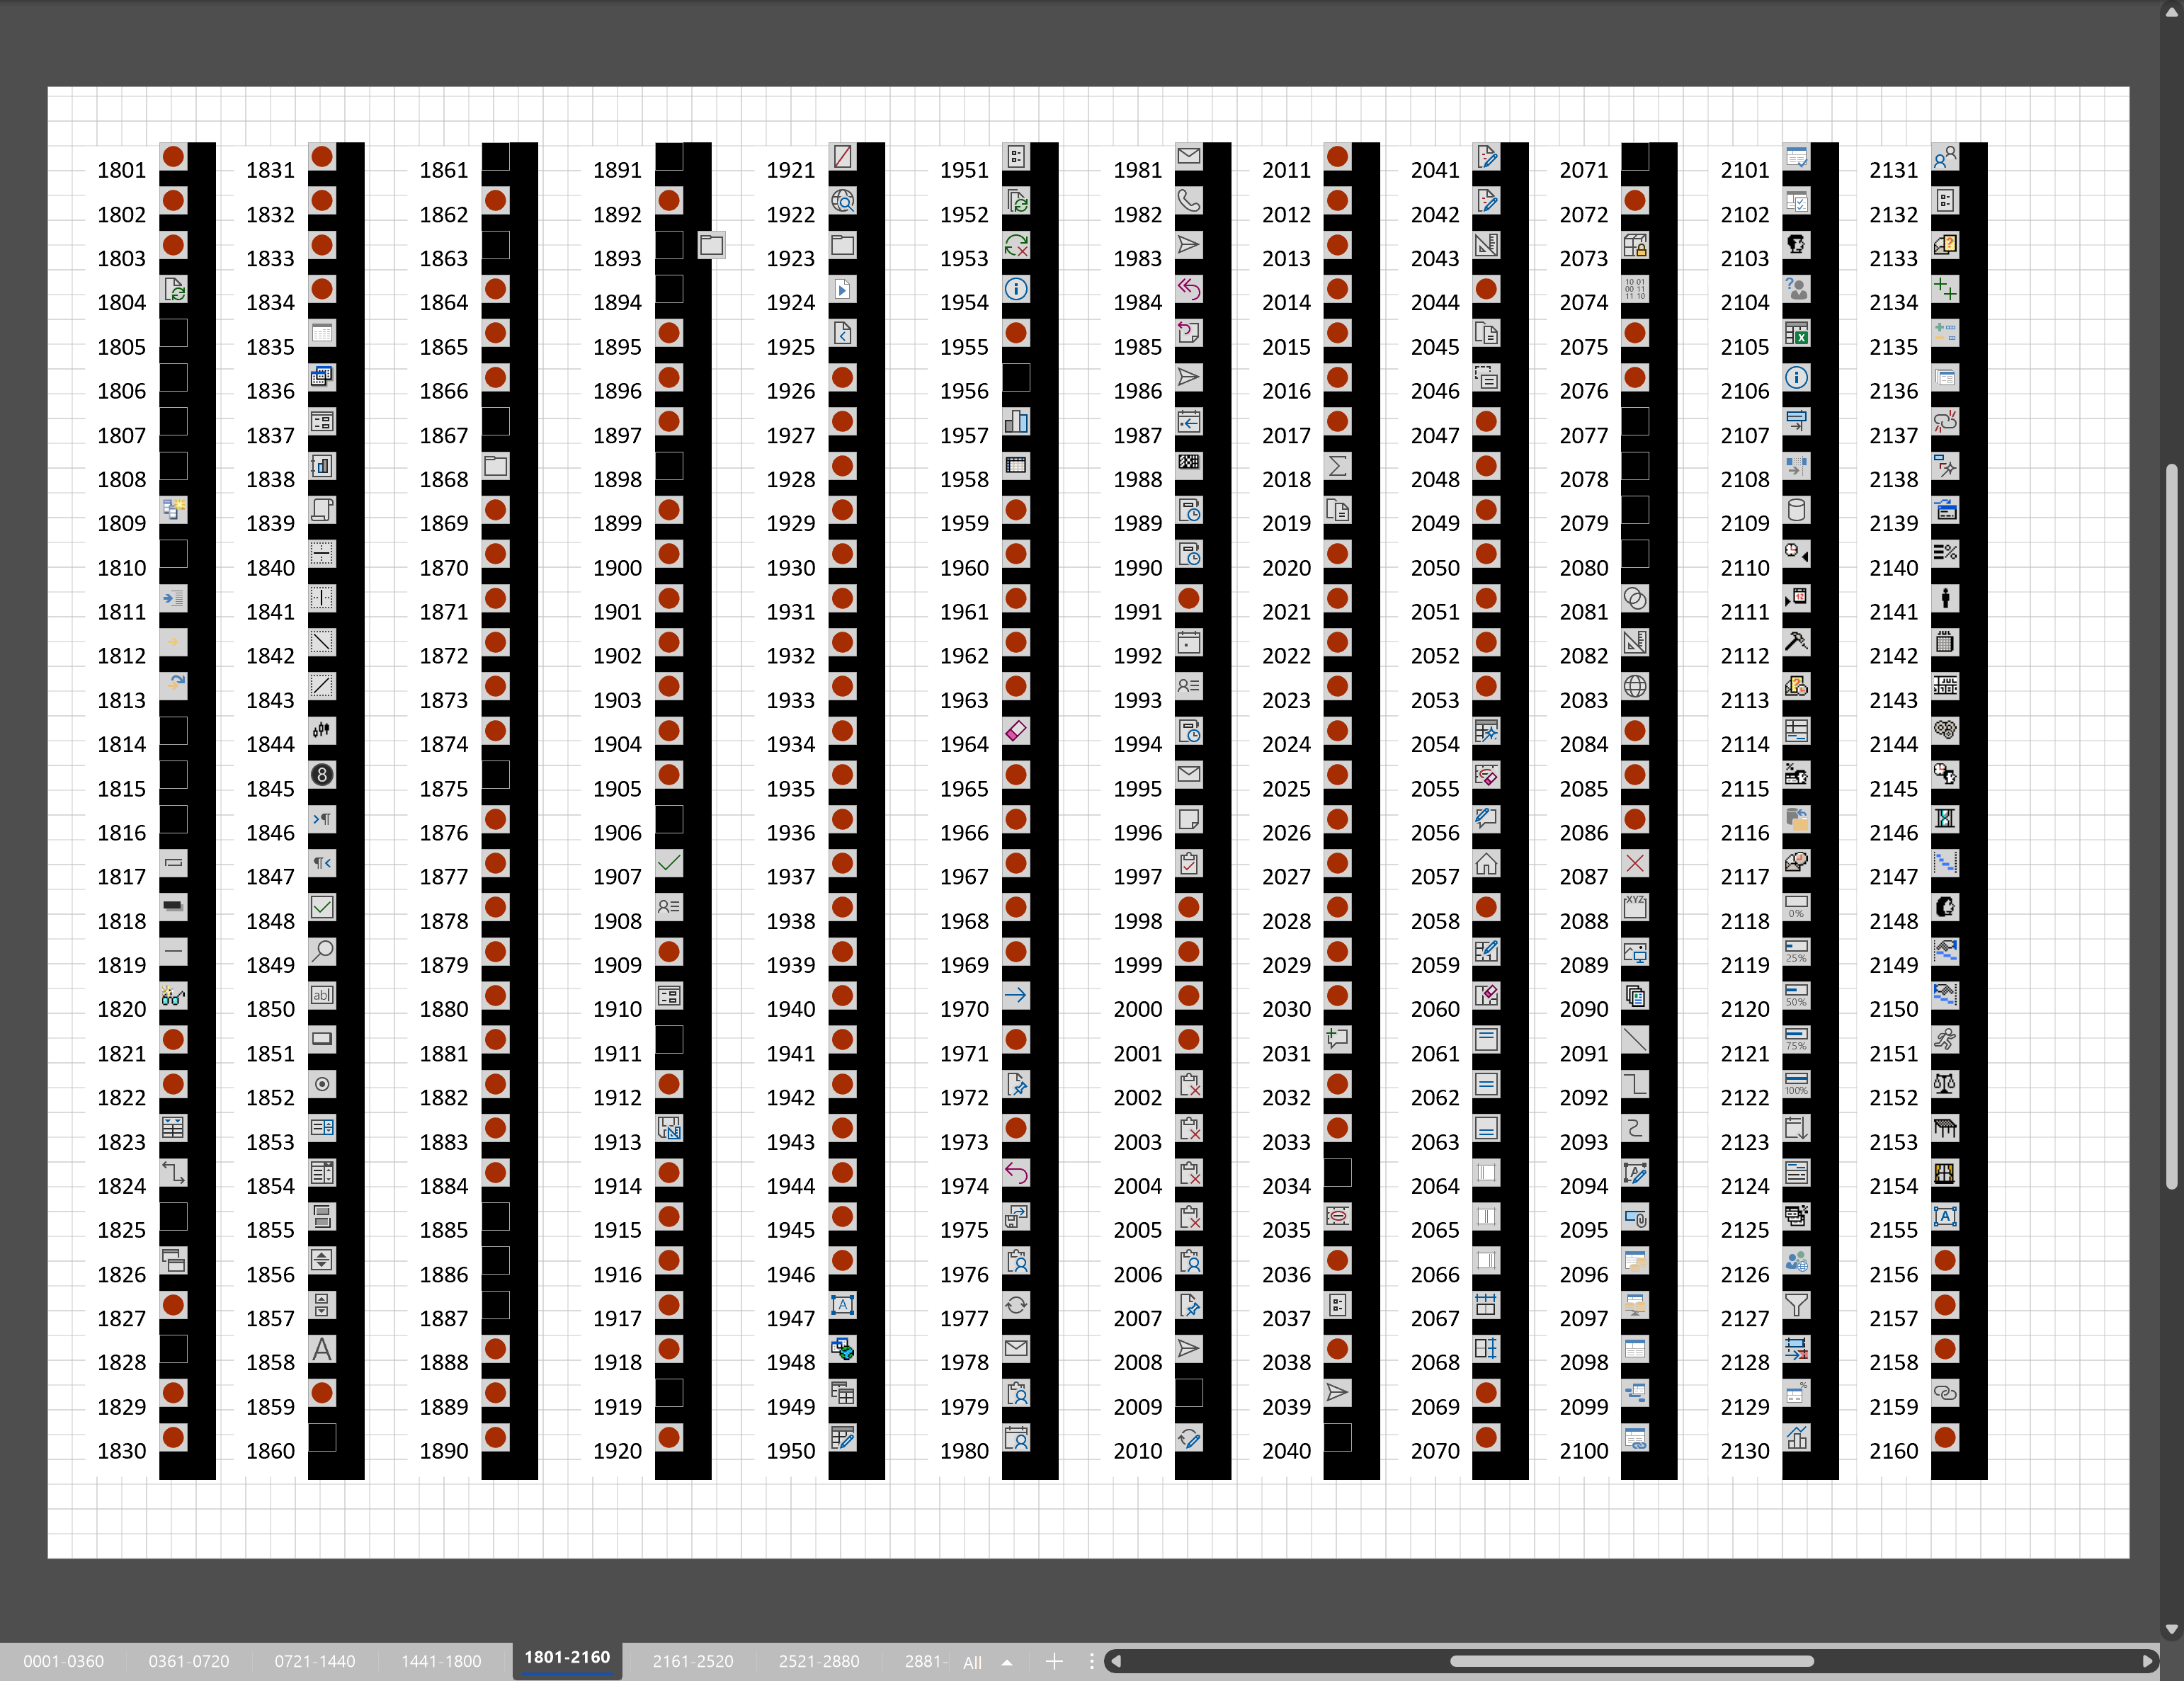
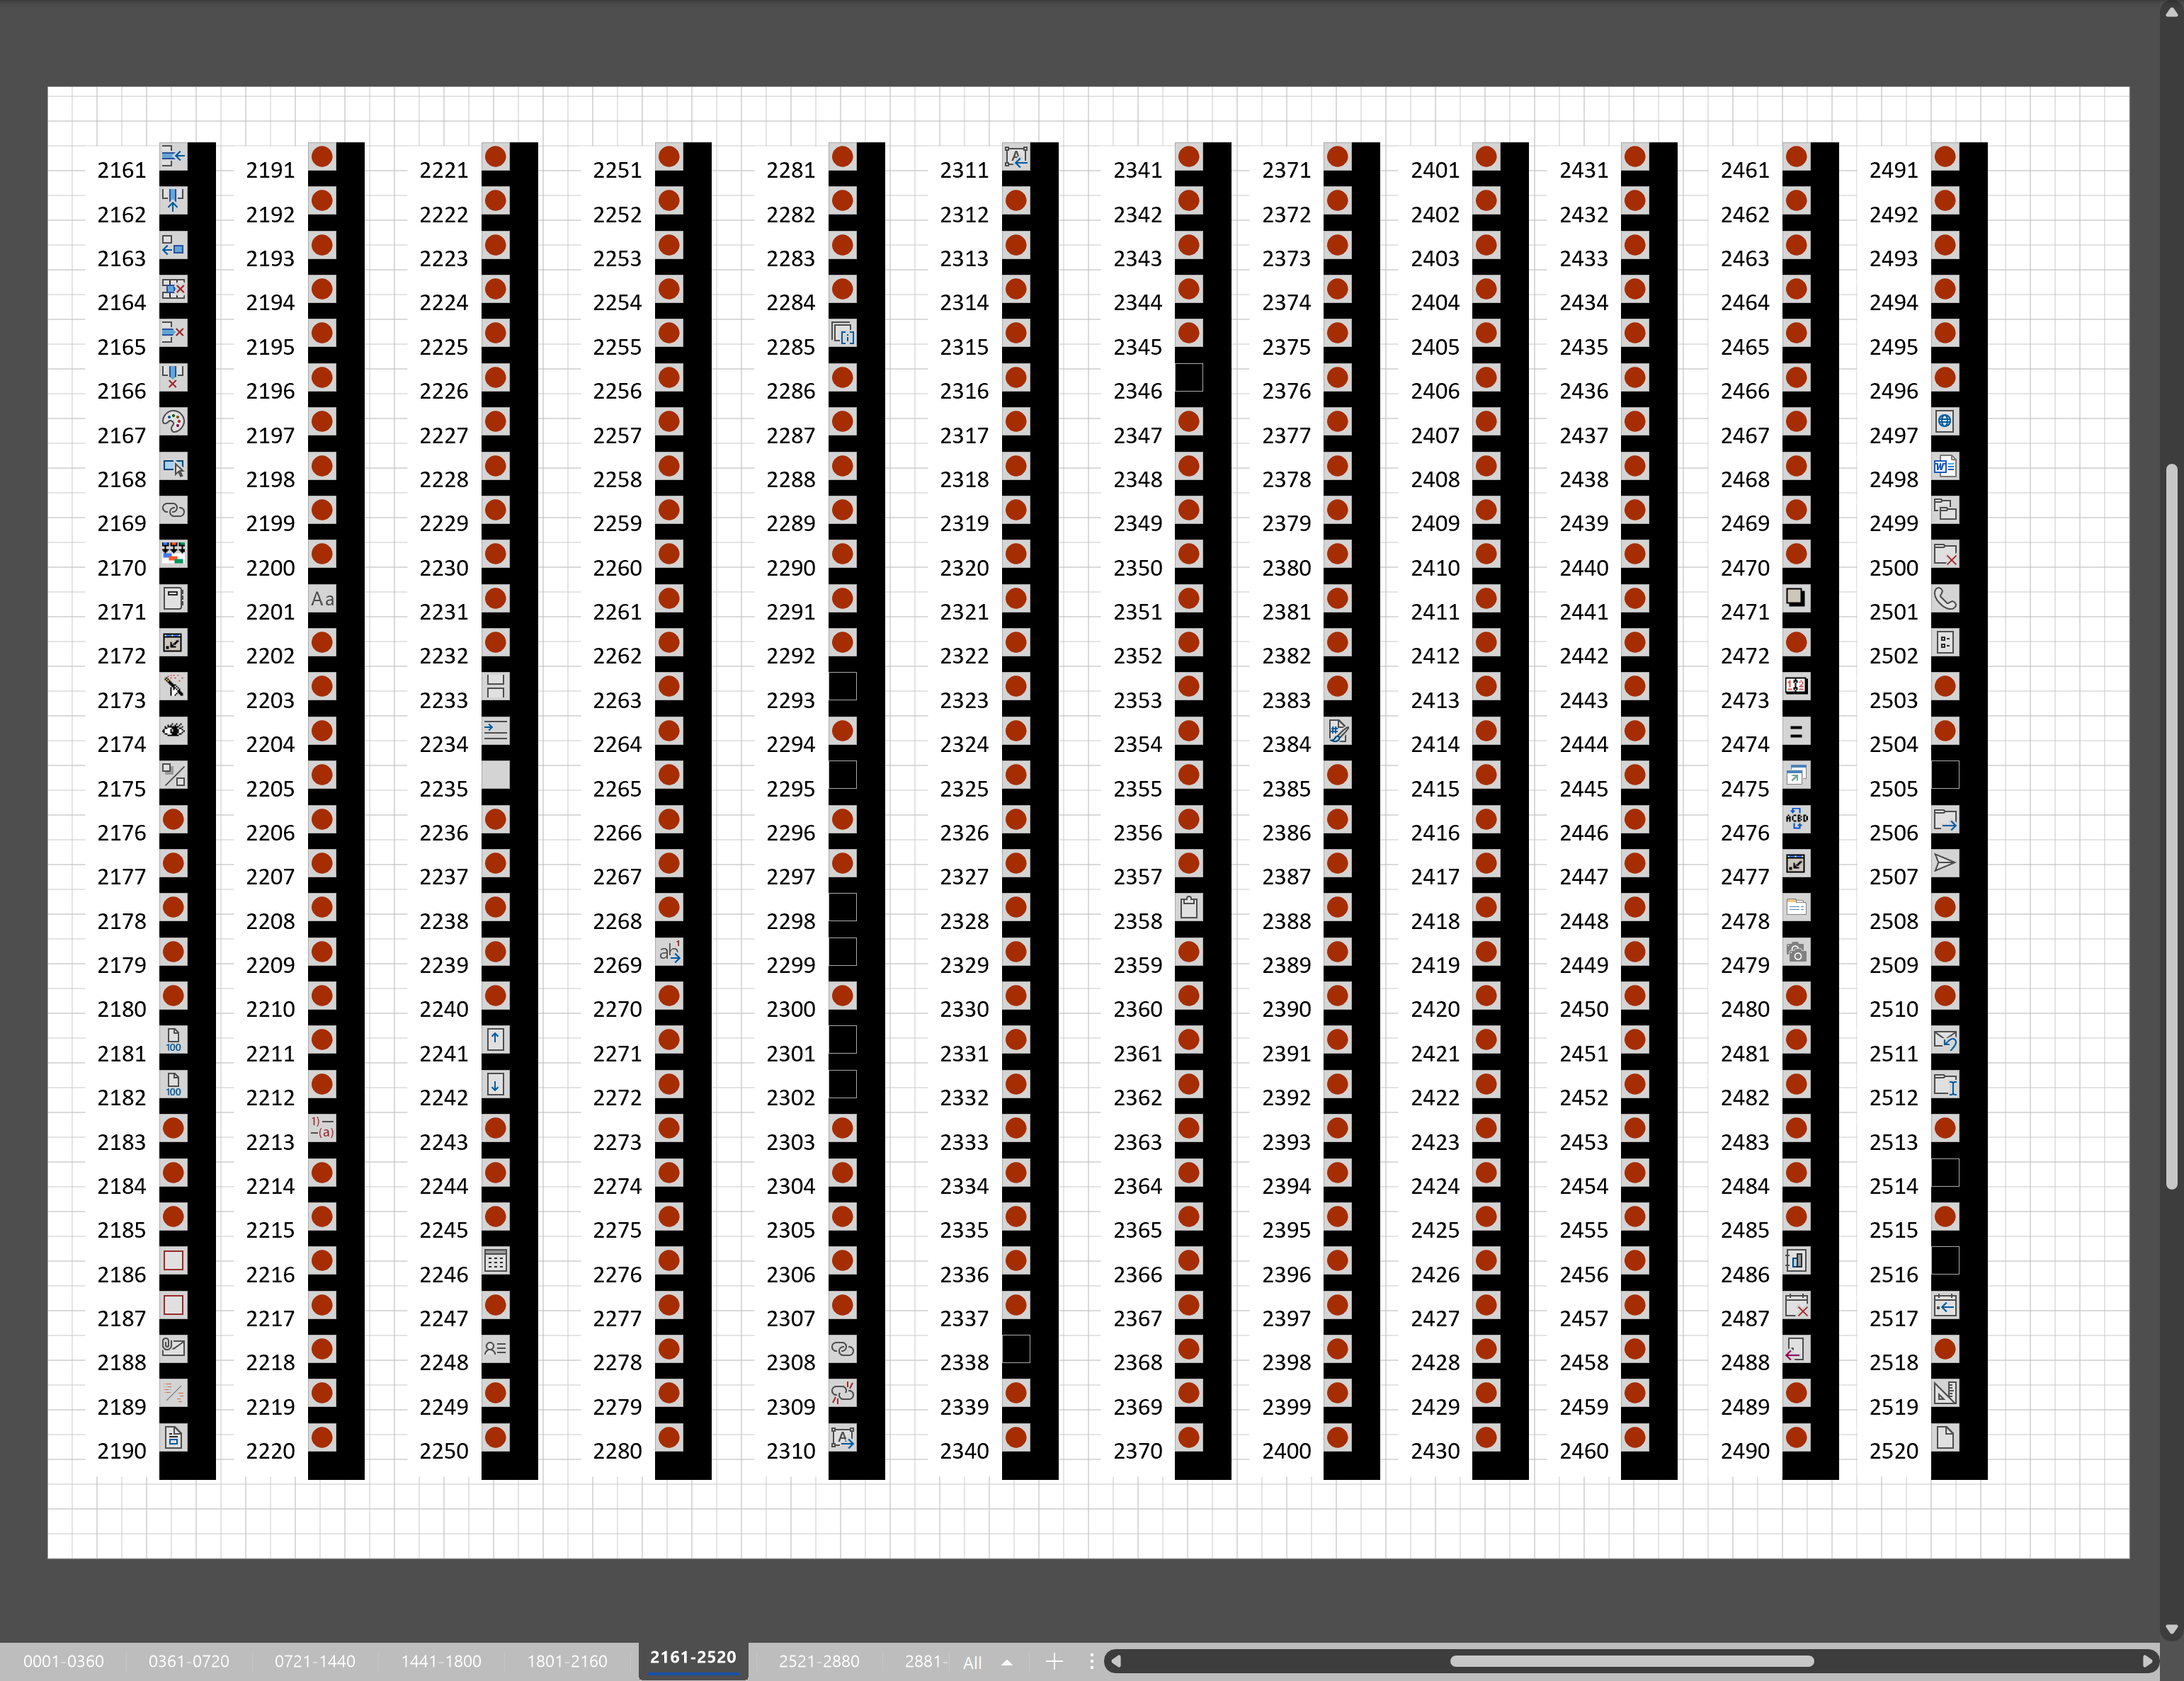
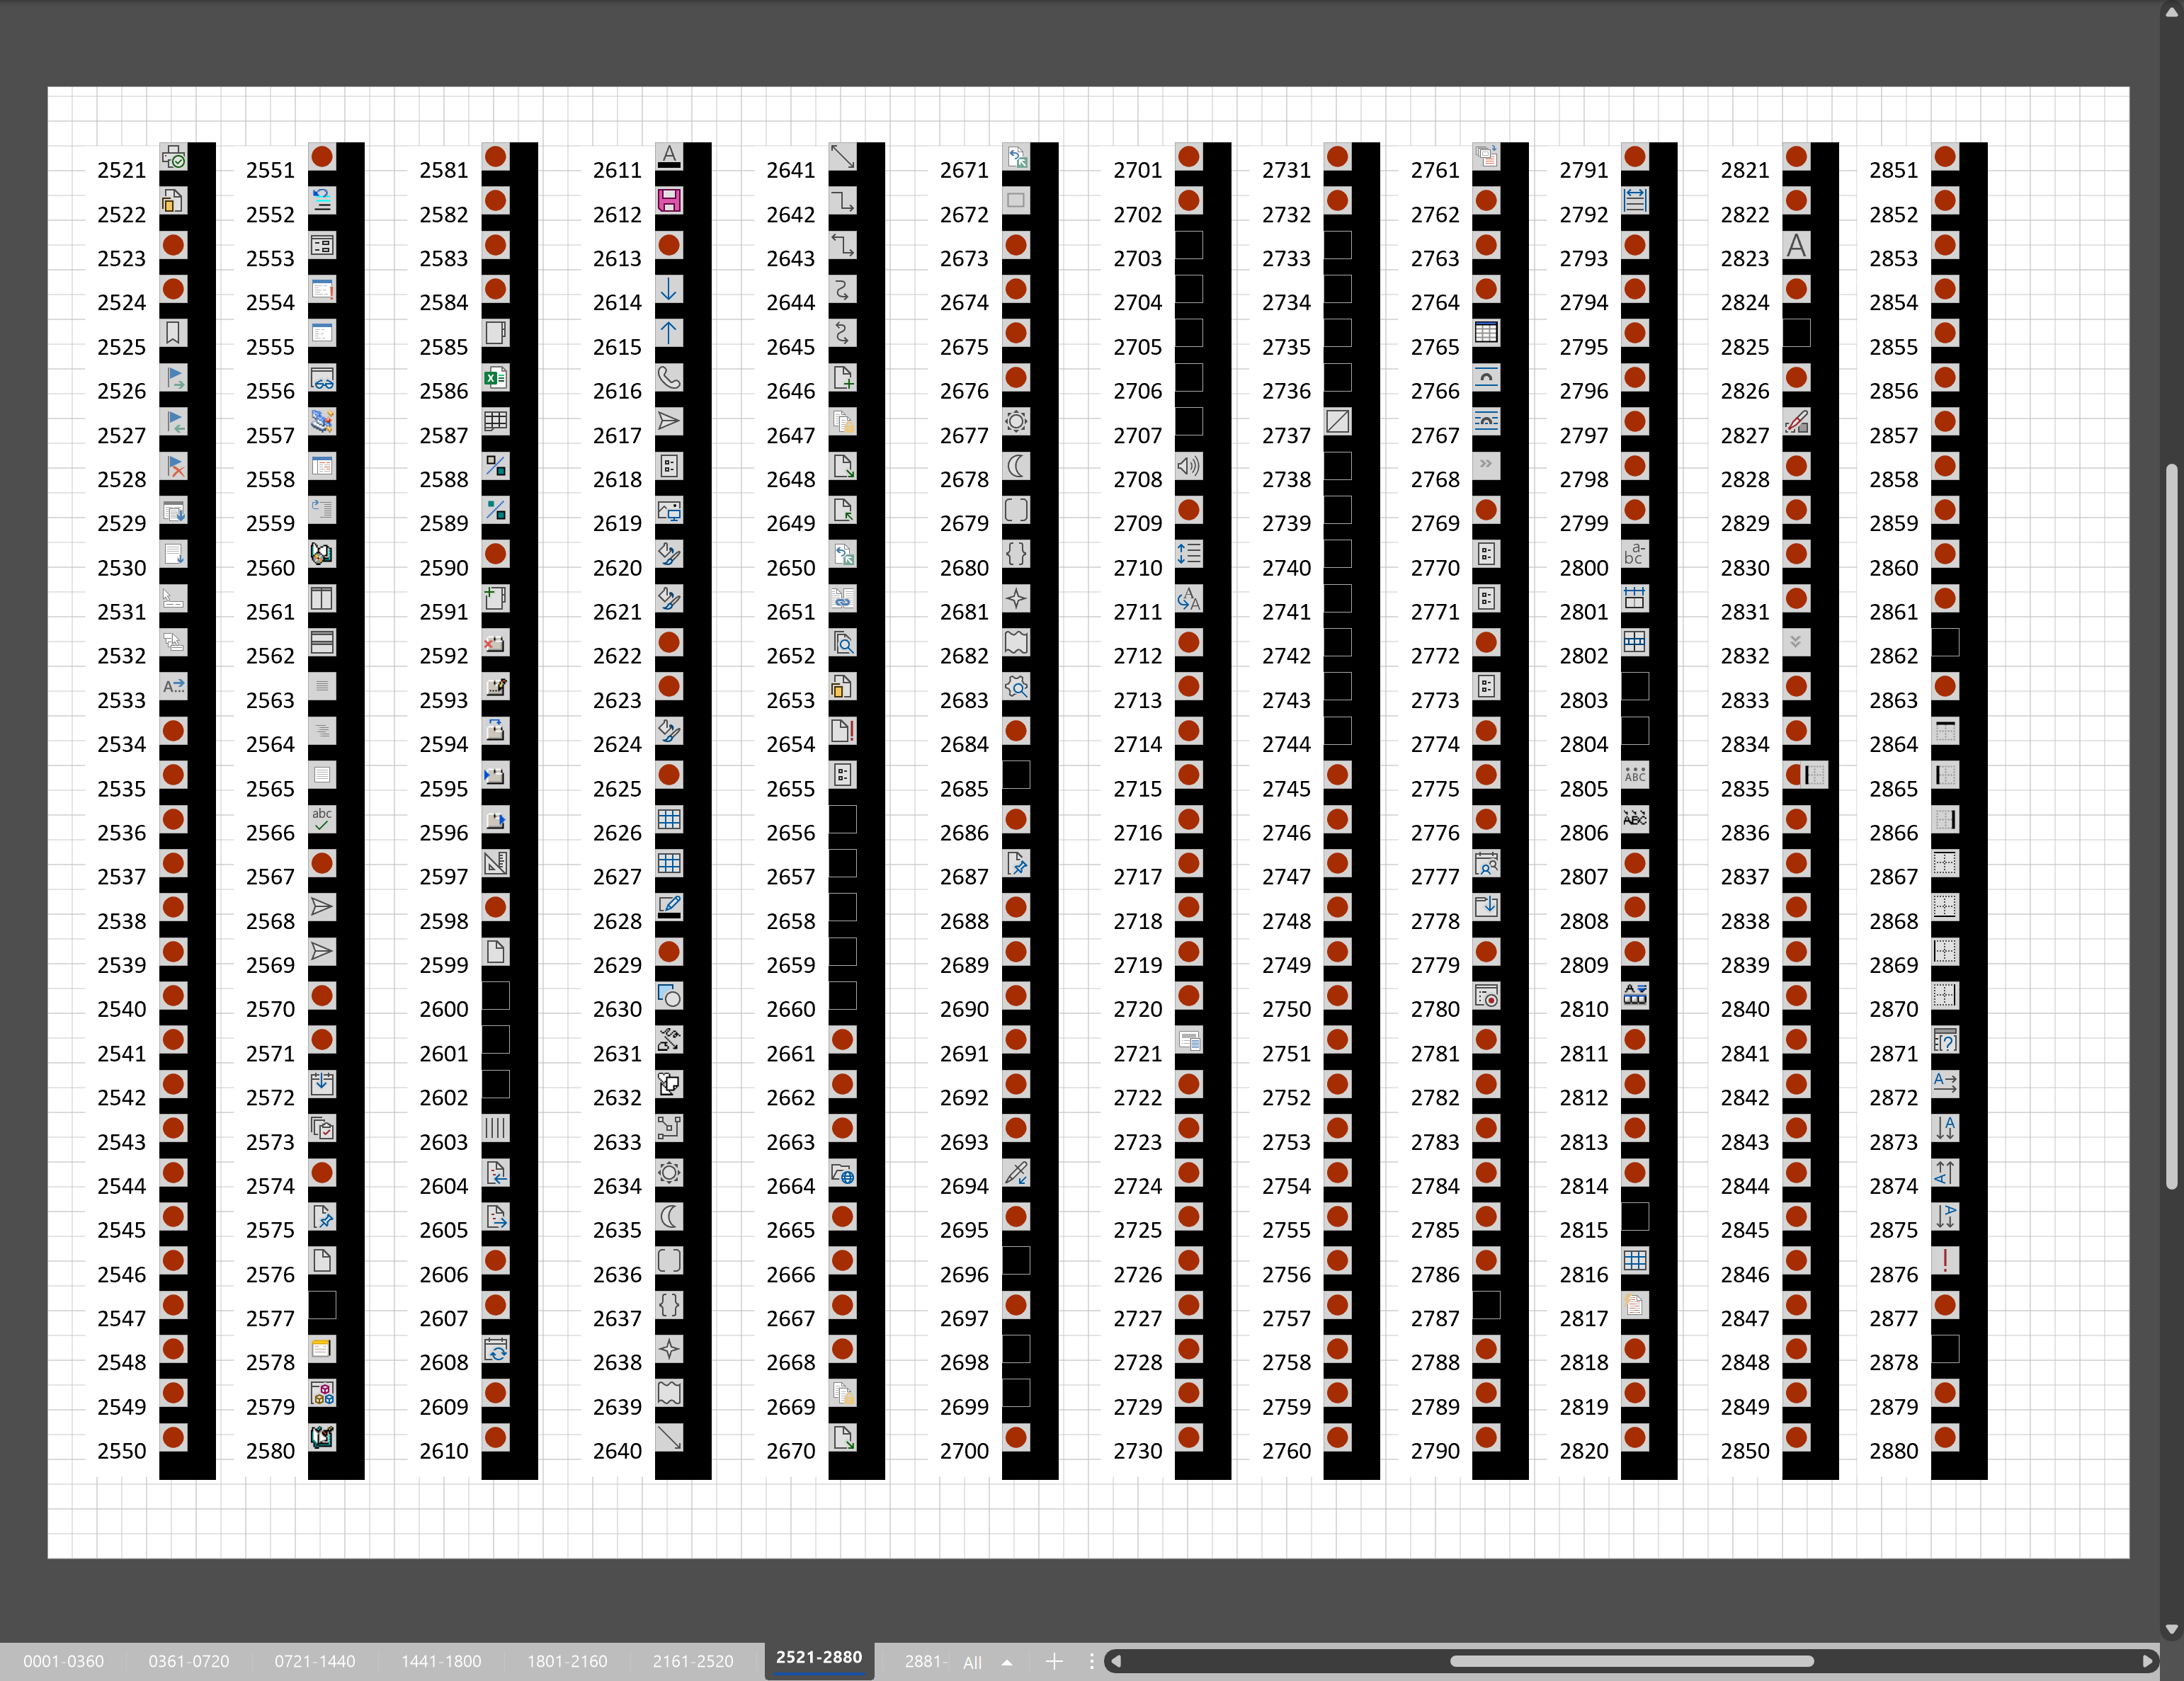
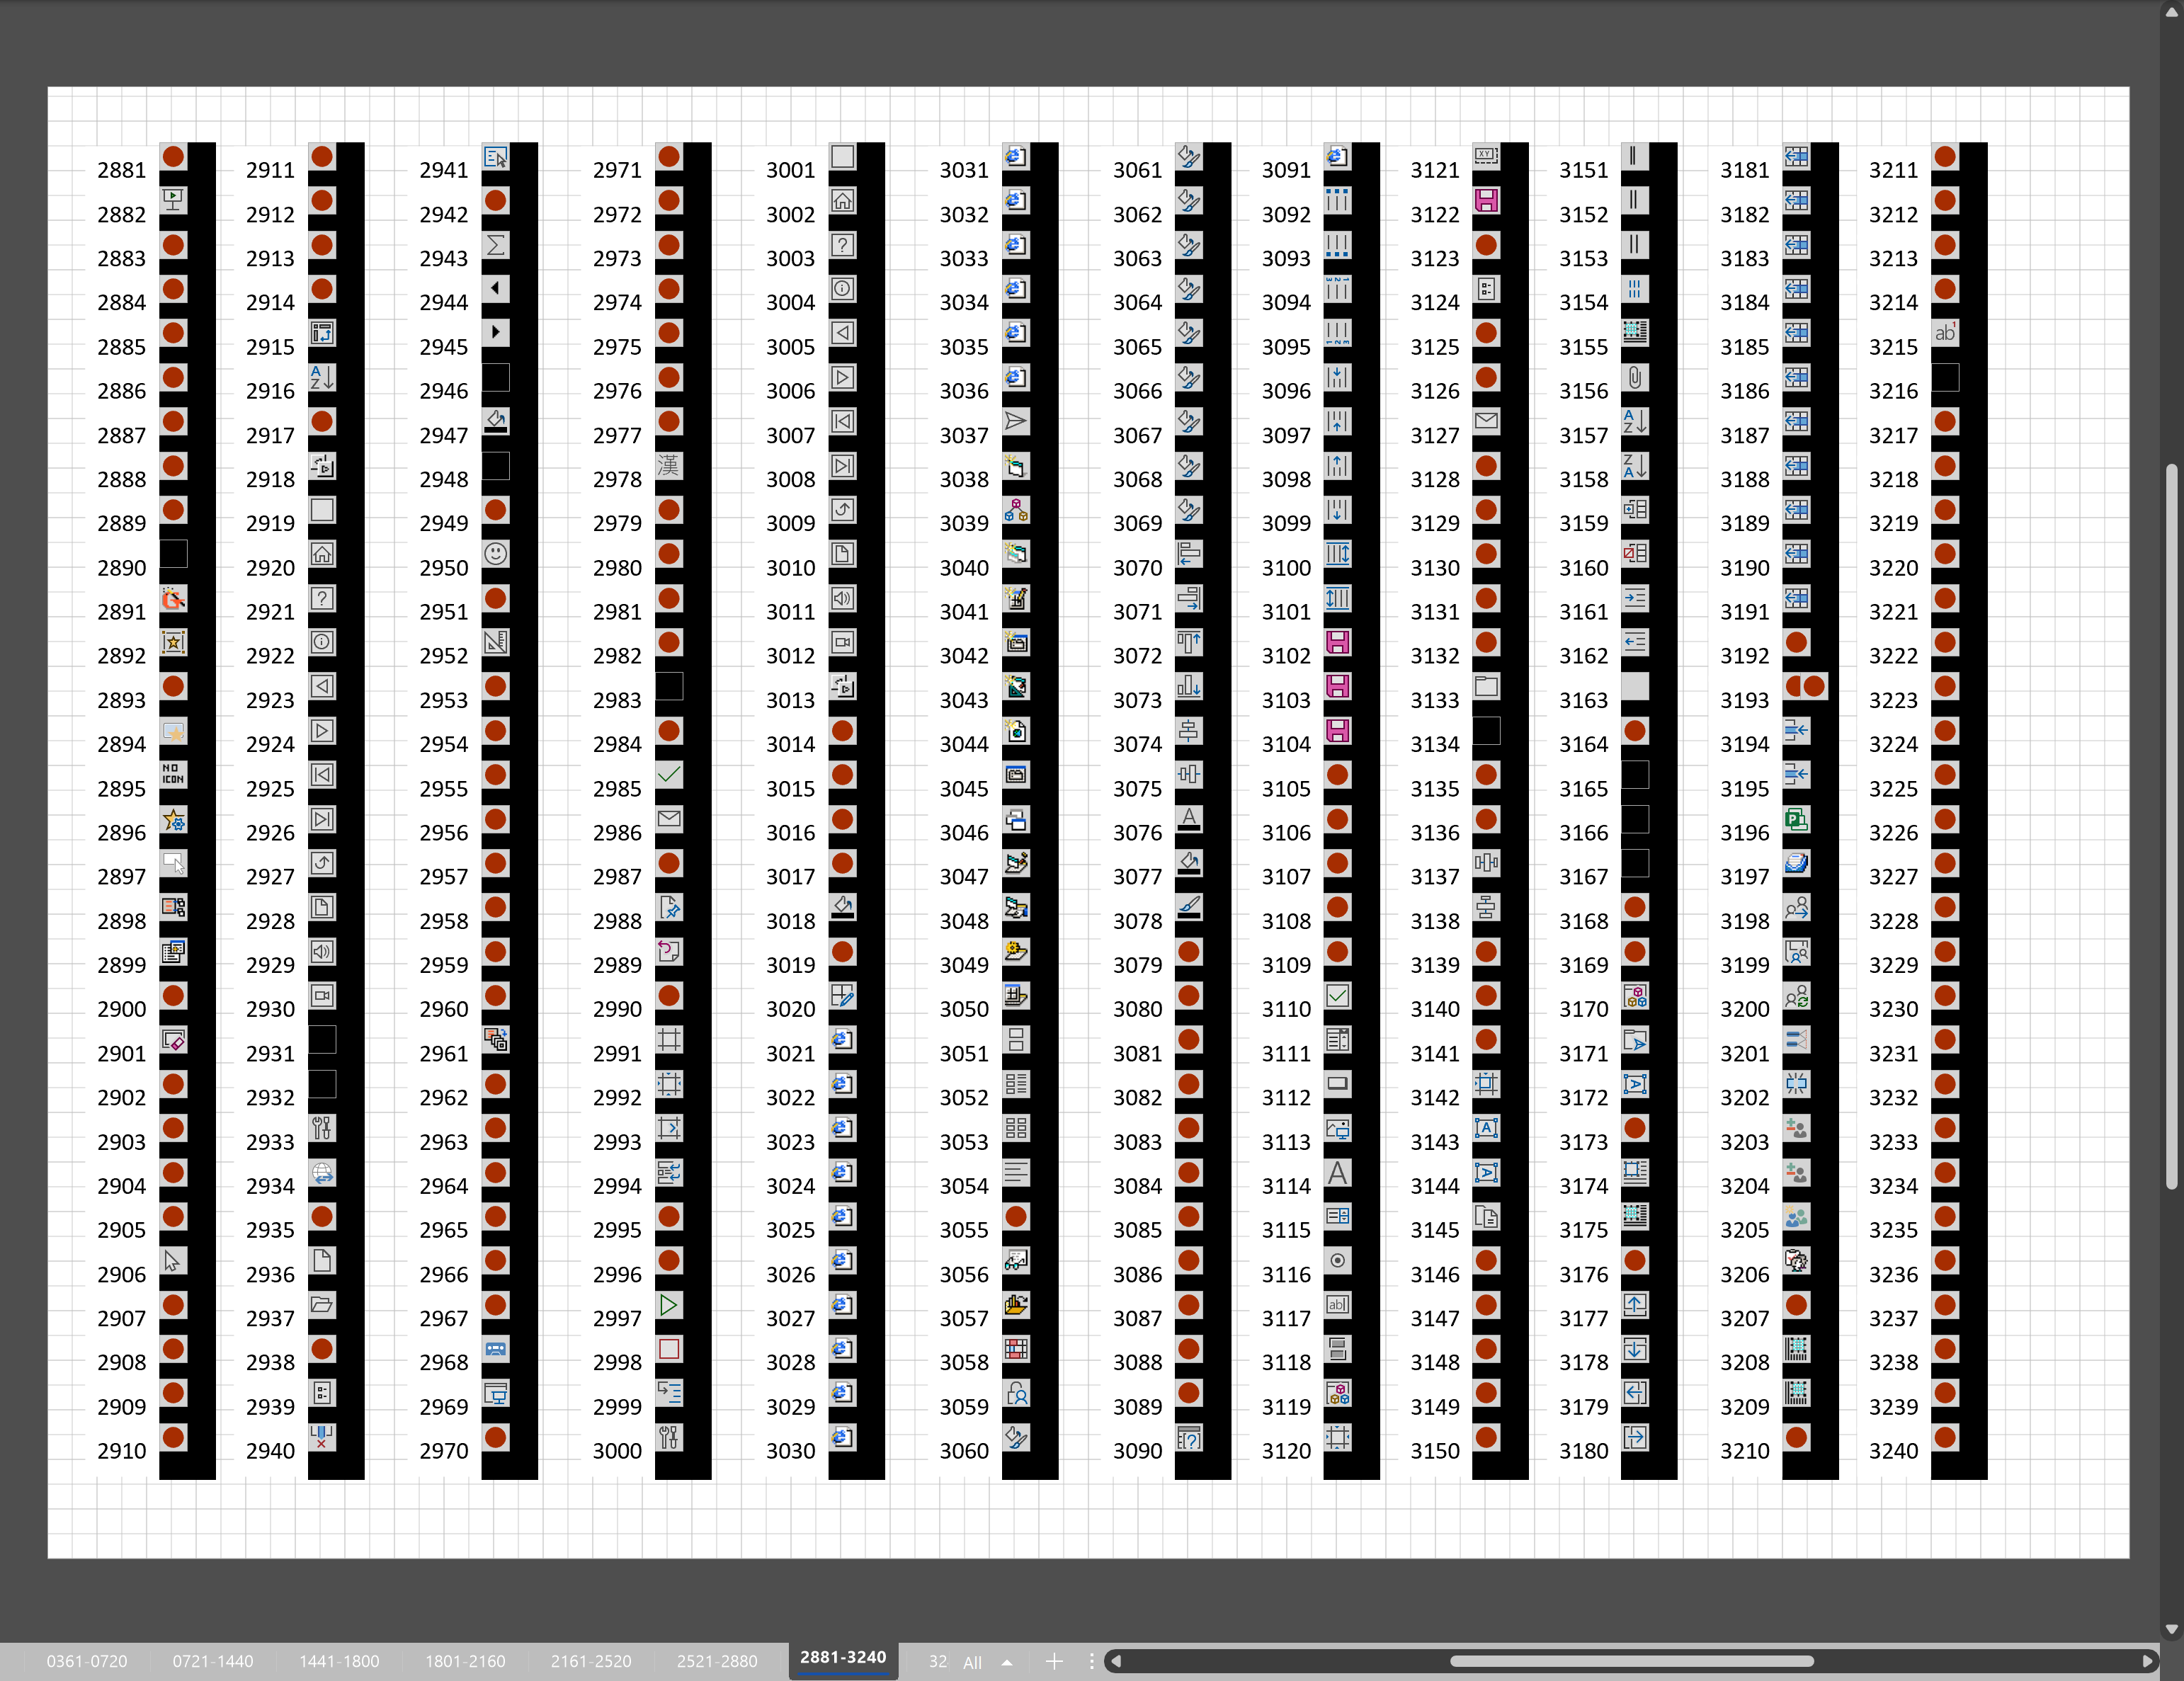
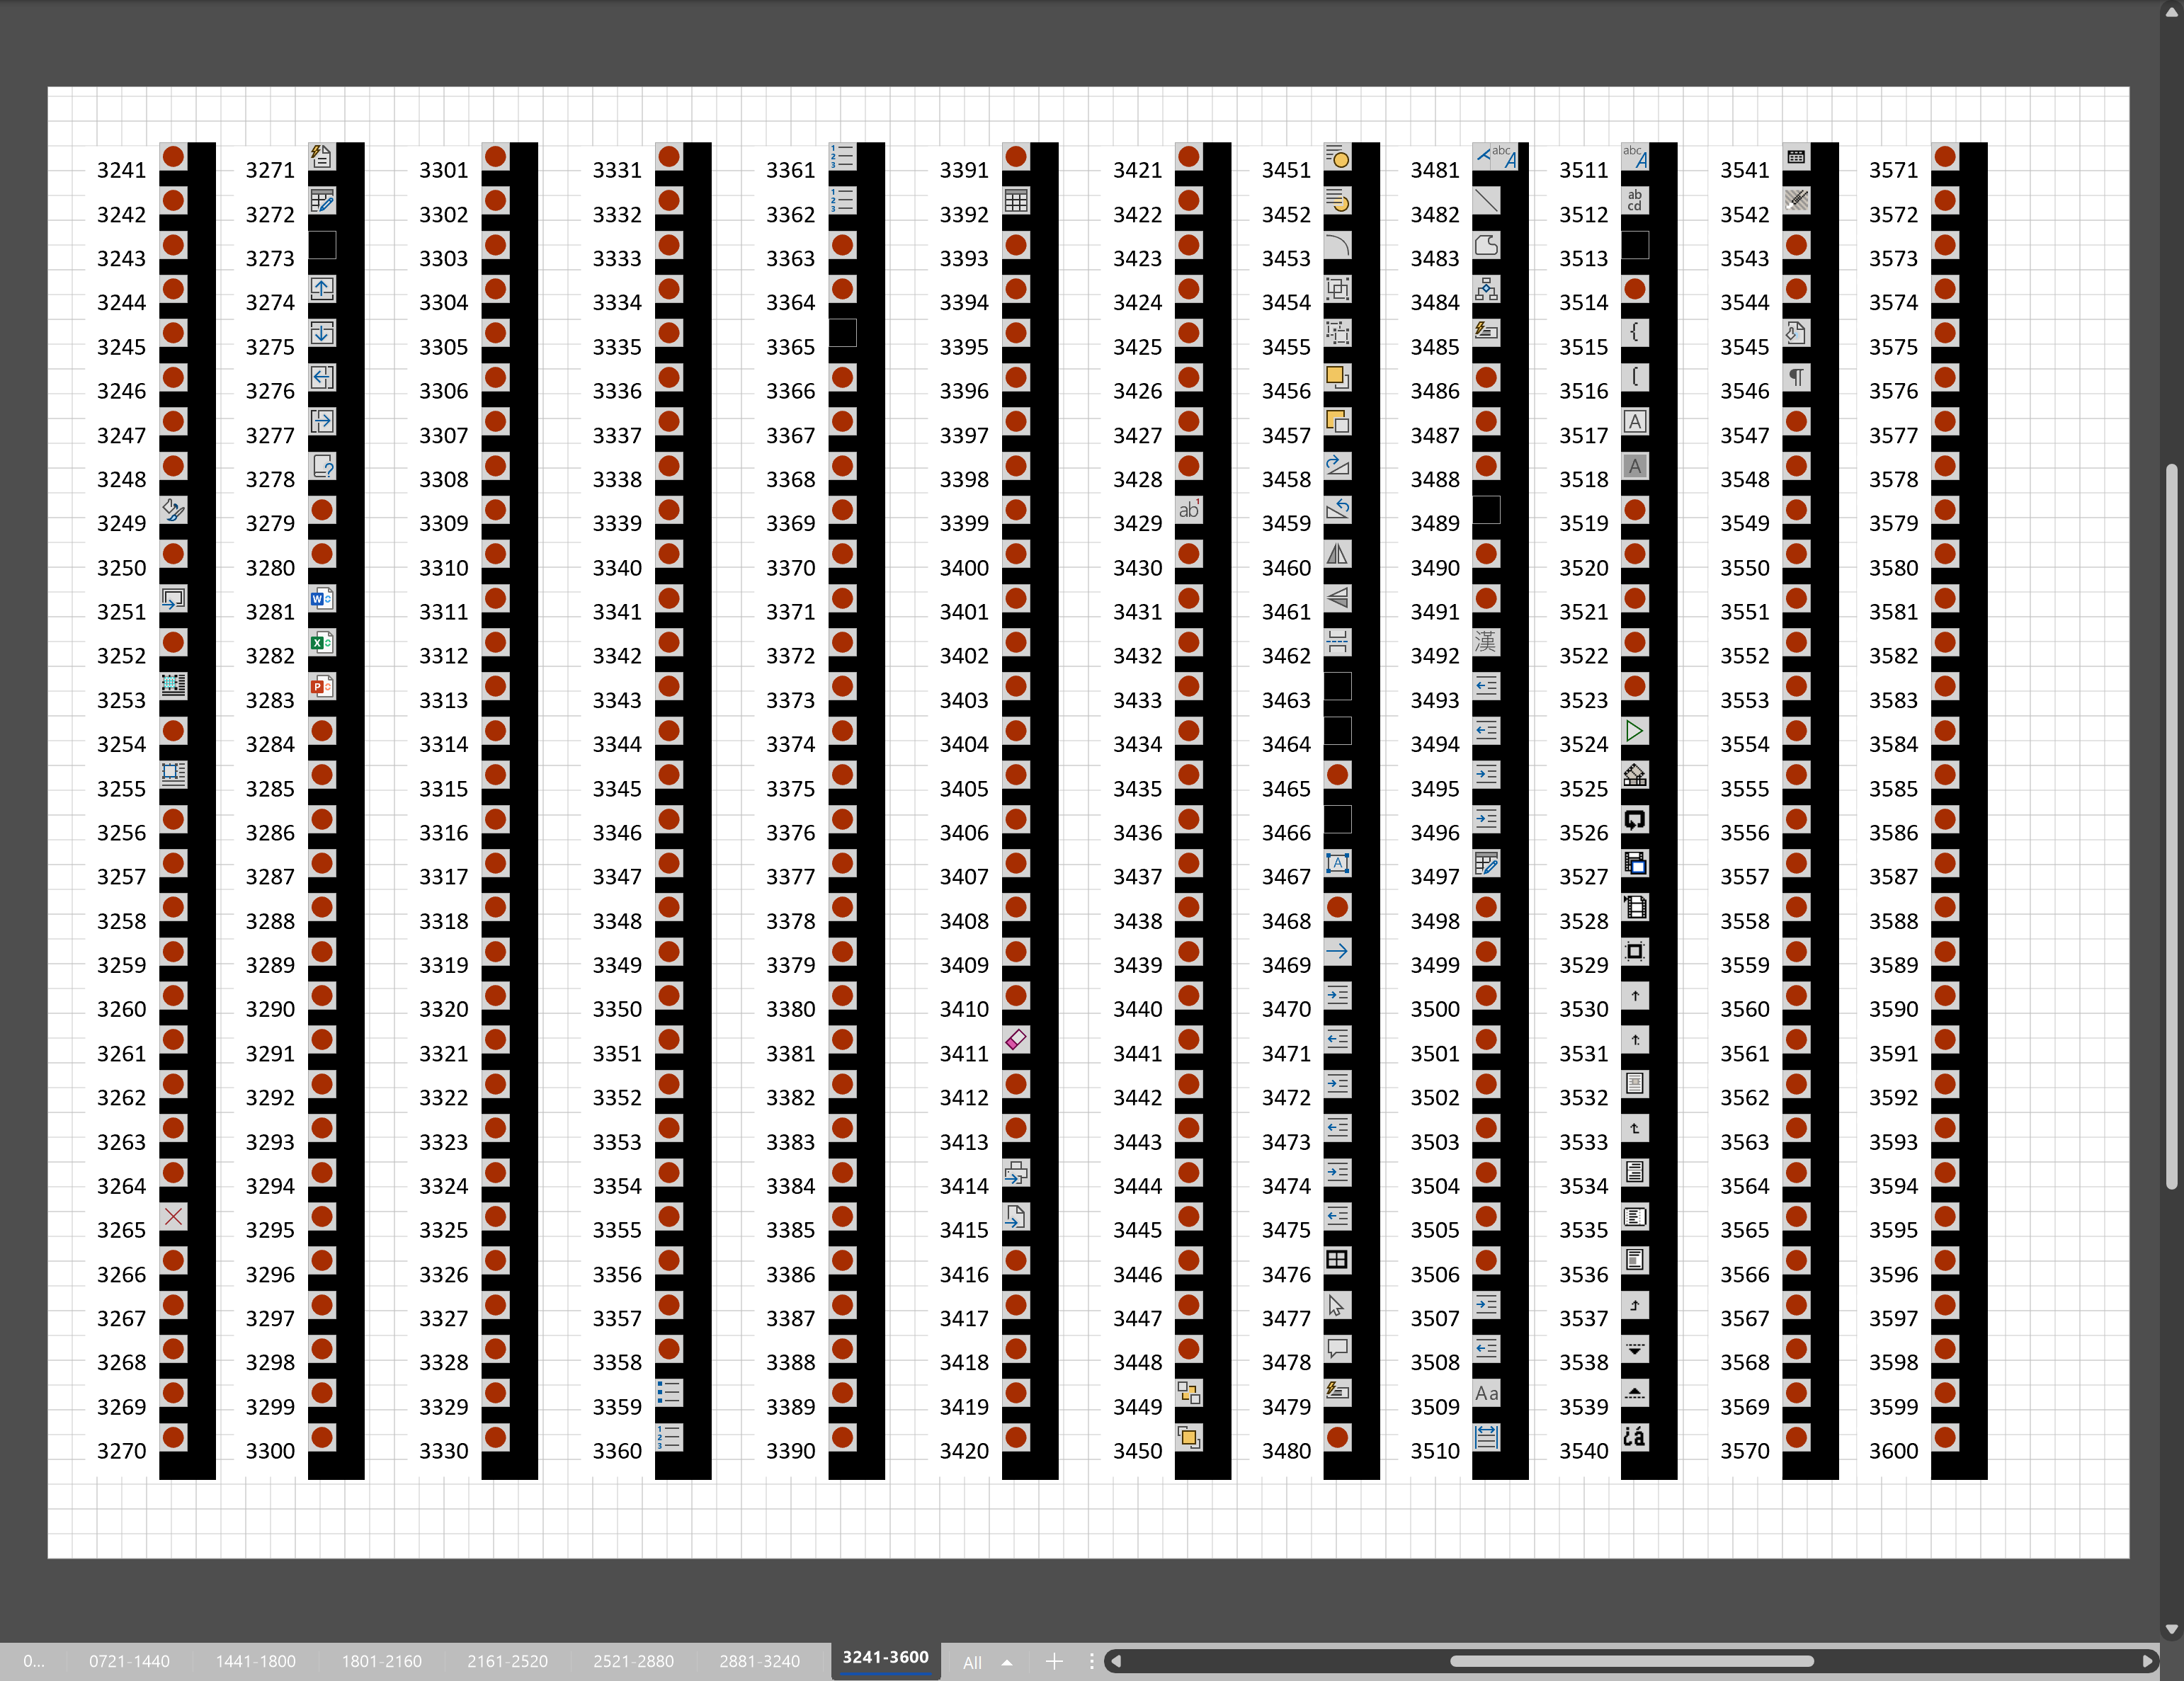
Microsoft Visio desktop has the ability to display icons from a built-in list of Office icons on Actions and Action Tags (nee Smart Tags). These can be set in the ShapeSheet by using the desired number from several thousand in the ButtonFace cell. Although there is the ability to add better icons using code, the quick ShapeSheet formulas are useful way of indicating the purpose of a command. This article simply lists the first 3,600 of these fas a quick and easy reference for me, and othe ShapeSheet disigners out there!
[Read more…] about Using Button Face Ids in VisioUncategorized
Pushing Data Visualizer in Visio beyond its limits
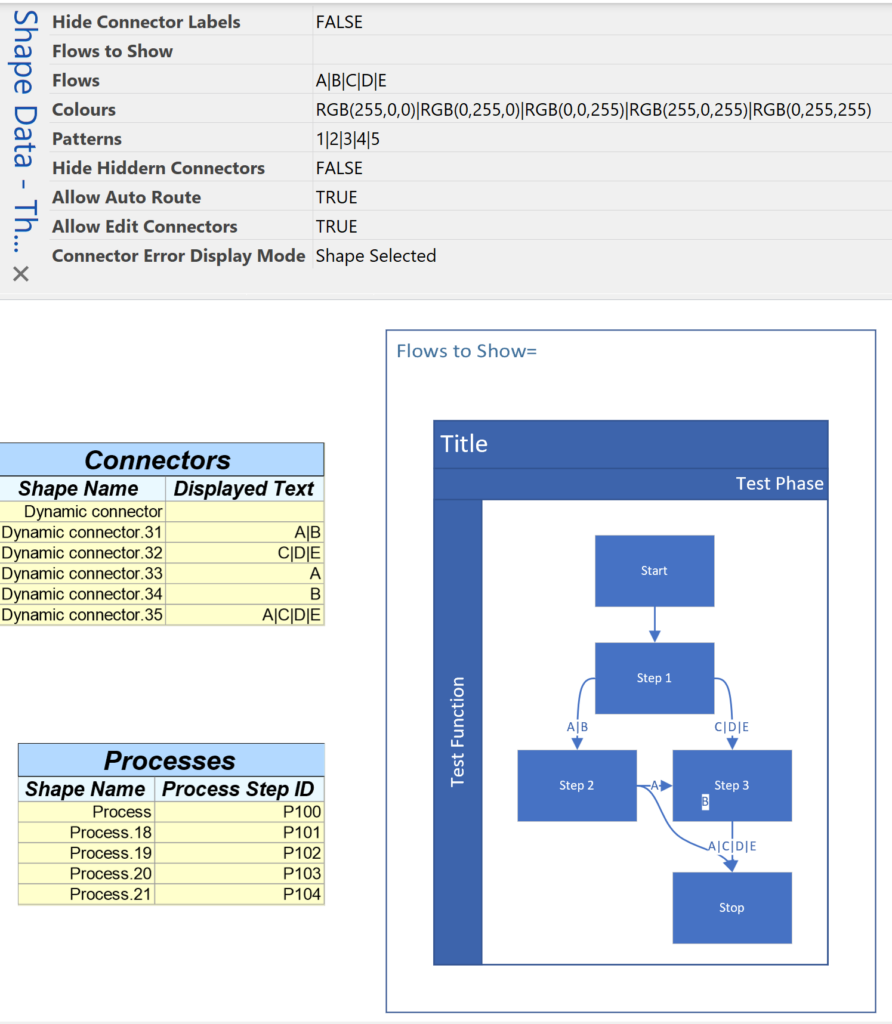
My last post was about some of the lessons learnt when trying to push Data Visualizer to its limits, but this one has some ways of overcoming these limitations. The main lesson learnt is that DV binds the shapes within the DV container shape, CFF Data Visualizer, and controls some of the ShapeSheet cells that are normally available for customization. The label of the connector is bound to the respective column in the Excel table, and that, combined with the ability to modify the Dynamic connector master shape provides a way of overcoming some of the limitations discovered.
So, given that we want to use DV, and we need to have multiple flows between the same shapes, then they cannot be separate connectors. We need to combine multiple flows onto the same connector, and then find a way to selectively display different flows somehow by controlling the visibility of the connectors. However, we cannot make them invisible because they will be deleted by DV, so we need to control their transparency instead. We can do this by interpreting the label somehow, and we are going to modify the Dynamic connector to react to the text of the label, and we can also change the colour and line pattern too.
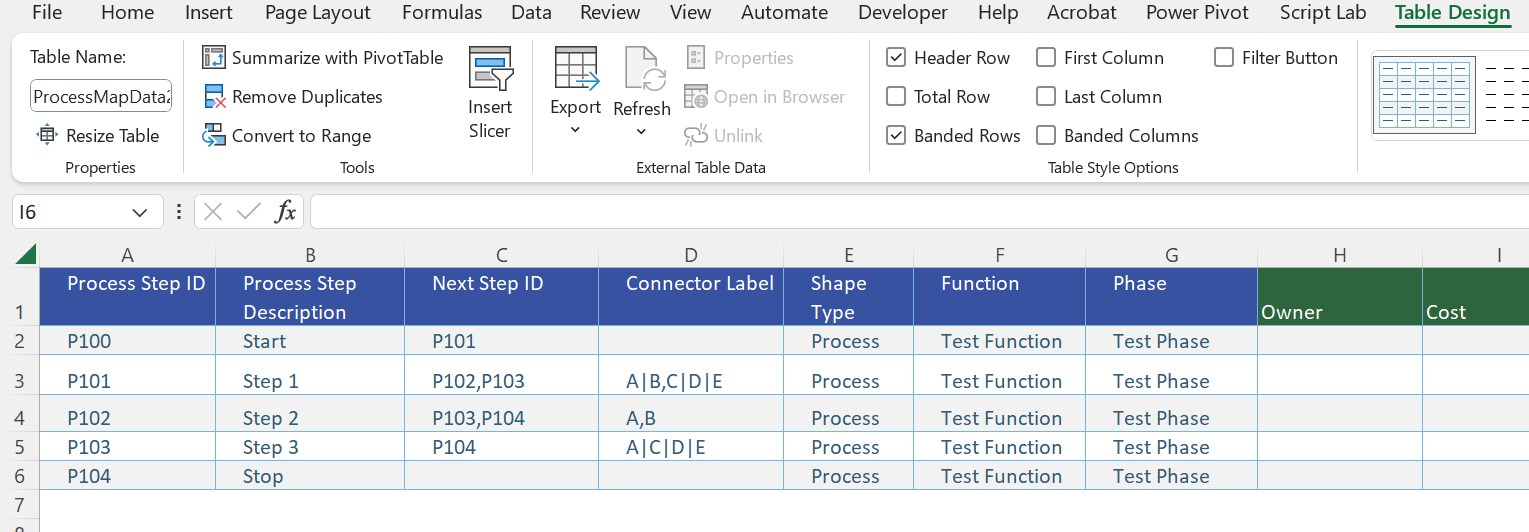
The following screenshots show the Excel table with the multiple flows between the same shapes concatenated with pipe characters, and the diagram created by Data Visualizer when this table is imported into a custom template using Data \ Create from Data \ Create:
[Read more…] about Pushing Data Visualizer in Visio beyond its limitsA Visio List Shape is also a Container
Structured diagrams have been around in Microsoft Visio since 2010 and I have always known that list shapes are a specialized container shape, however it still came as a surprise to me recently that a list shape can simultaneously act as a container shape!
There are a few examples of both container and list shapes in the Microsoft provided content in all versions of Visio desktop, and even in the subscription Visio for web. The most popular of these is the Cross-Functional Flowchart template which contains container shapes (the Swimlane and Separator shapes) within list shapes (Swimlane List and Phase List), which are within another container shape (CFF Container).
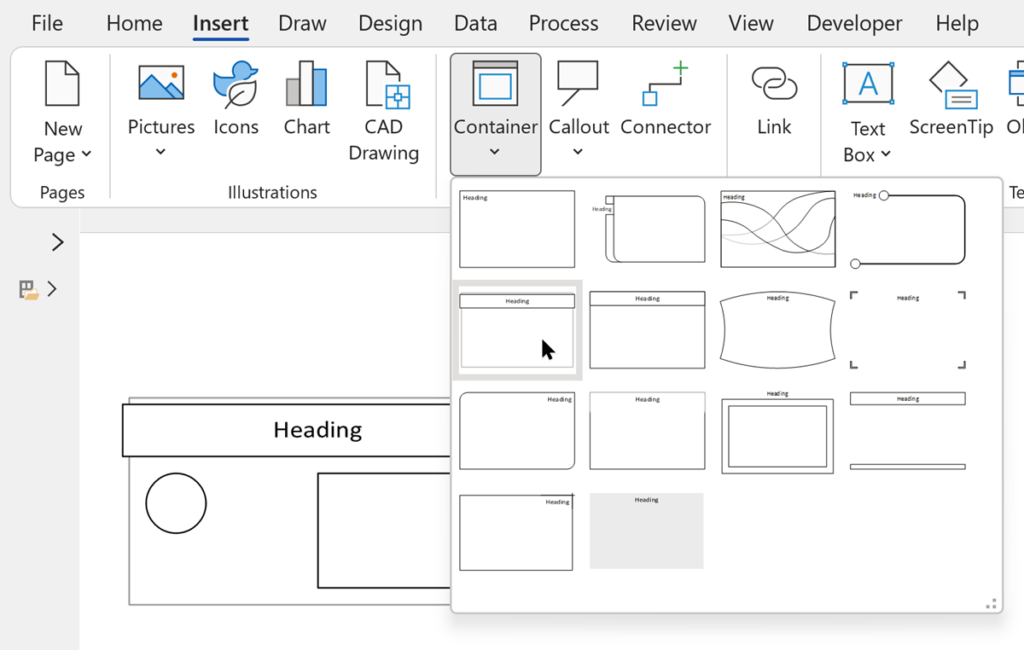
In Visio desktop, the Insert / Diagram Parts / Container allows you to choose from a number of pre-built container shapes. There is no button to insert a list shape, but you can create your own or easily modify one of the pre-built ones to behave as a list shape.
Spotting Custom UI Errors in Visio Add-ins
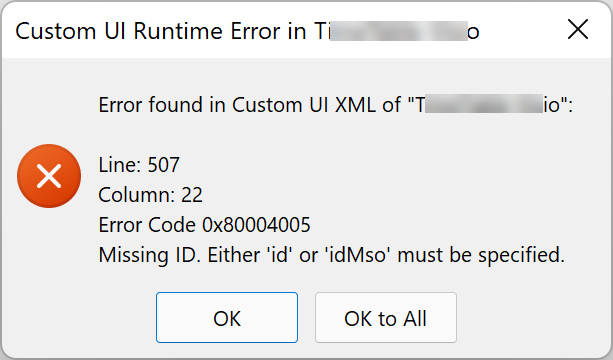
I have written many COM and VSTO add-ins for Visio, but got confused when a client recently reported that the following Custom UI Runtime Error was appearing. I wasn’t getting the same error on any of my test laptops, so I chatted with my good friend, and fellow Visio MVP, John Goldsmith ( John Goldsmith’s visLog (typepad.co.uk) ). He gave me an excellent tip….
Save Time by Using Microsoft Visio ShapeSheets and other webinars
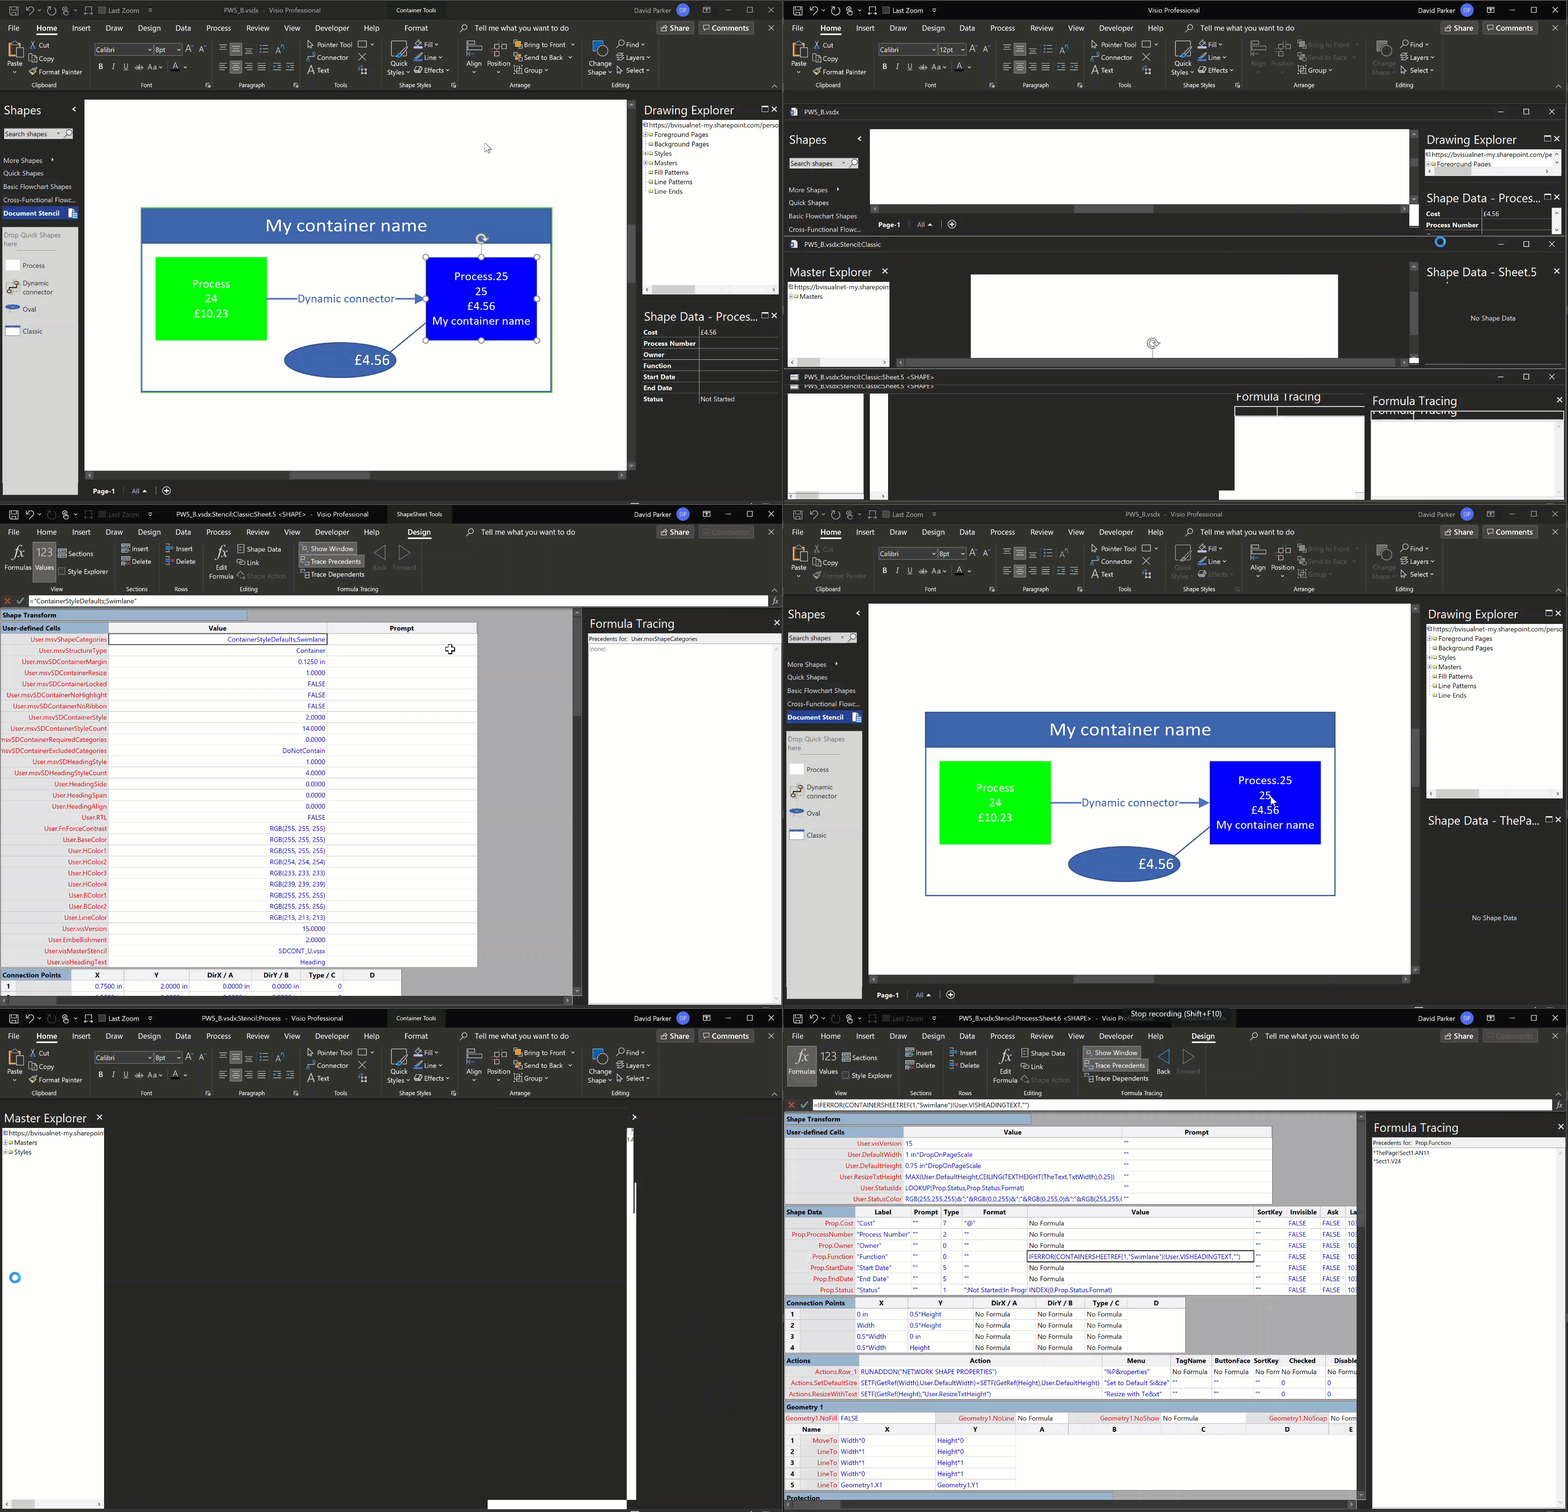
You need new ways to save your organization and yourself time. Did you know that much like an Excel user creates formulas within worksheets to make jobs go faster, Microsoft Visio has built-in efficiencies? For example, Visio has a structure similar to worksheets, where shapes and formulas can be leveraged to provide highly useful functionalities that save time.
This webinar is a gentle introduction to Visio ShapeSheets and the extra smartness they provide that will improve efficiency and save you time.
Register for this live webinar on 2nd June 2021, or watch this and others on demand at https://conferences.presentergroup.com/visioandpowerplatformwebinars
Jumping between Shapes in Visio
Many Visio diagrams get quite large, and sometimes it is useful to provide the ability to jump to another shape quickly in the same document, either on a different page or on the same one. Although there is an add-on provided in desktop Visio that is used by the Off-Page Reference shape provided in the…
Fixing dimensions of 2D shapes
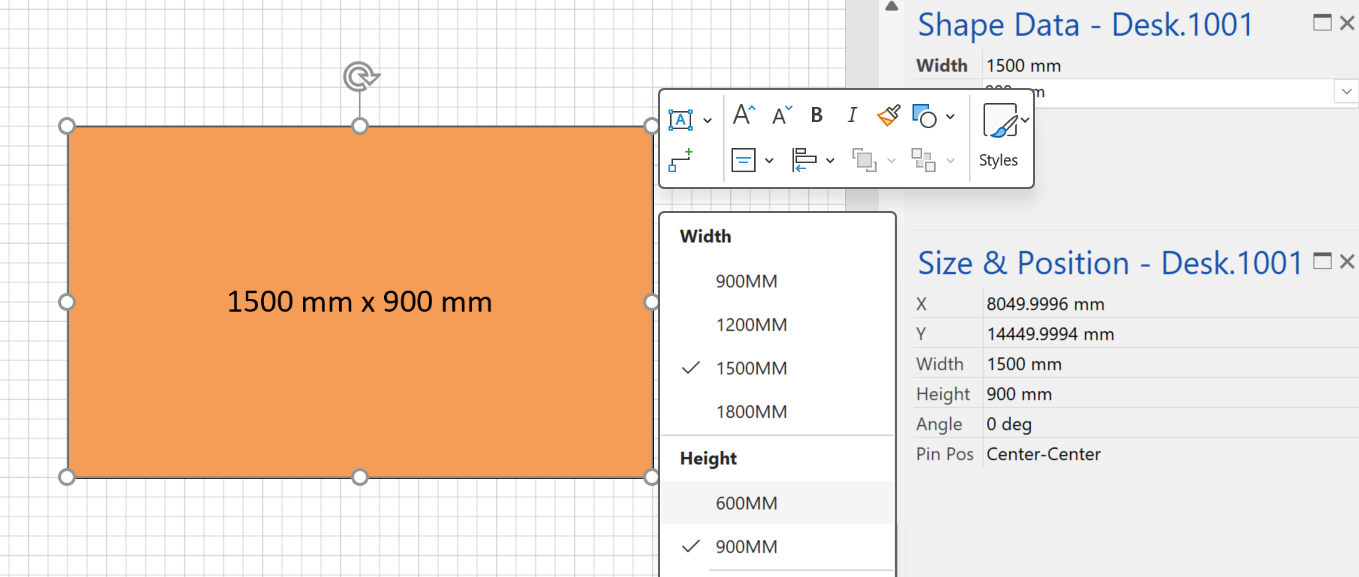
I am often asked what makes Visio unique and makes it stand out from the crowd, especially in today’s online world. Well, I think there are many reasons, but one of them is the ability to create scaled drawings with parametric components of specific dimensions. This was crucial for my adoption of Visio back in…
Smart Radio Buttons and Check Boxes in Visio
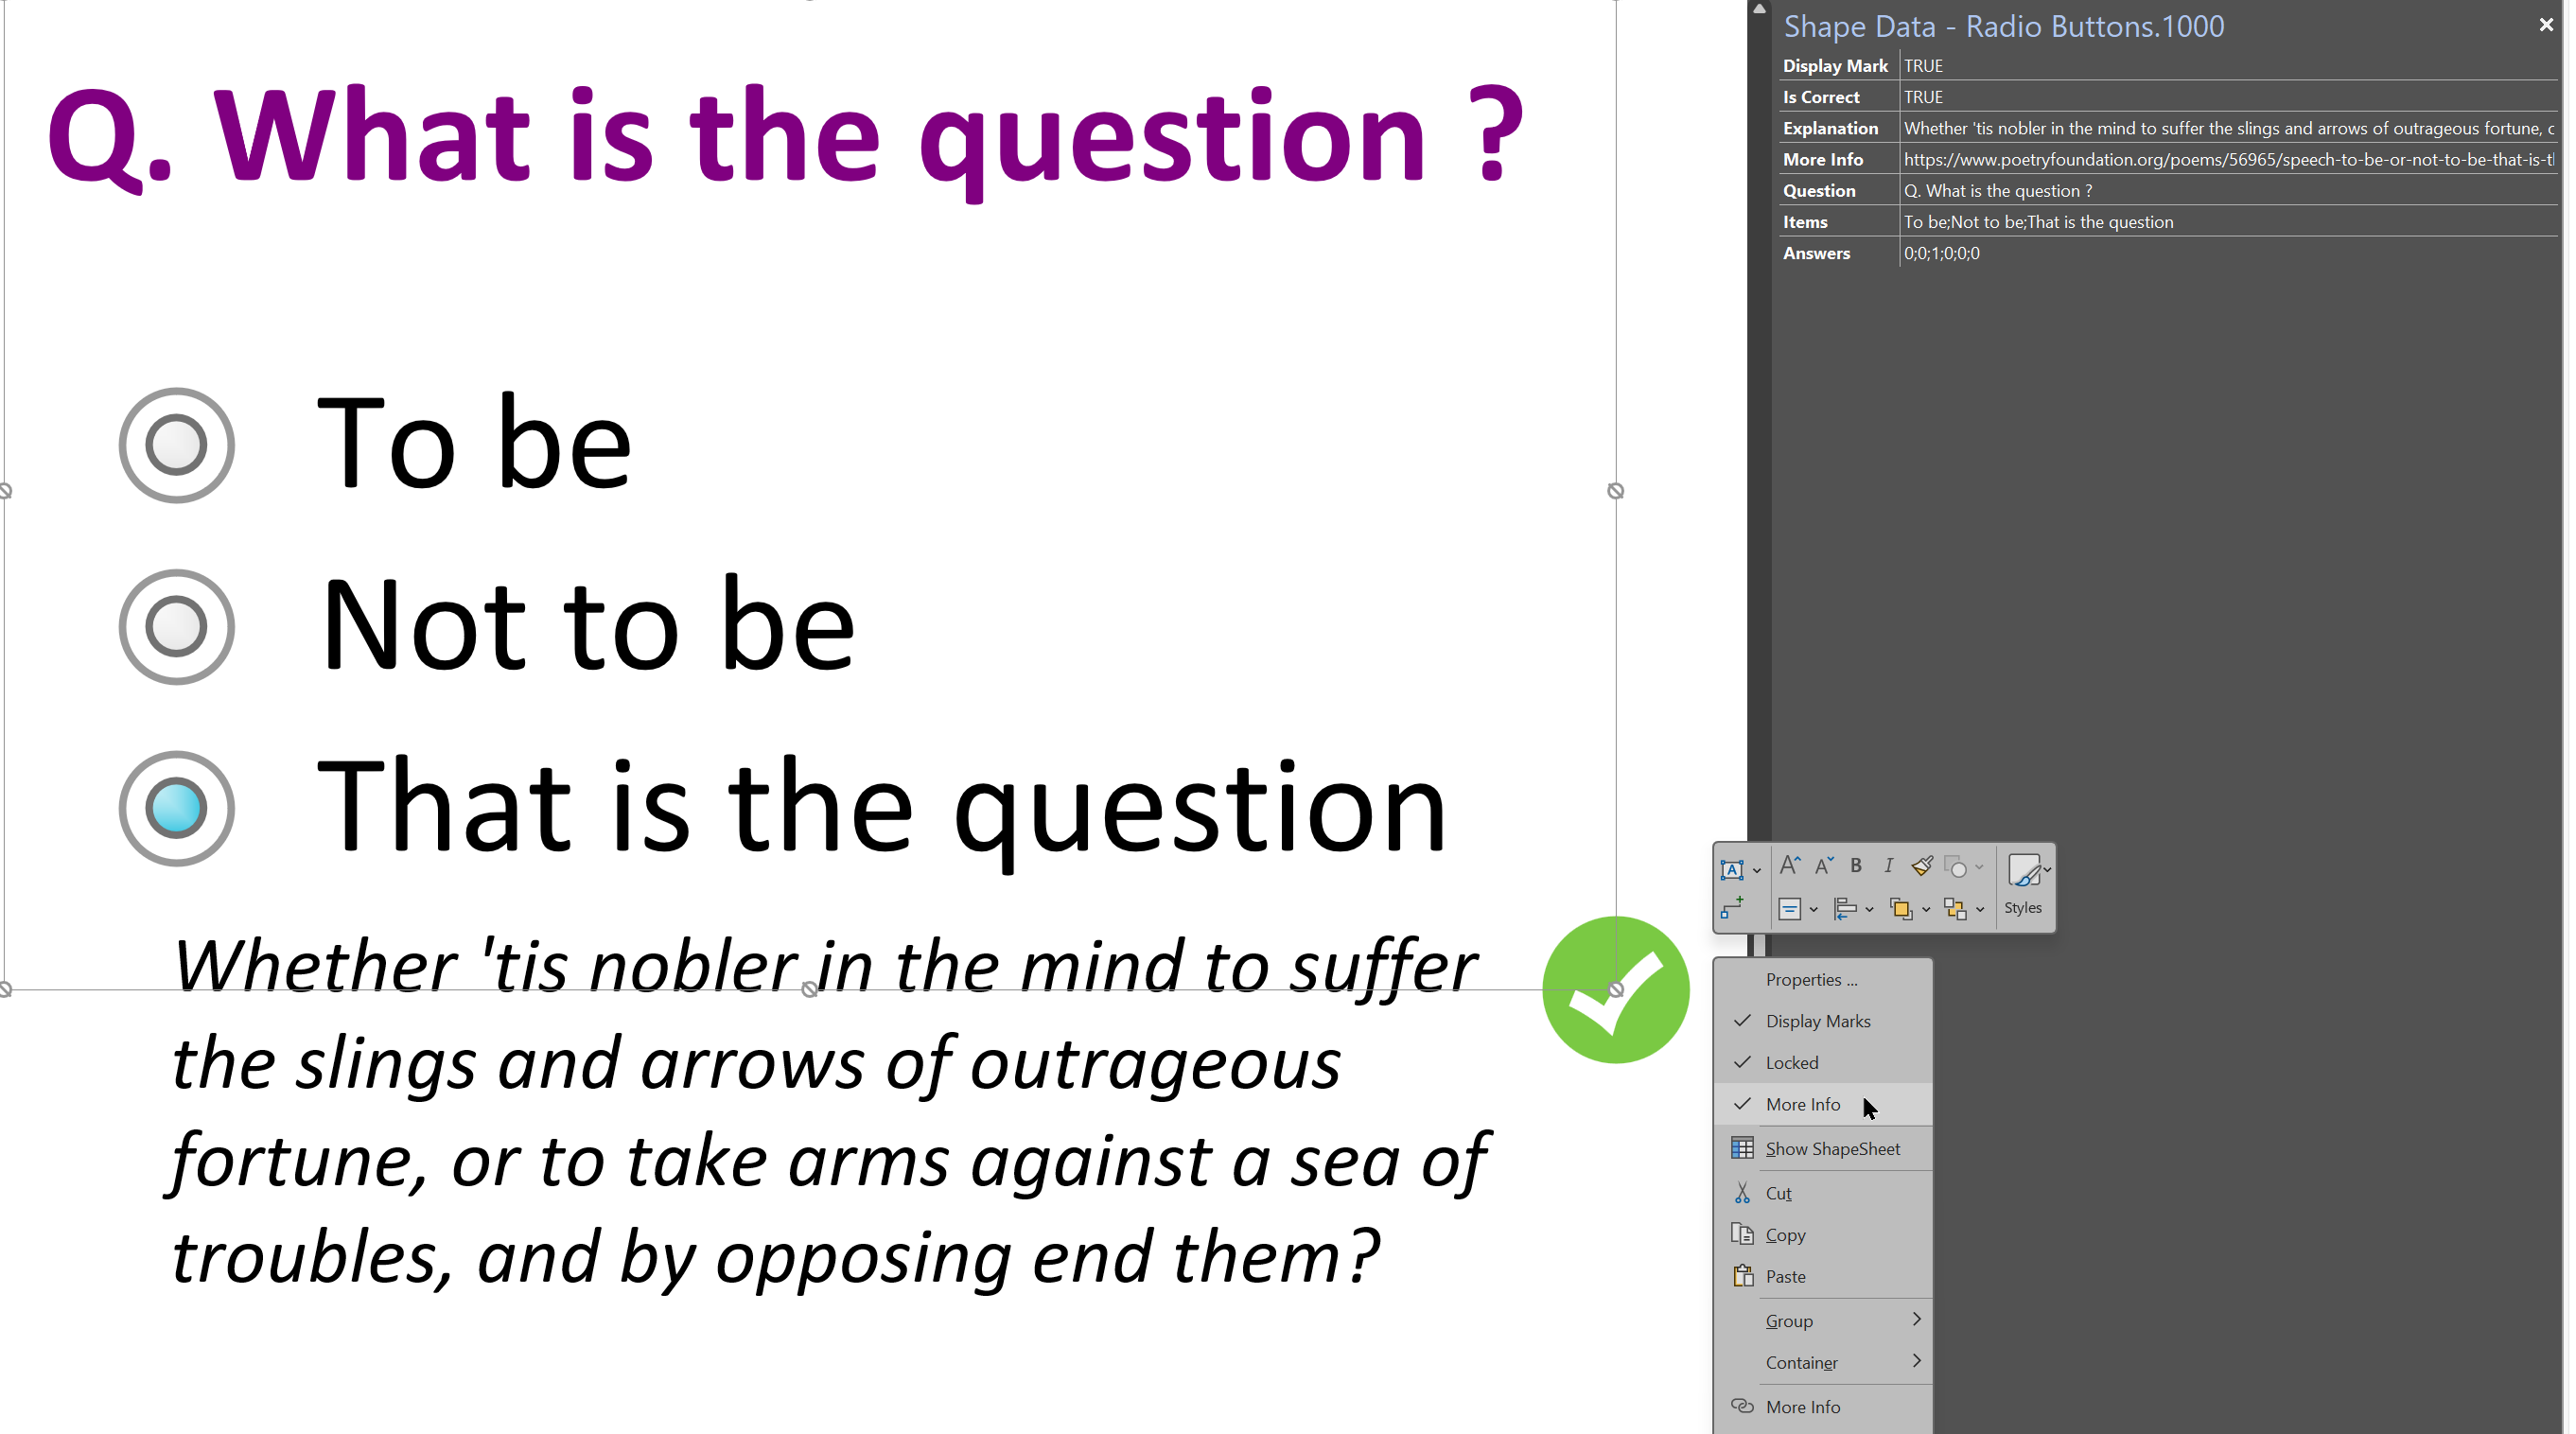
A recent project requires an interactive tutorial within Microsoft Visio desktop where a lot of the questions need a single answer using radio buttons, or multiple-choice answers using check boxes. I thought that this would be a great use of the list containers capability because the questions and answers could be part of the container…
Using Button Face Ids in Visio
Microsoft Visio desktop has the ability to display icons from a built-in list of Office icons on Actions and Action Tags (nee Smart Tags). These can be set in the ShapeSheet by using the desired number from several thousand in the ButtonFace cell. Although there is the ability to add better icons using code, the…
Grid Snapping Revisited
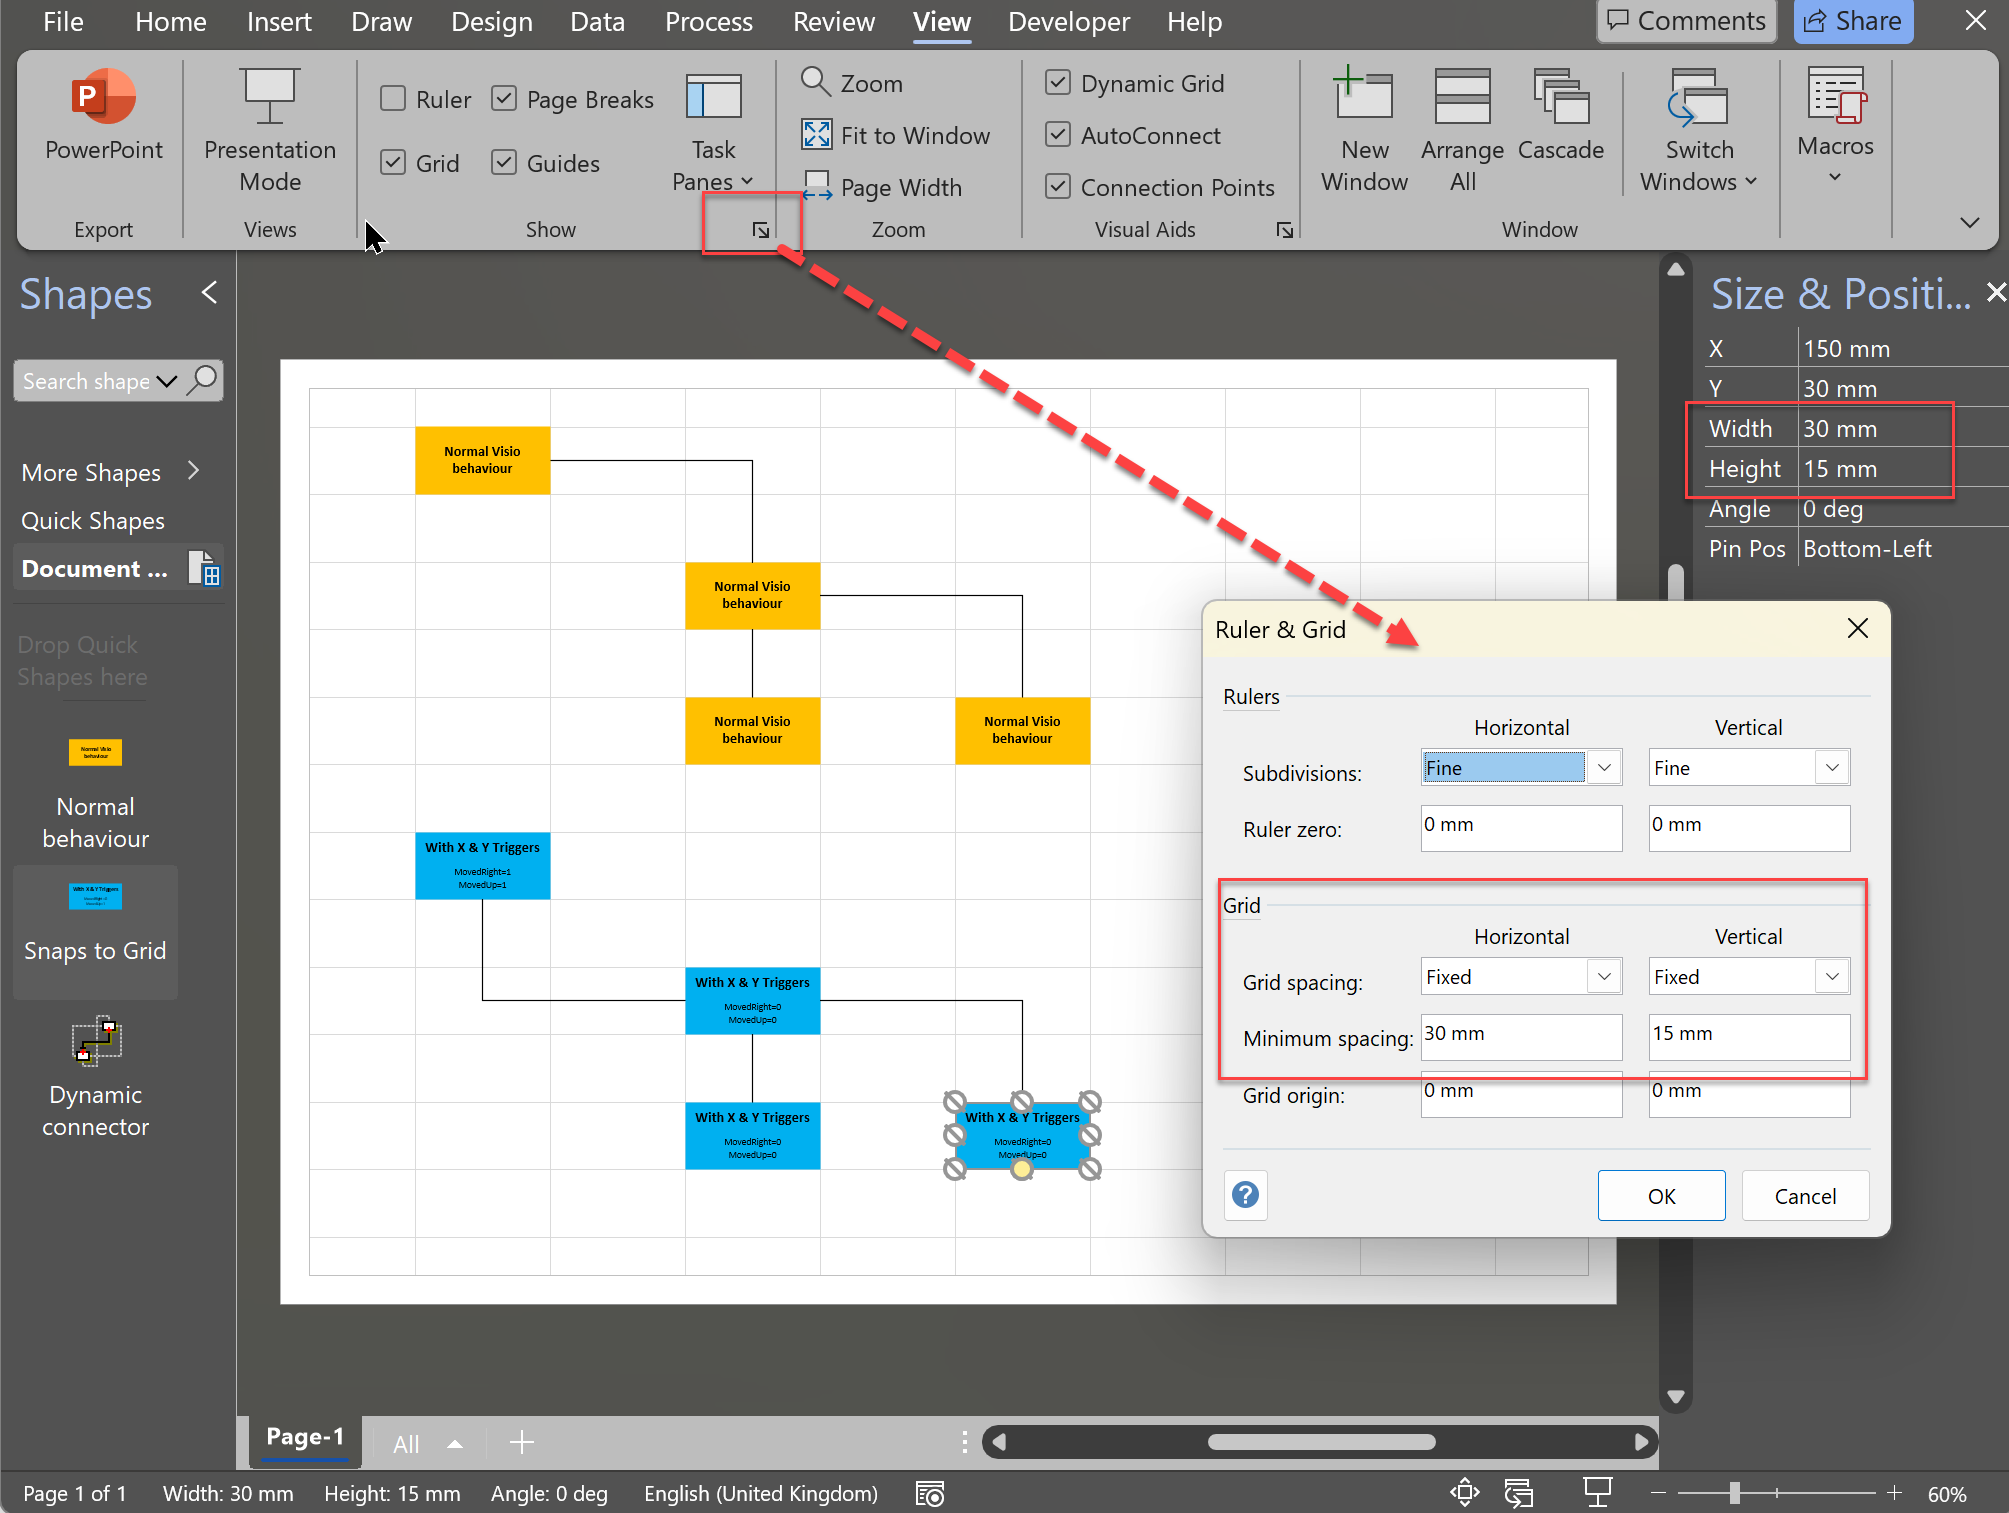
I have previously tackled the subject of snapping to grids in Visio desktop (see https://bvisual.net/2018/06/19/really-snapping-to-grids-in-visio/ ) but a recent project required me to improve the example because it did not respond to all cursor arrow keys. The problem was that the previous solution could not understand which arrow key had been clicked, therefore it did…
Synchronizing Visio Shape Fill Color (or almost any cell) across pages
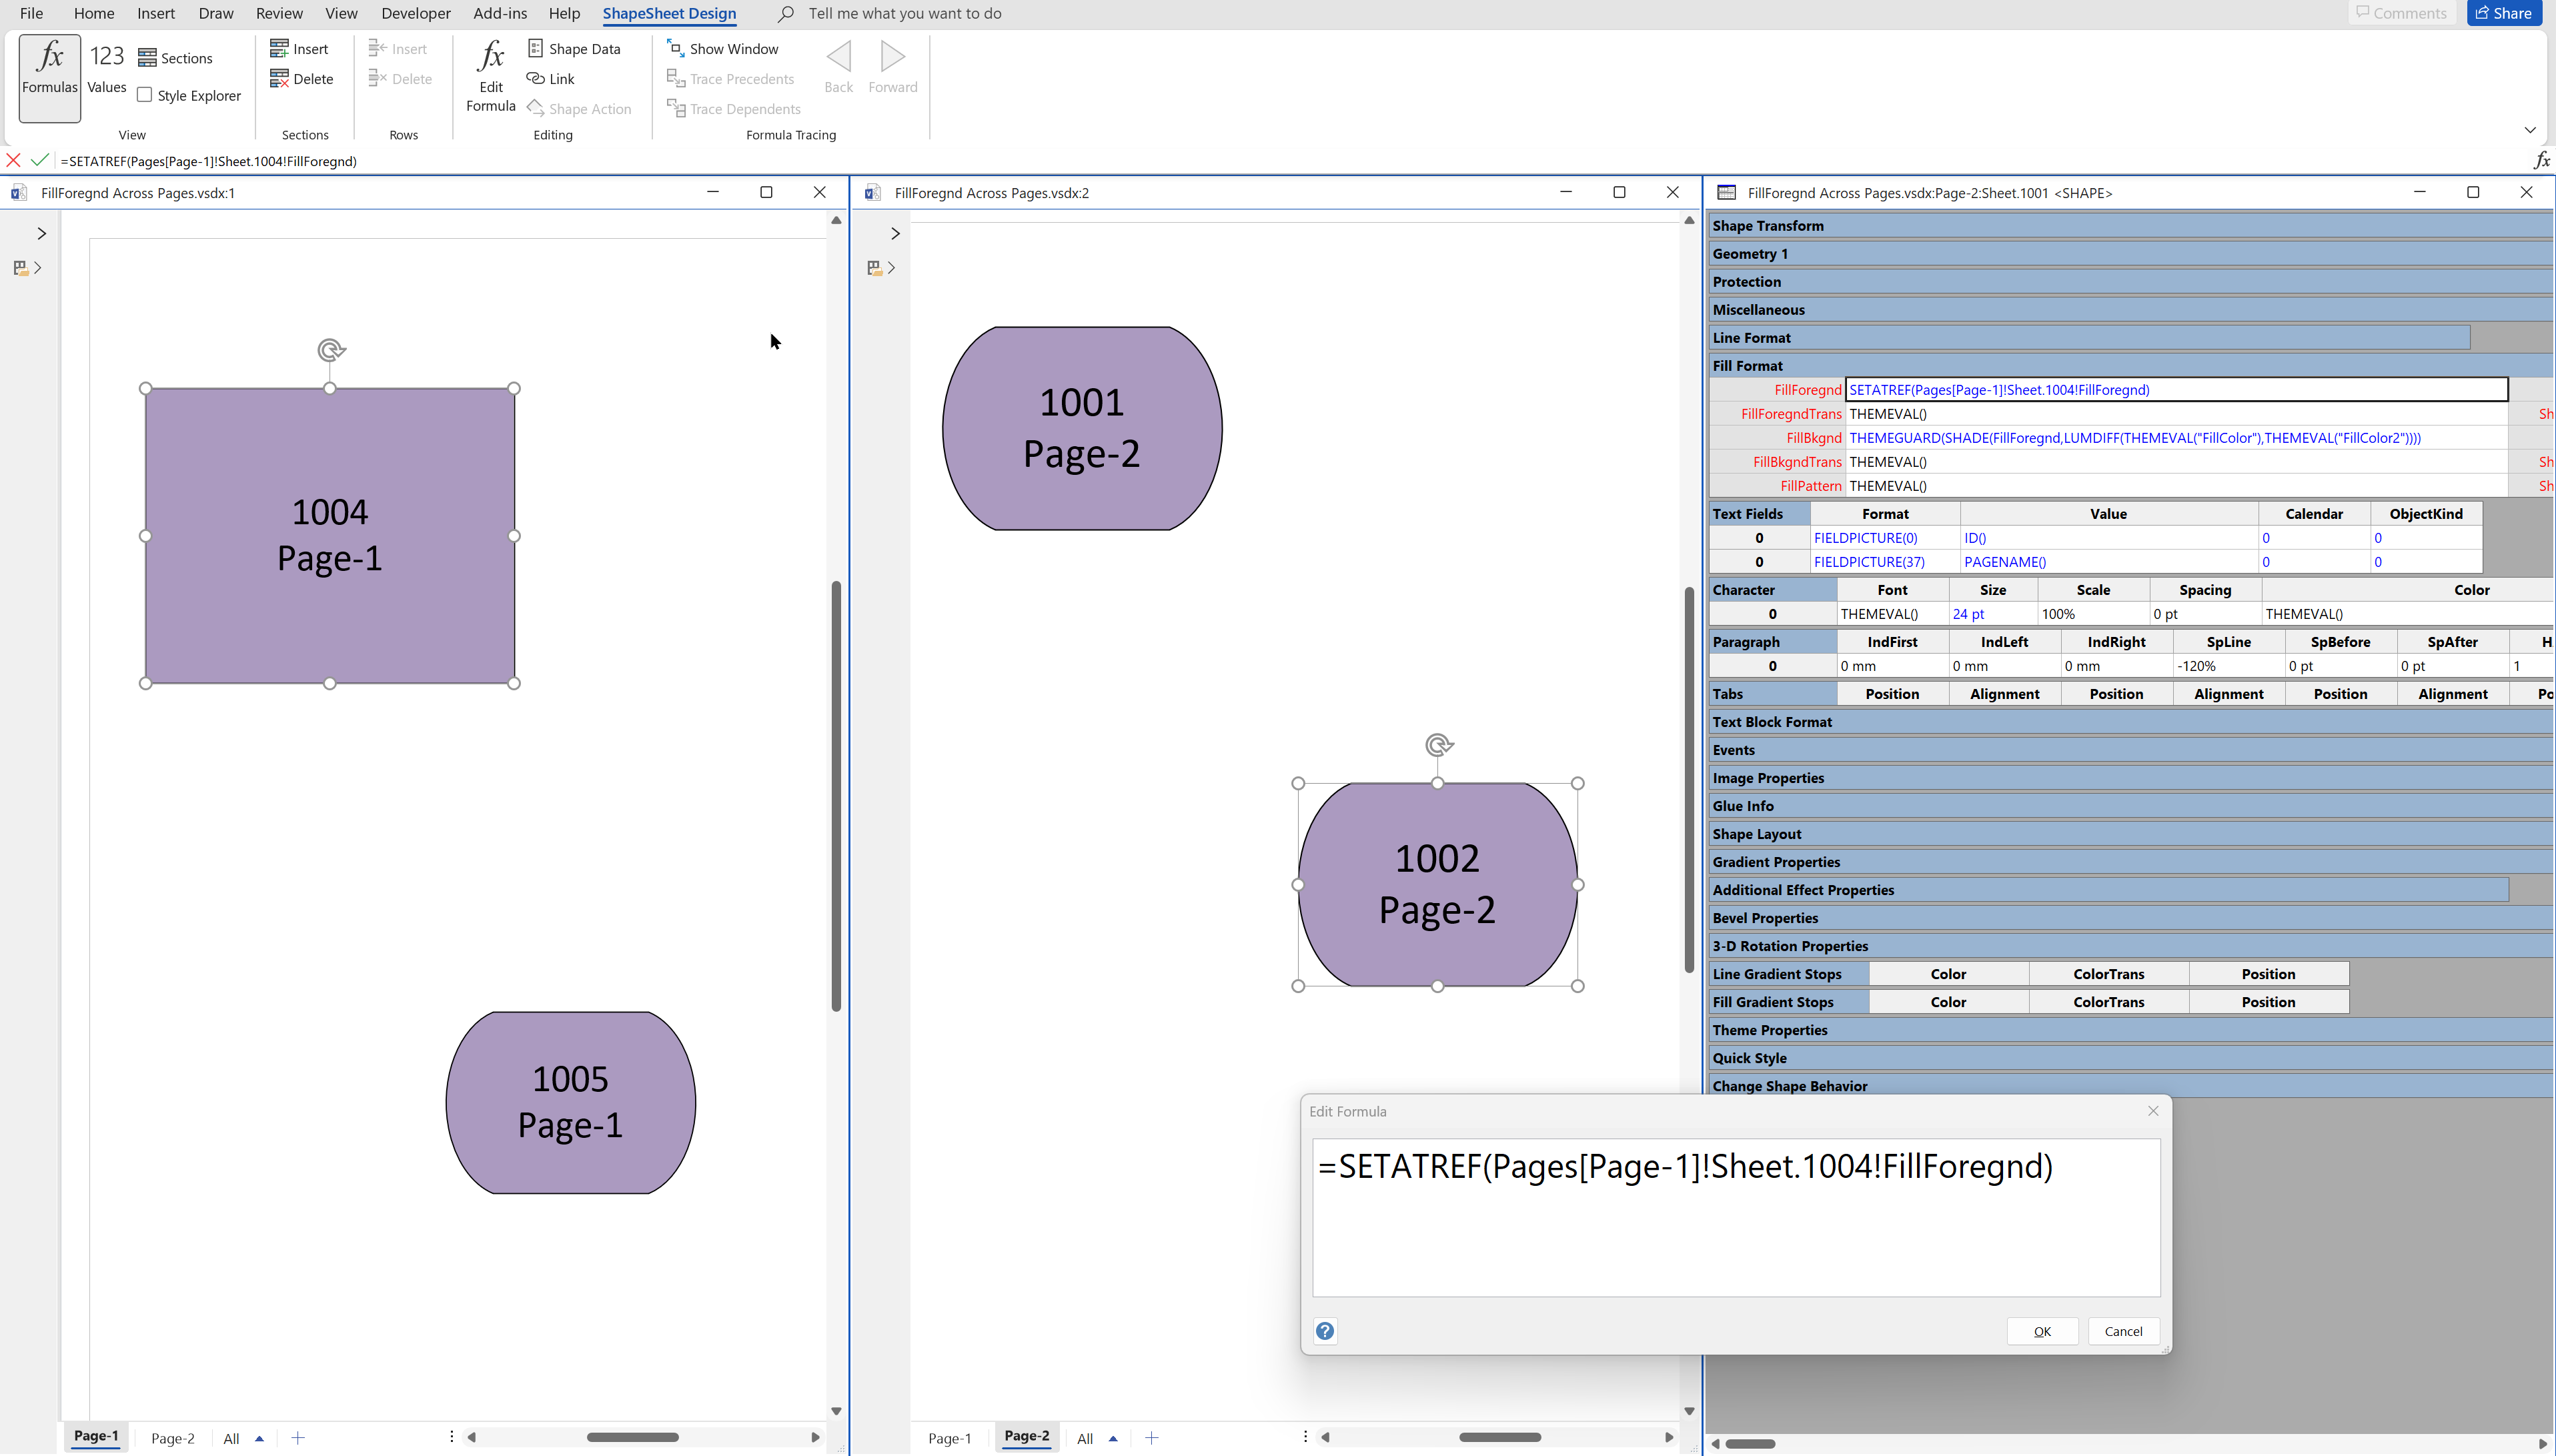
I was recently asked how the color of one shape can be changed and for other shapes to be automatically updated to the same color … even if they are on different pages! Well, it is possible with Microsoft Visio’s awesome ShapeSheet formulas. In fact, this capability is not limited to the FillForegnd cell ……
Getting the Microsoft Office Theme Value
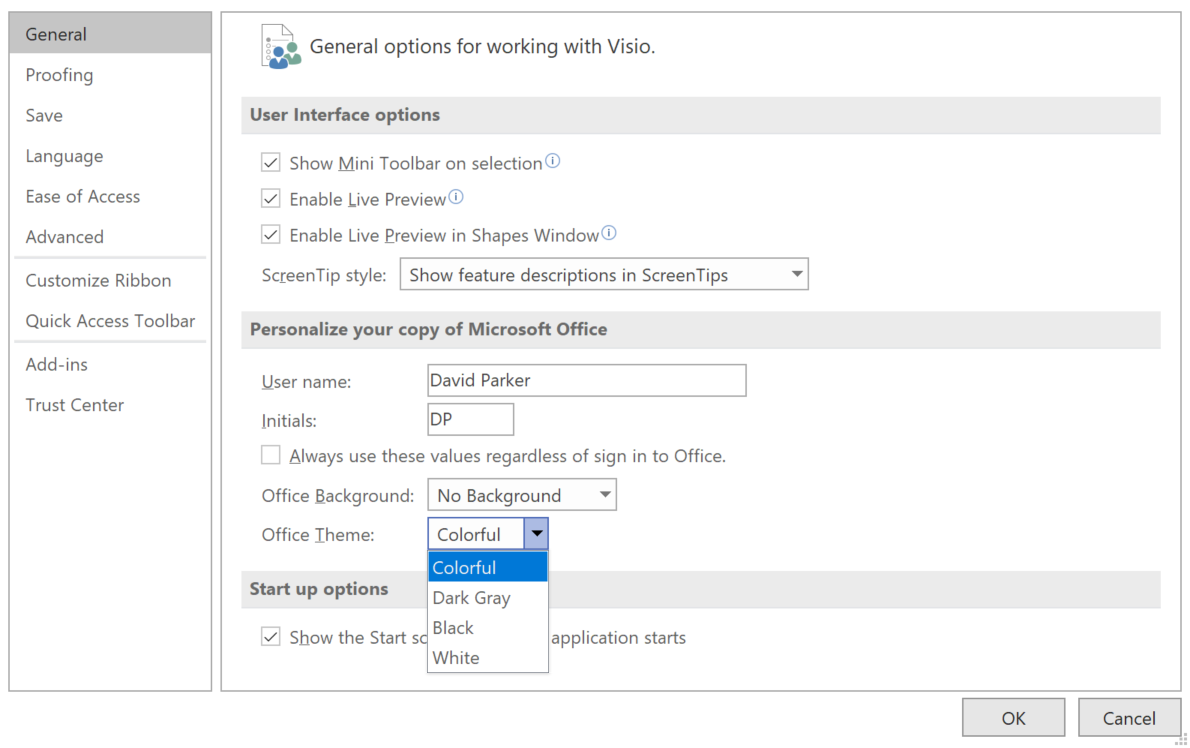
I am working on a Visio VSTO project where I need to synchronise a UI element with the current session Microsoft Office Theme. At first, I thought that there would be some way of getting a value from the Visio object model, but I was wrong…
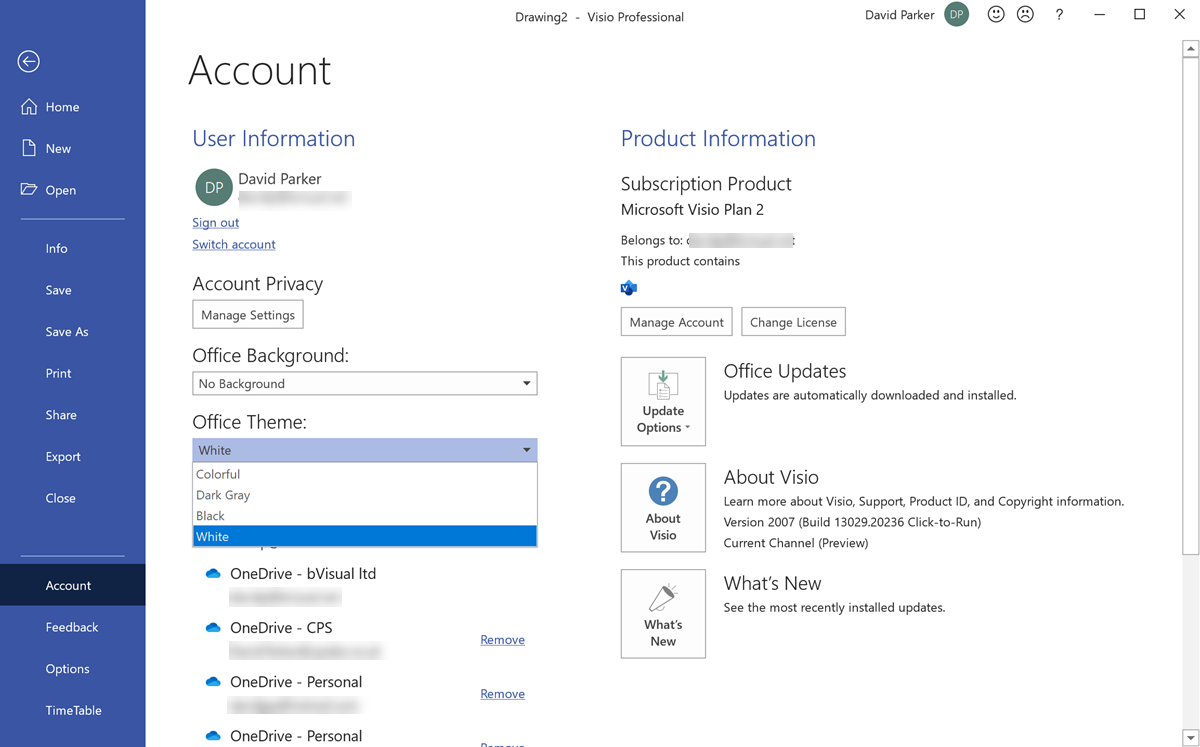
The Office Theme can be selected from either the Visio Options, or the Account Options panels.
[Read more…] about Getting the Microsoft Office Theme Value