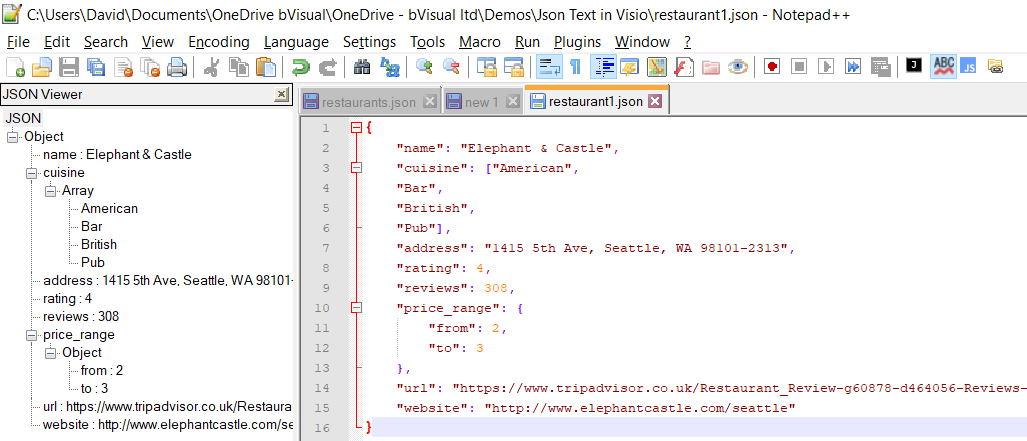
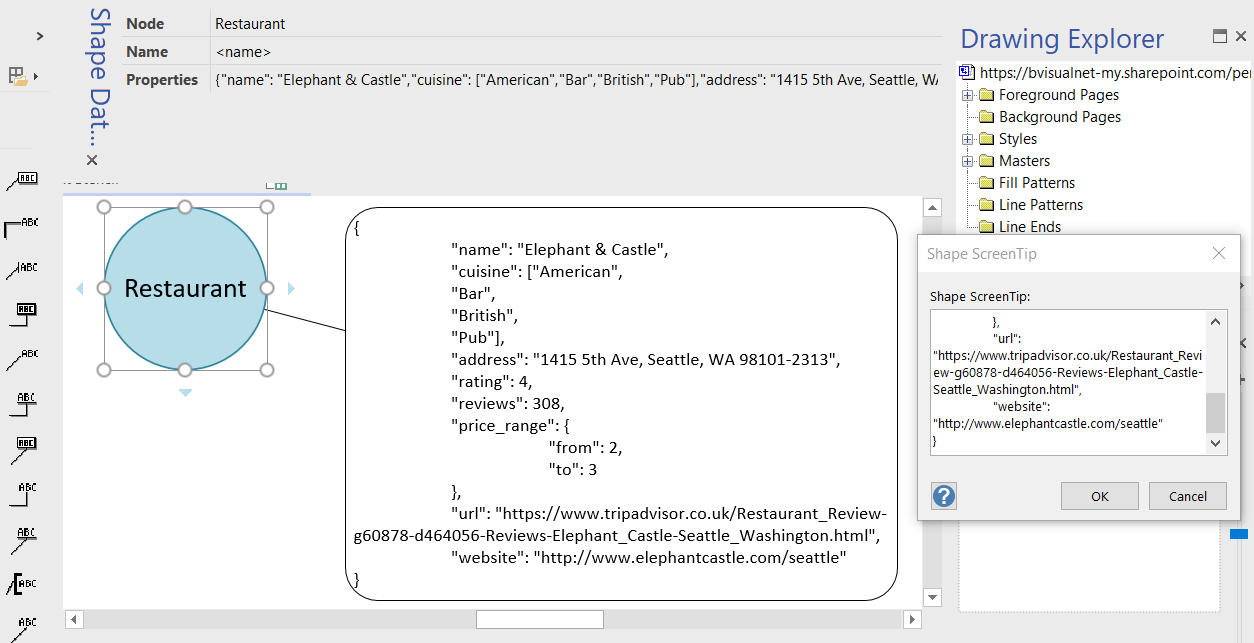
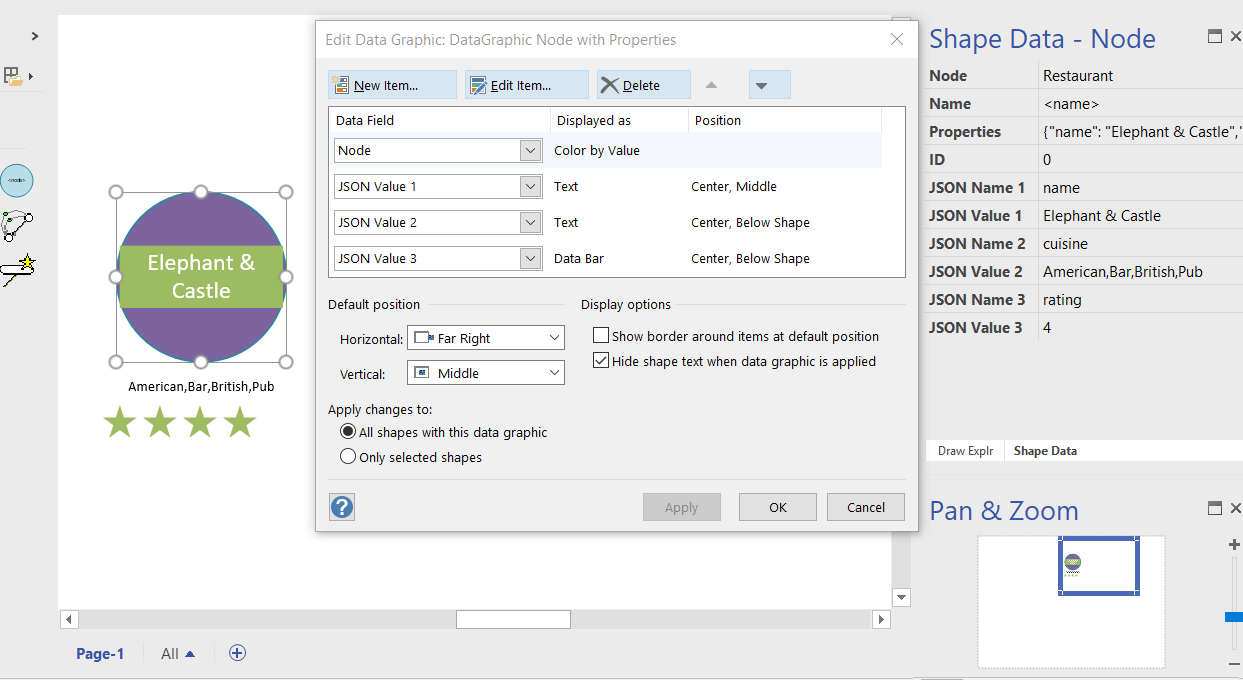
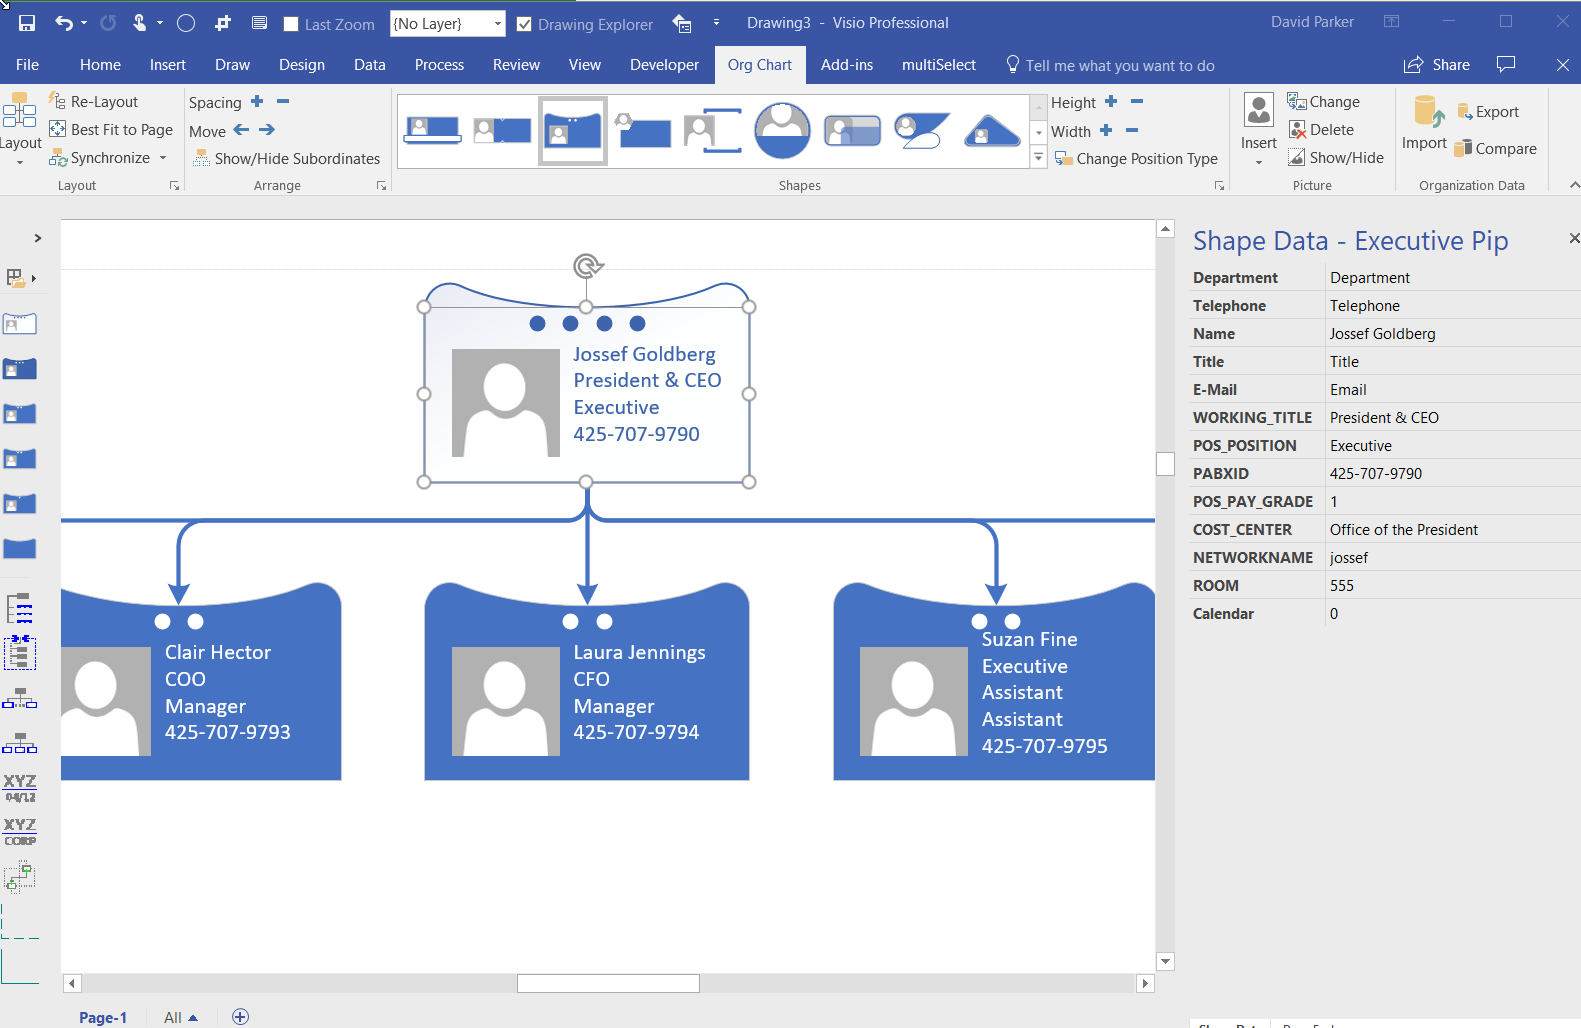
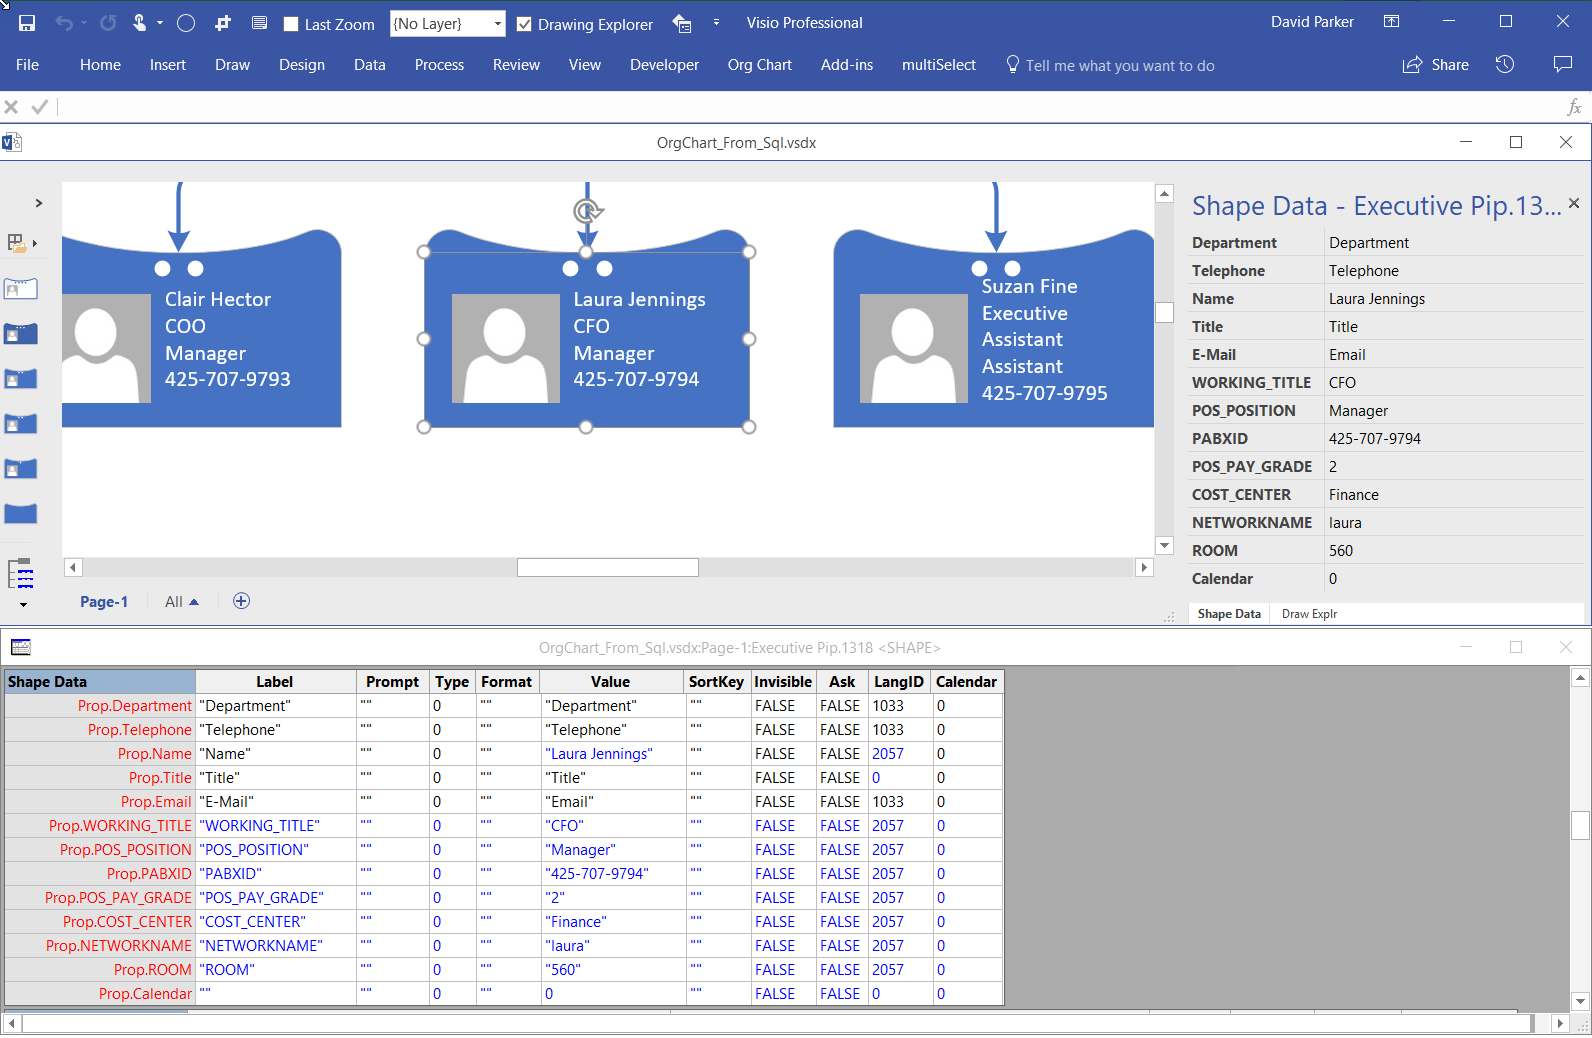
I often create Visio masters with a fixed number of Shape Data rows, and sometimes I get requests to modify them because of changes in business needs. Well, my previous posts about Graph Databases got me thinking if it would be possible to embed JSON text in Visio shapes in some sort of meaningful way. Then the user could enter just attribute-value pairs at will, without the need for me to modify their master shape. Alternatively, the data could be inserted into the shape from a database, such as SQL server. So, in this article I discuss the suitability of JSON text in Visio shapes.
[Read more…] about Using JSON text in Visio shapesShape Data
Aliasing Data Columns for Visio Organization Chart Wizard
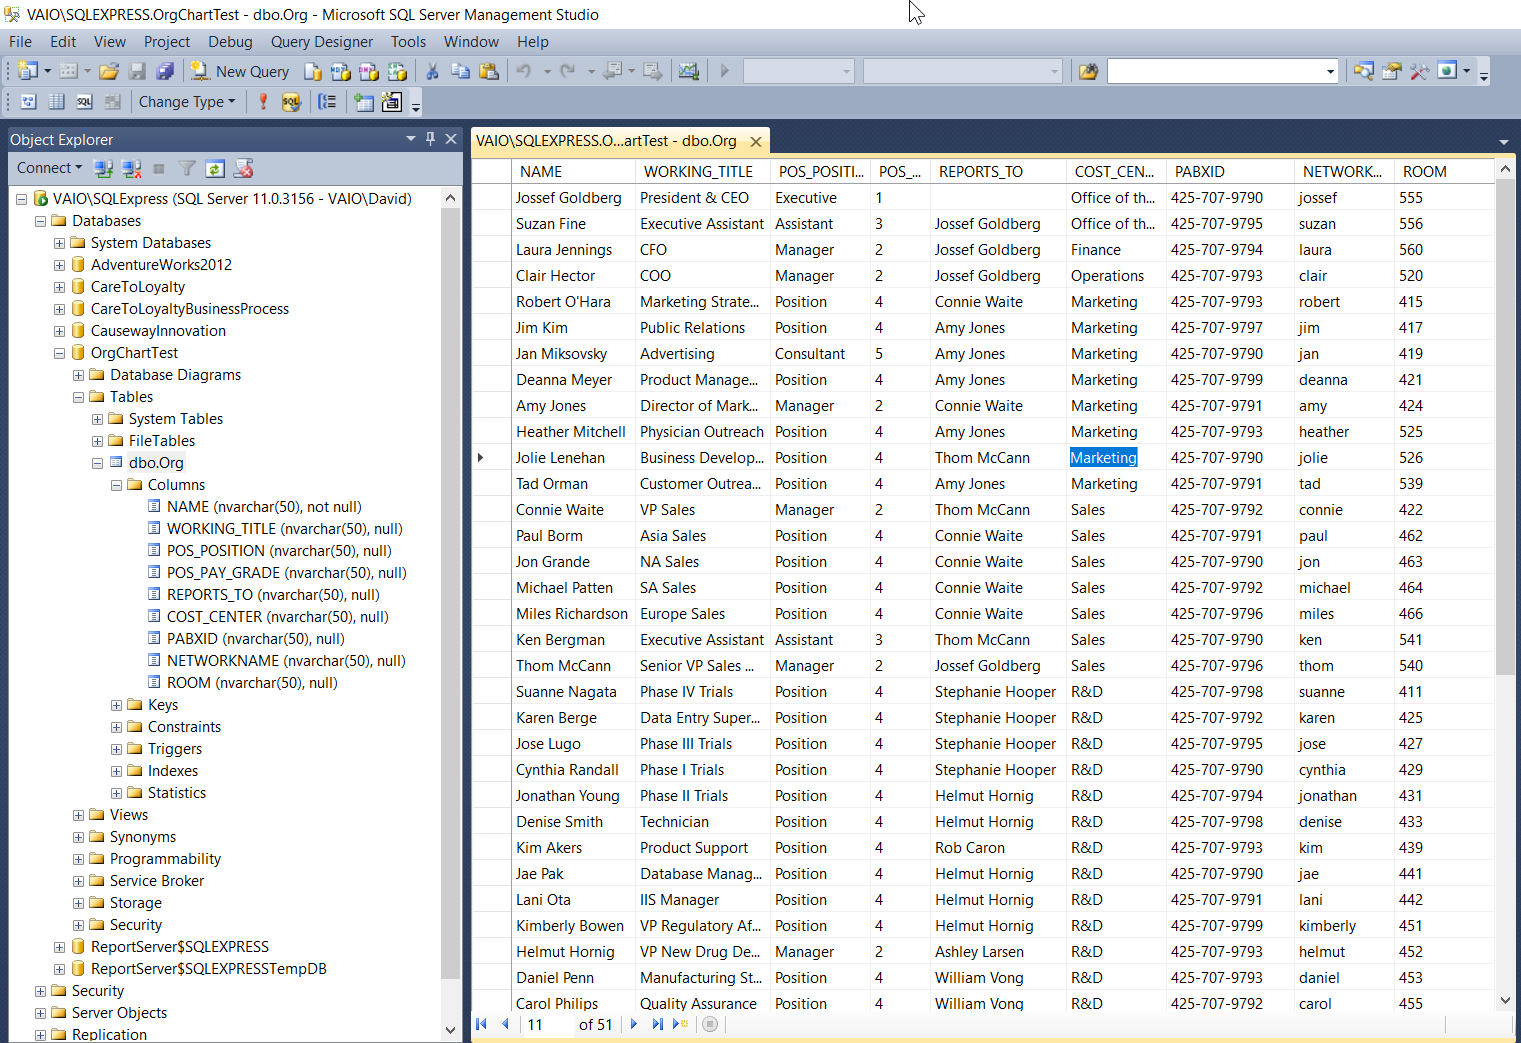
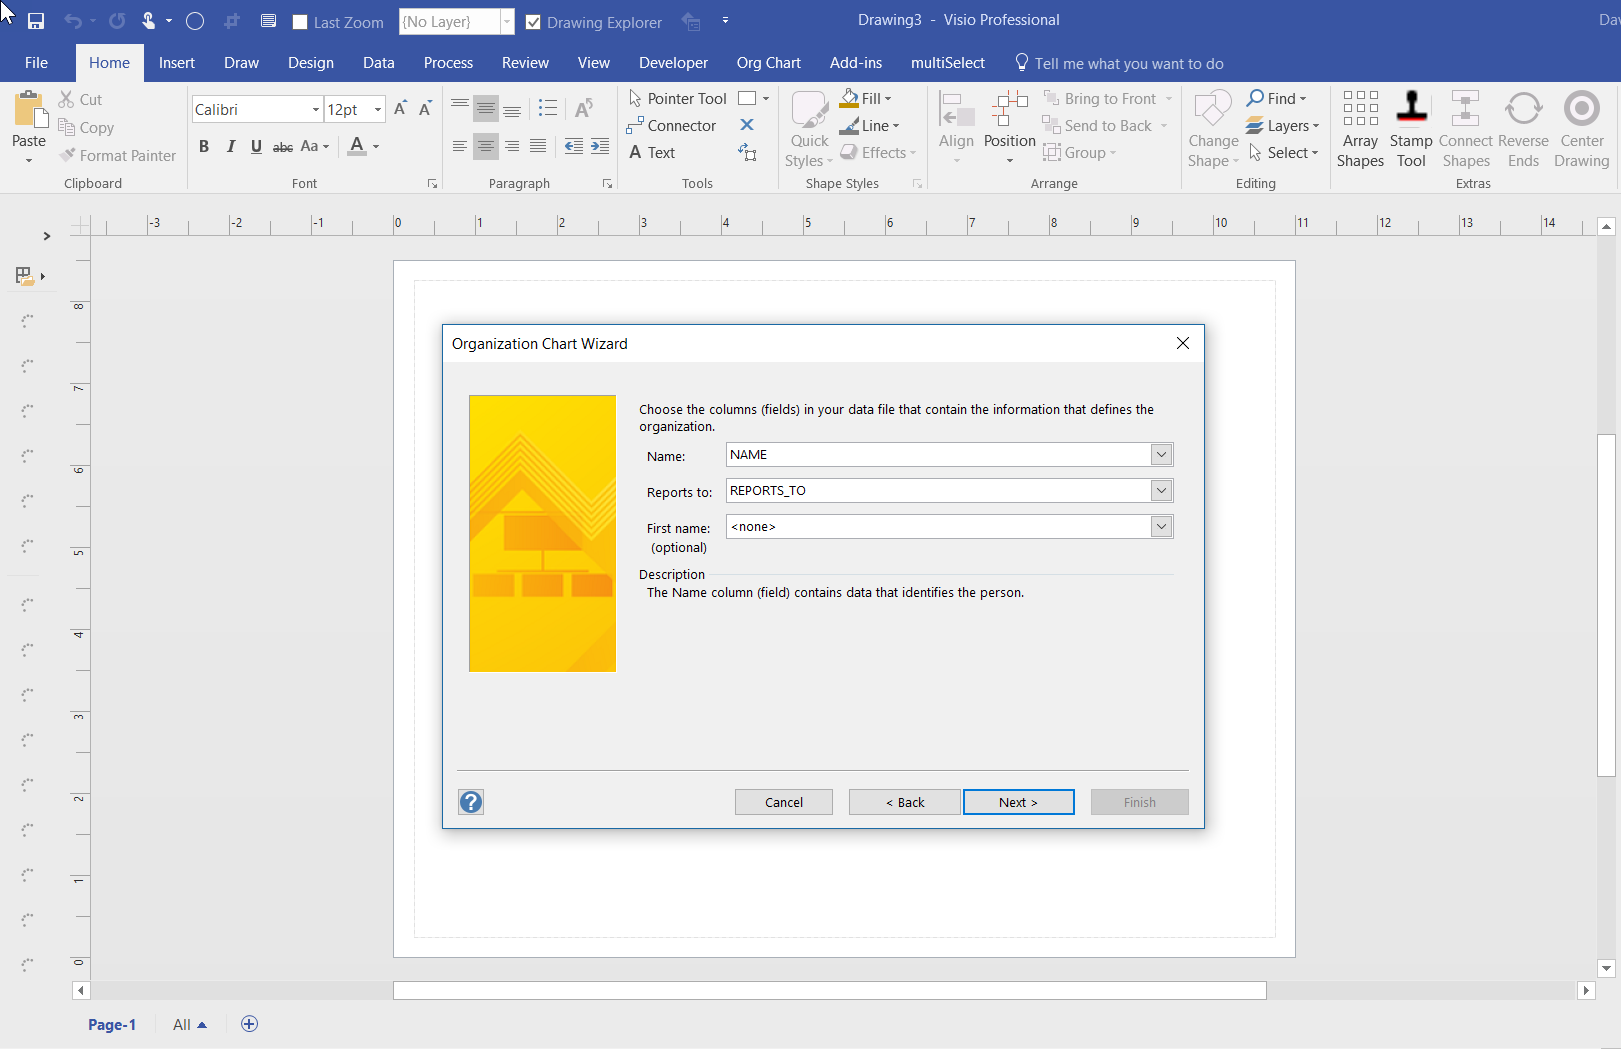
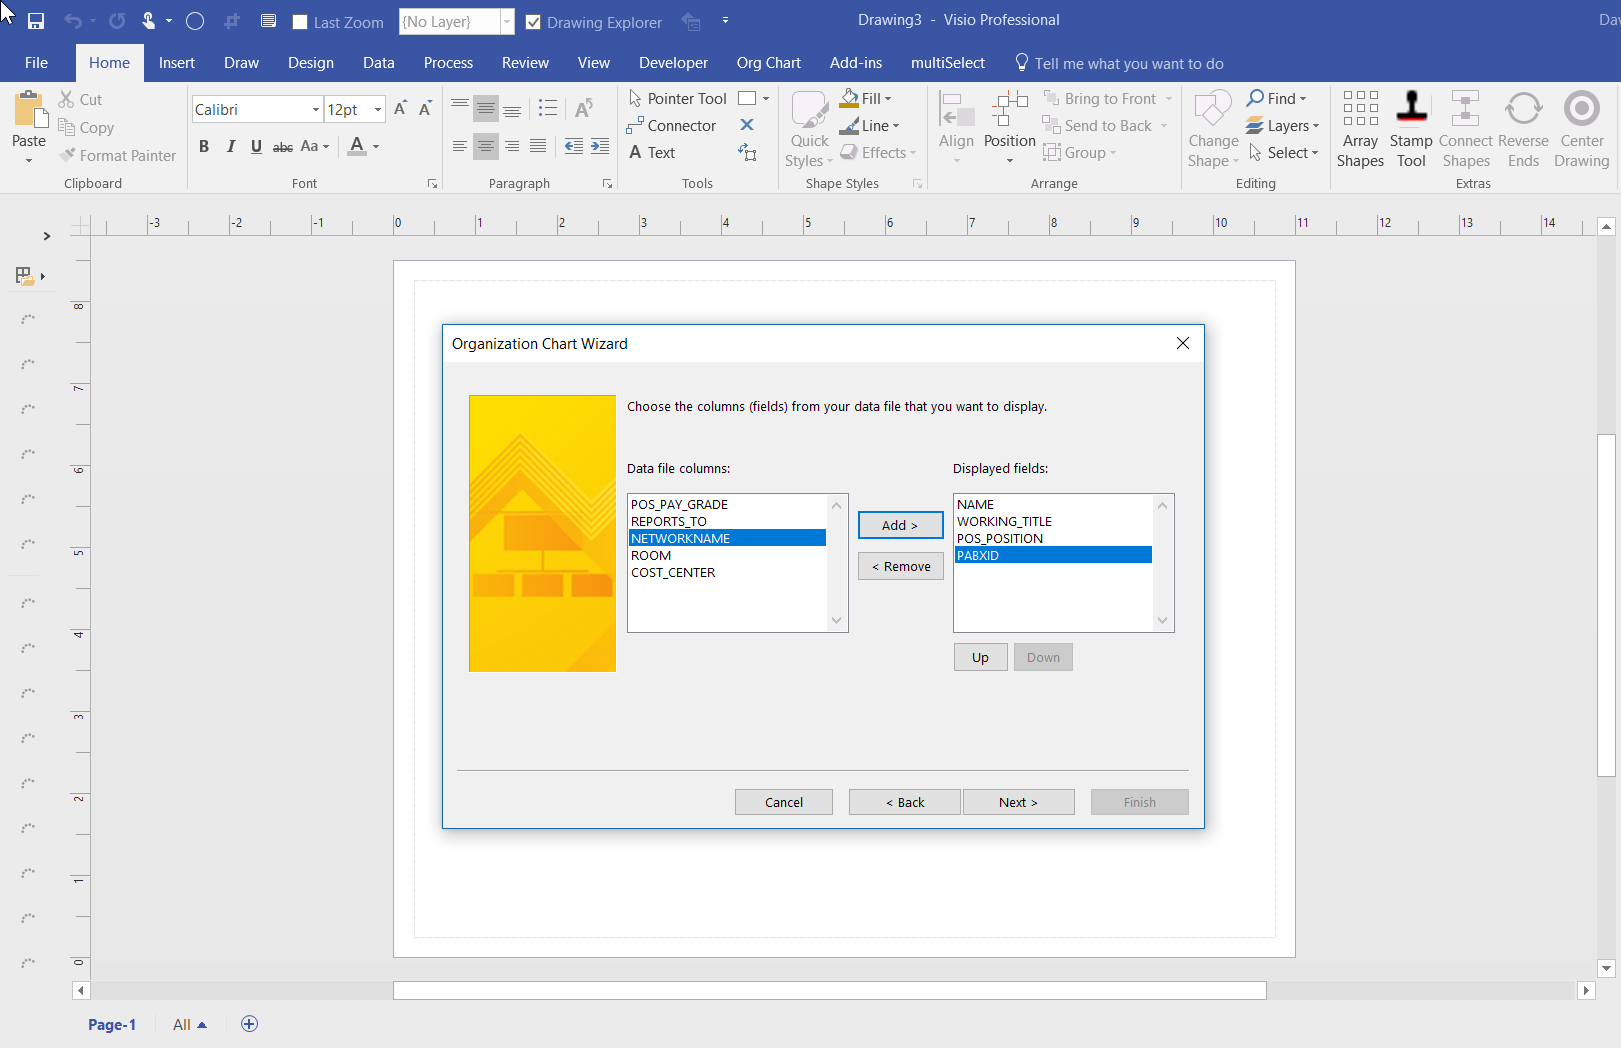
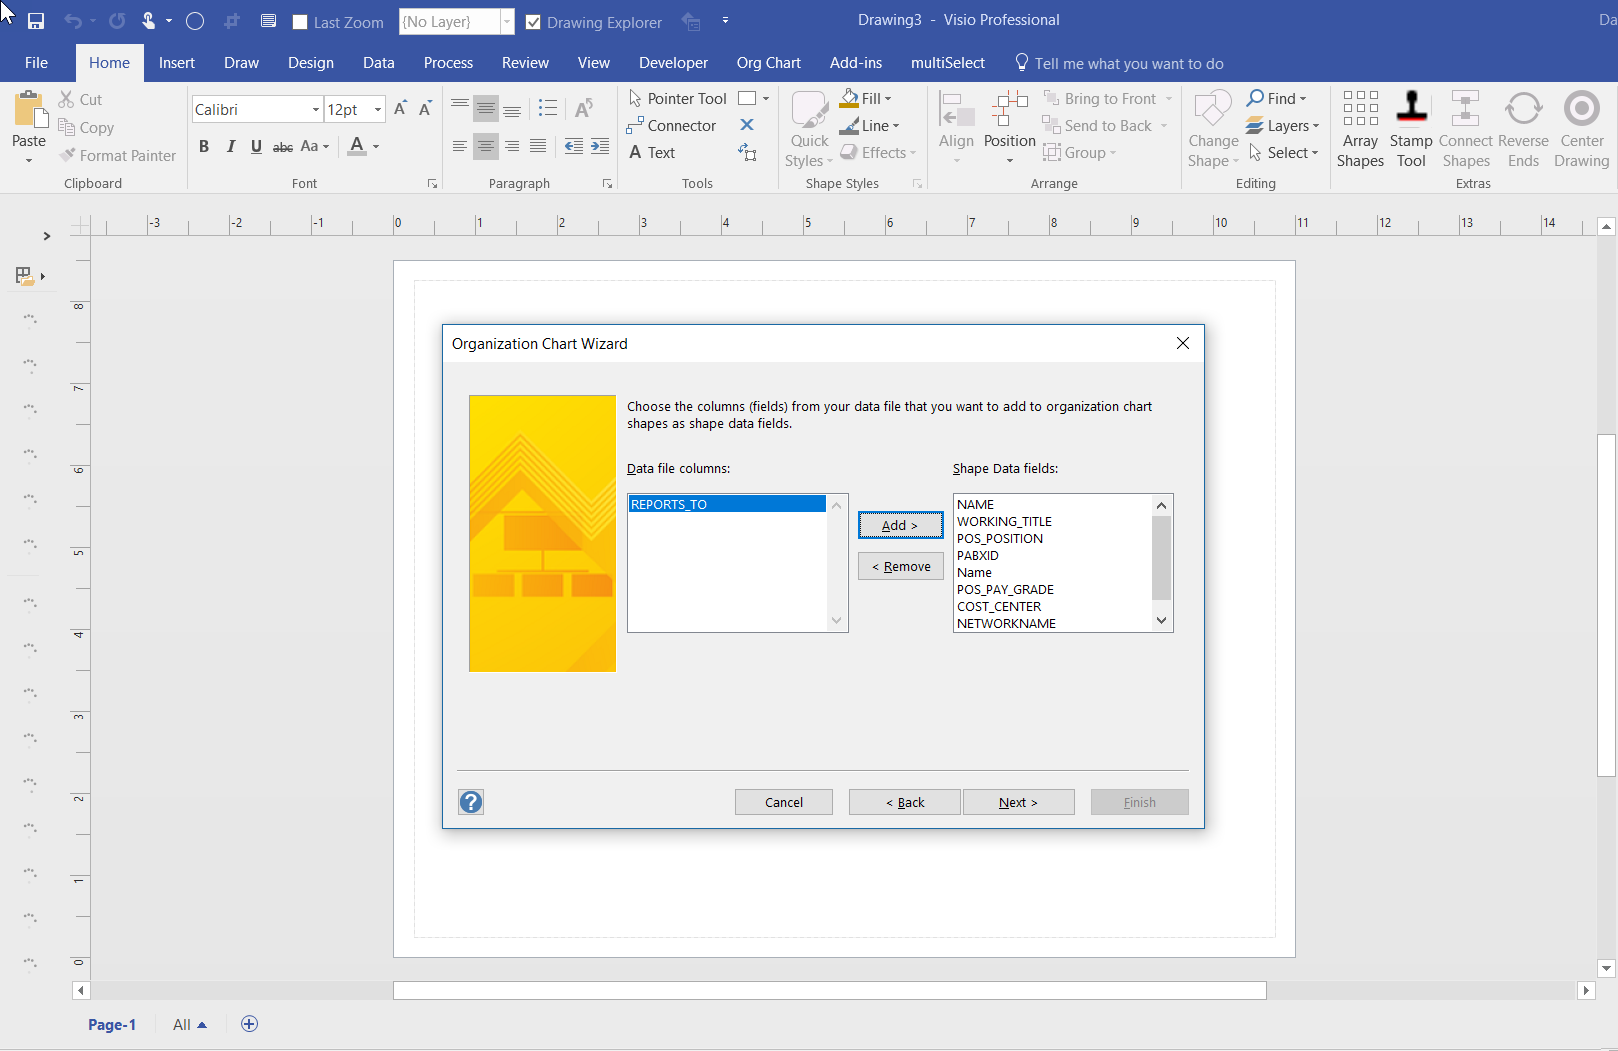
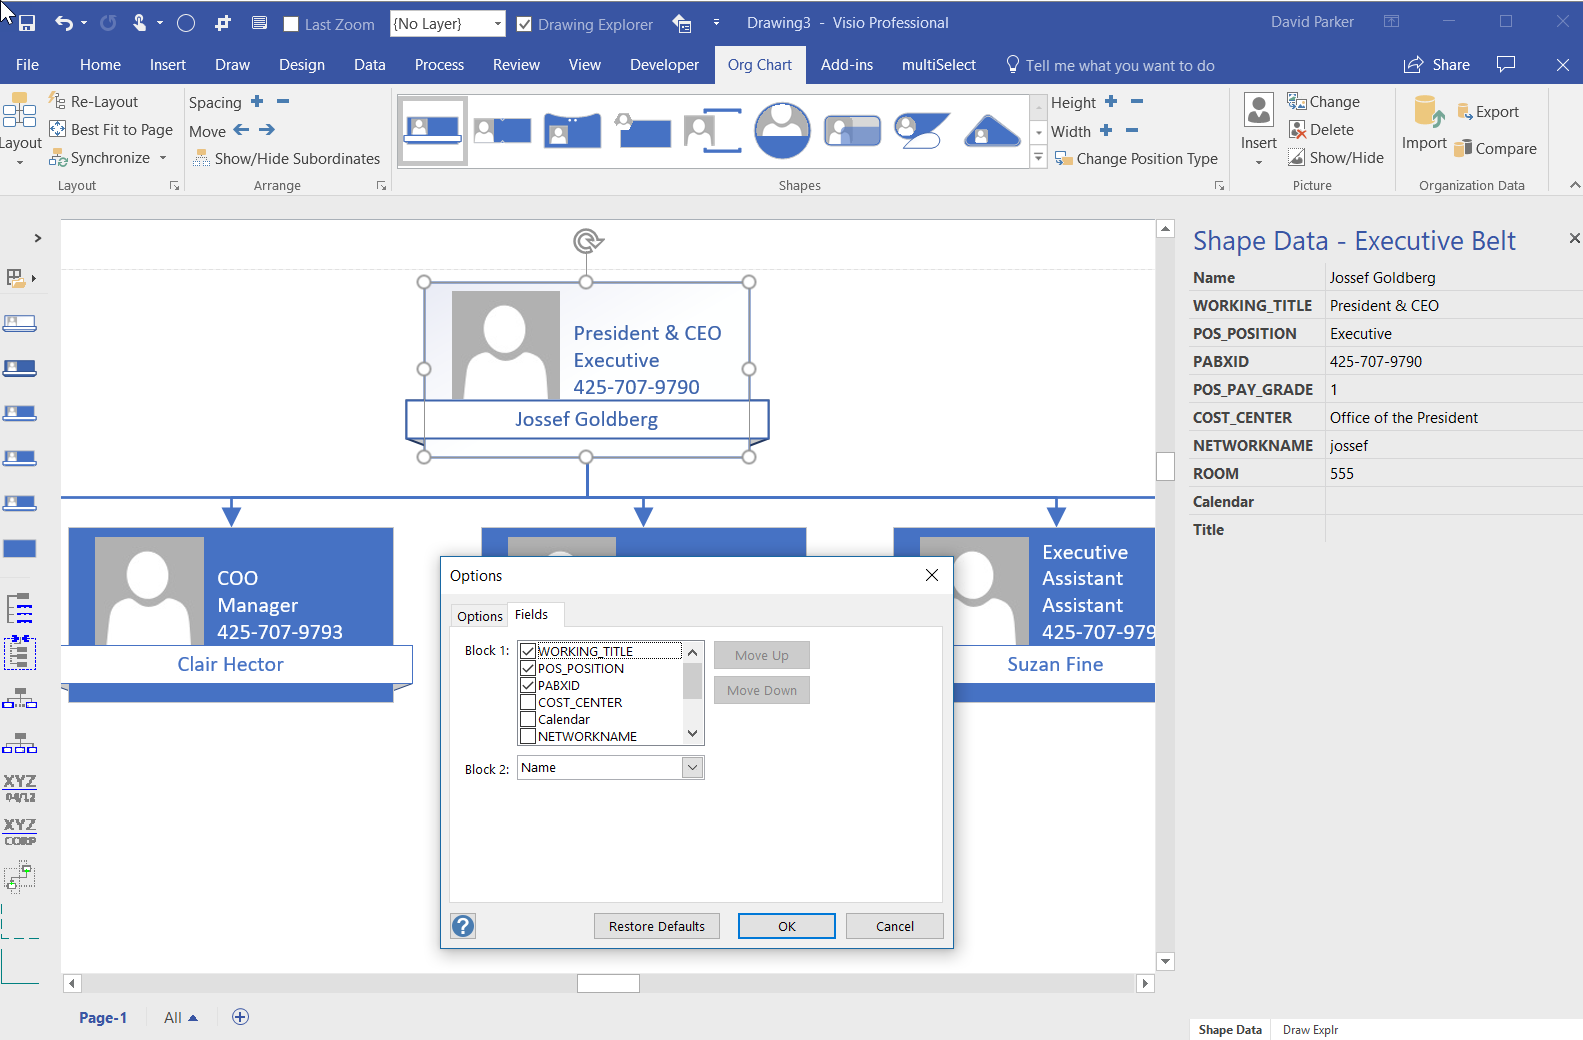
One of the most frequently used components of Visio is the Organization Chart Wizard (OrgChWiz), but it is also one of the most frustrating because of its apparent inflexibility. I was recently asked how to use different table column names with the wizard because the originating ODBC source could not be touched. Well, I have previously used Access to modify and enhance tables in this situation, but the OrgChWiz is quite old, and does not like using the newer Access queries as a data source unfortunately. If the basic table column names do not match the default column names in the organization chart shapes, then there may be superfluous Shape Data rows created on each shape and the ability to change the shape style is compromised, and the Shape Data rows get quite confused!
The Organization Chart template opens with the Belts – Organization Chart Shapes stencil open by default, although the Master shapes used can be replaced with those on one of the other nine using the Org Chart / Shapes gallery:
Understanding Visio’s Color Formulas
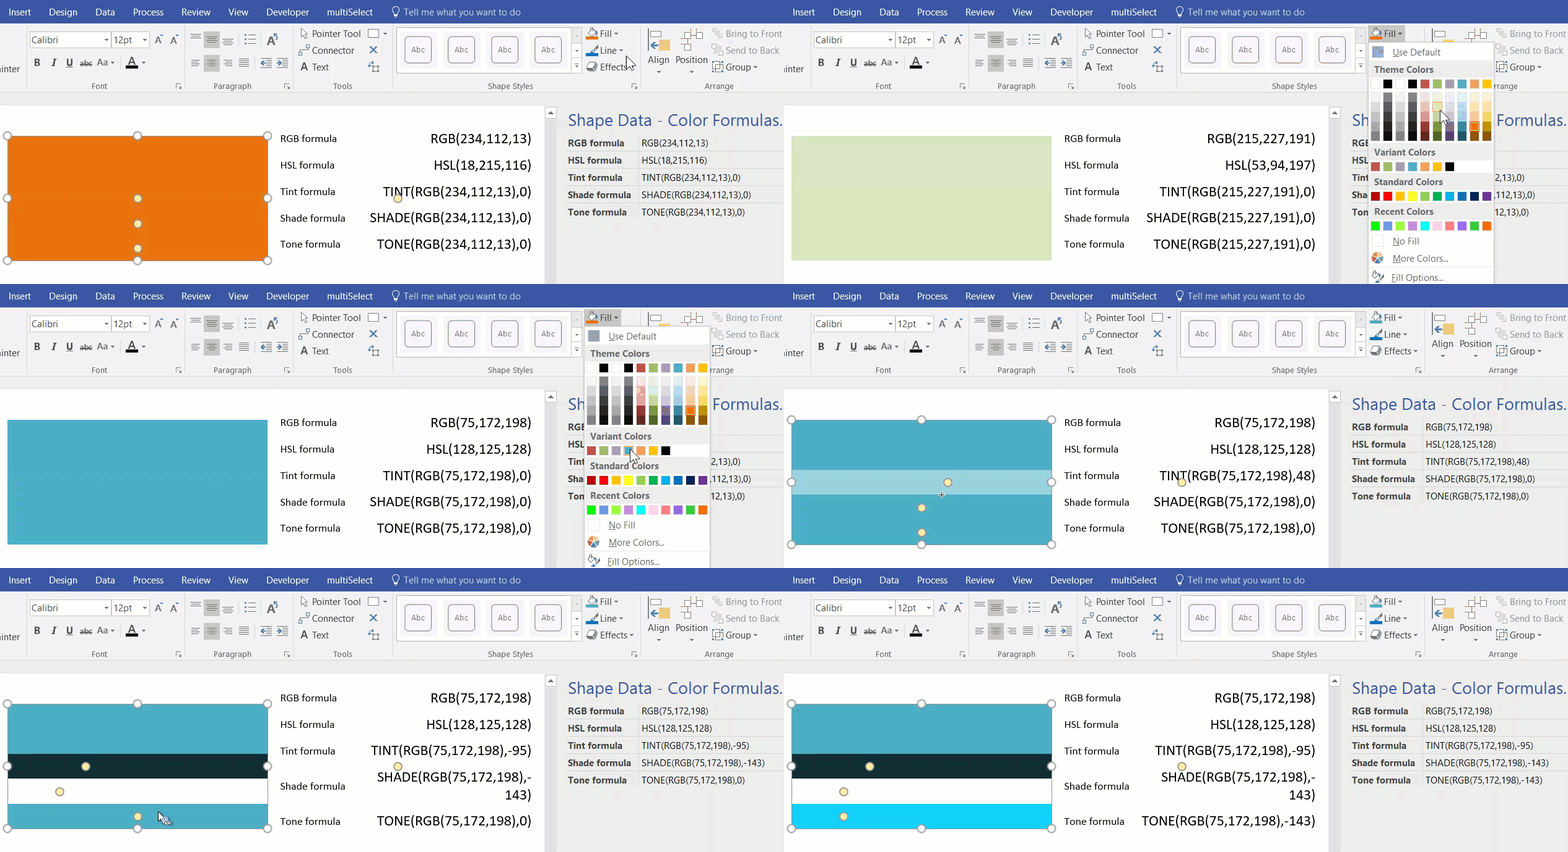
I was recently exploring the ShapeSheet formulas available in Visio that affect colors, and I decided that I needed to make a shape that I can change the fill color, tint, shade and tone of dynamically. This allows me to copy the formulas from a Shape Data row value for pasting into a ShapeSheet cell.
A Blackstar alphabet in Visio
I wrote an article last year for Microsoft, using Visio to explain some bits of messaging and encryption (see Musings on MVP Open Day 2016 at Bletchley Park.pdf ). I finished the article with an unexplained image of a word, well the solution was obviously “BOWIE”, as written on the cover of his final album, Blackstar, released exactly one year ago today.

US State Flags for Visio
I am working on a project where I thought the US State flags might be useful, so I quickly created a new master shape from the images in Wikipedia. The shape simply provides a selection of one of the states from the Shape Data window (plus one extra for the reverse of Oregon’s flag!).
The flag shape has a couple of Shape Data rows:
New book available for pre-order : Mastering Data Visualization with Microsoft Visio Professional 2016


I have a new book on Visio coming out in June called Mastering Data Visualization with Microsoft Visio Professional 2016. It covers the ins and outs of data with Visio!
Please visit http://bit.ly/1SeVfwW for more information.
Packt Publishing are currently running a deal on my last book, Microsoft Visio 2013 Business Process Diagramming and Validation , until 12th April 2016:
Follow this link : 1LHNDwI
