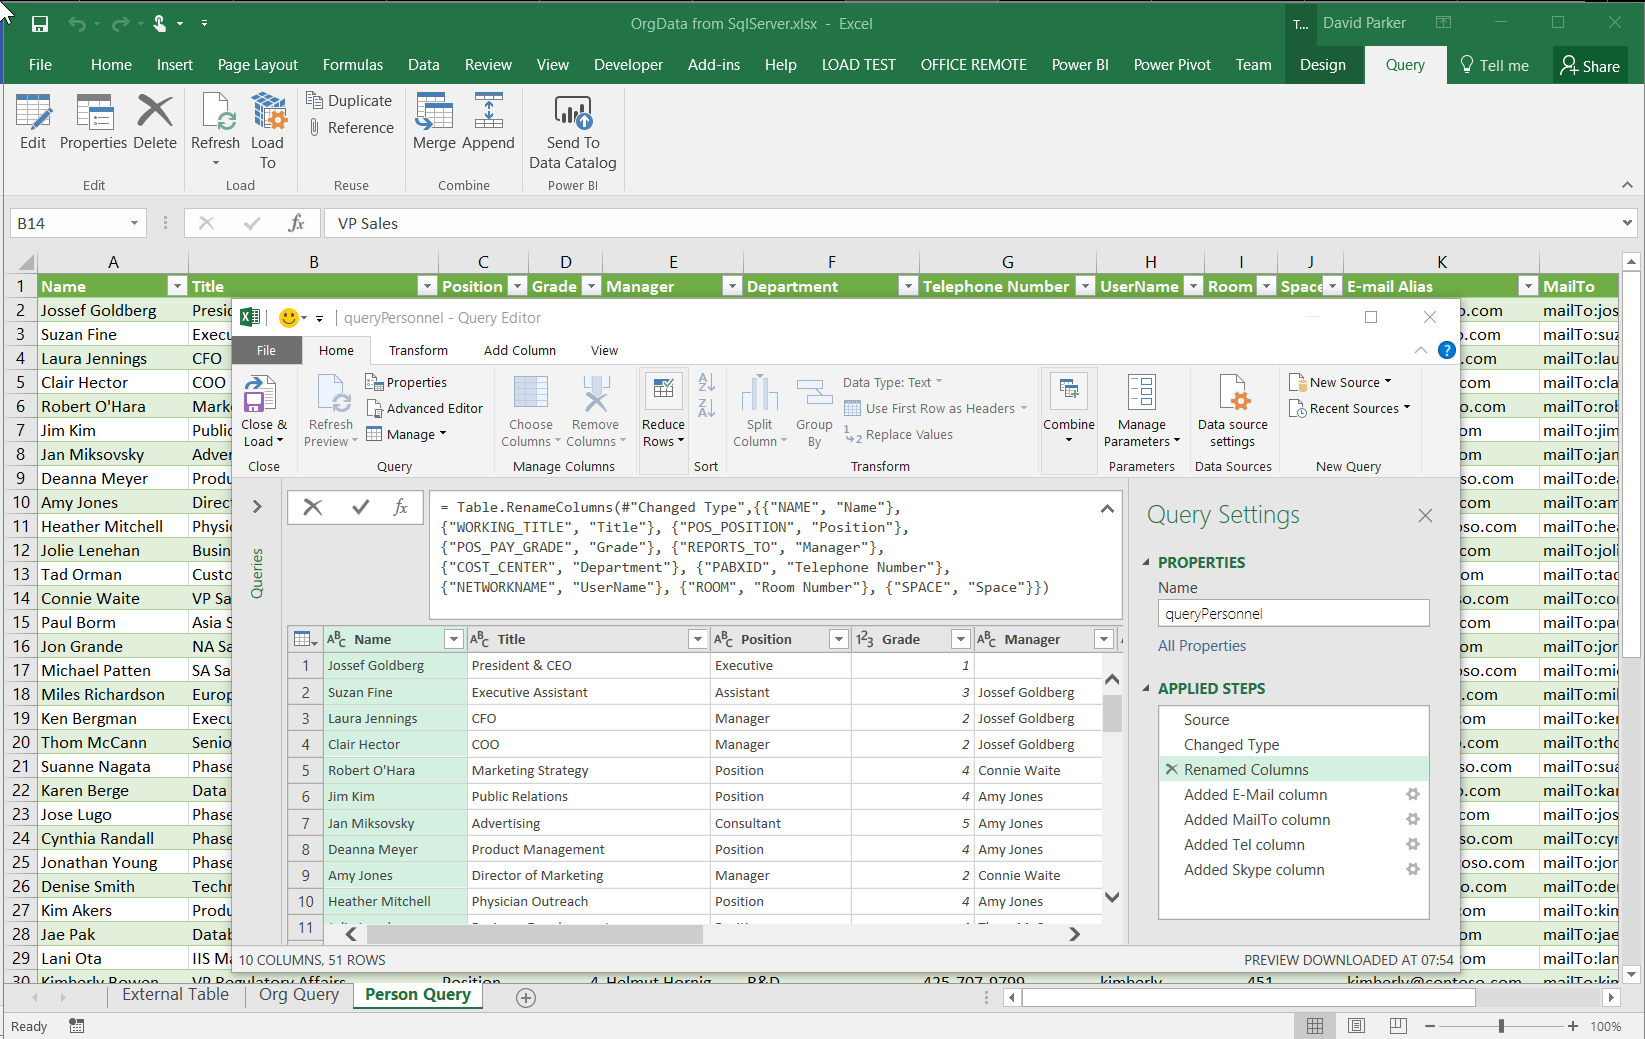
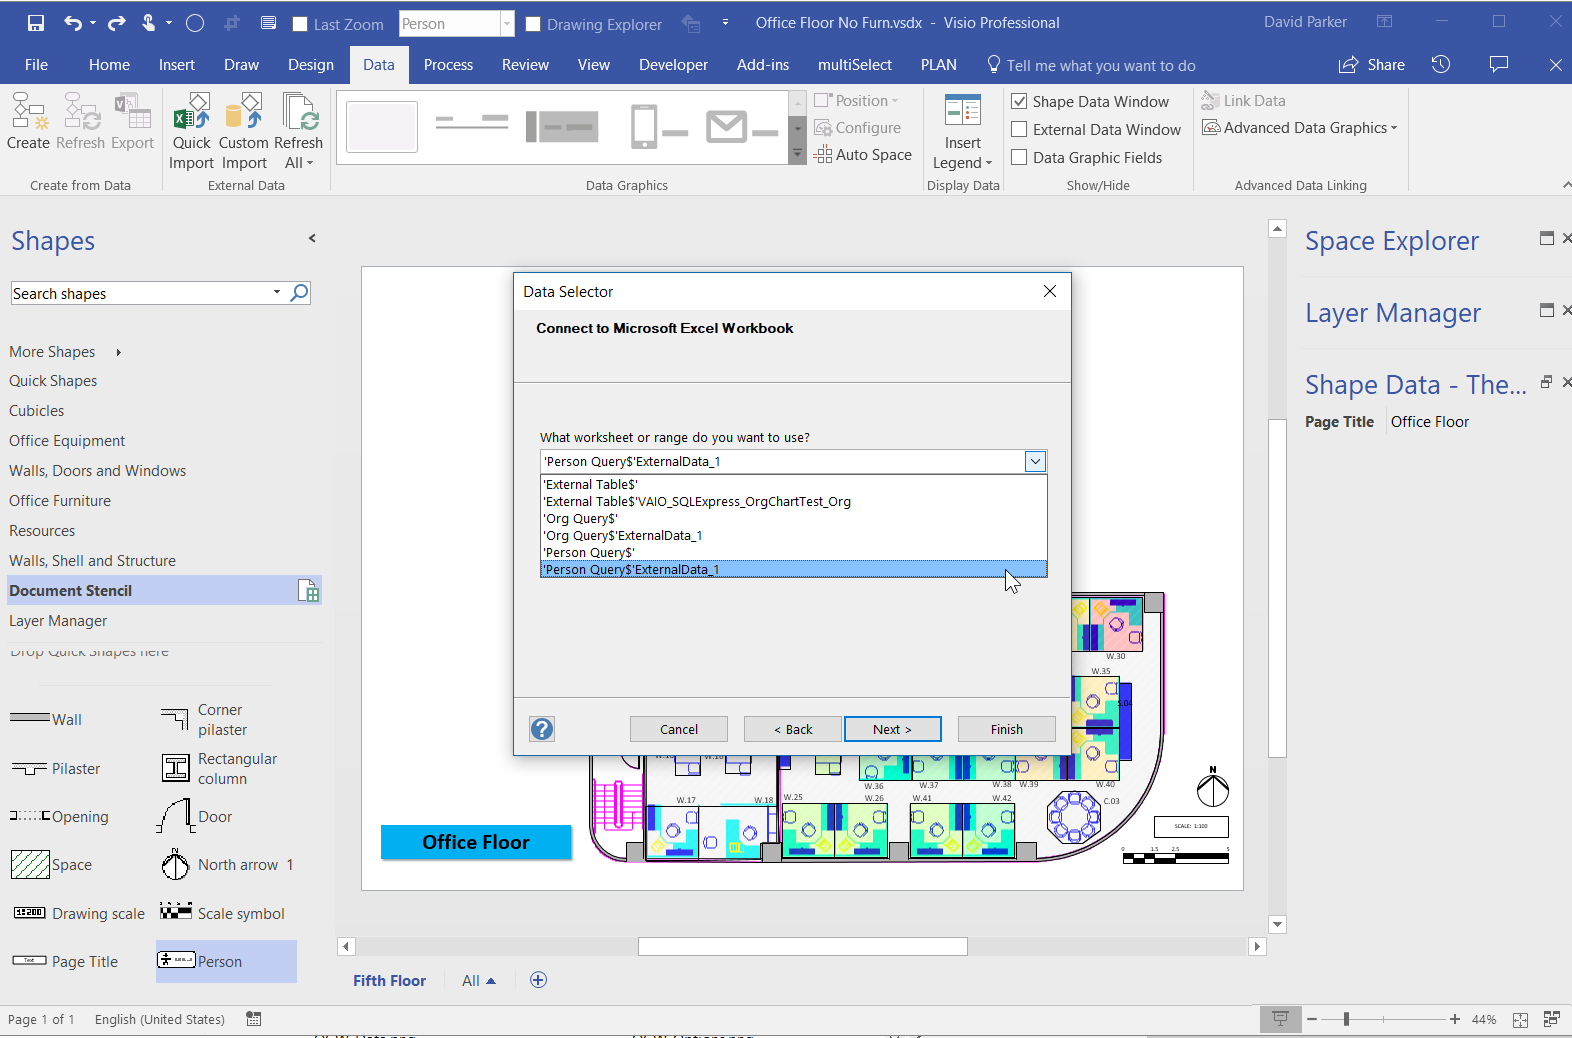
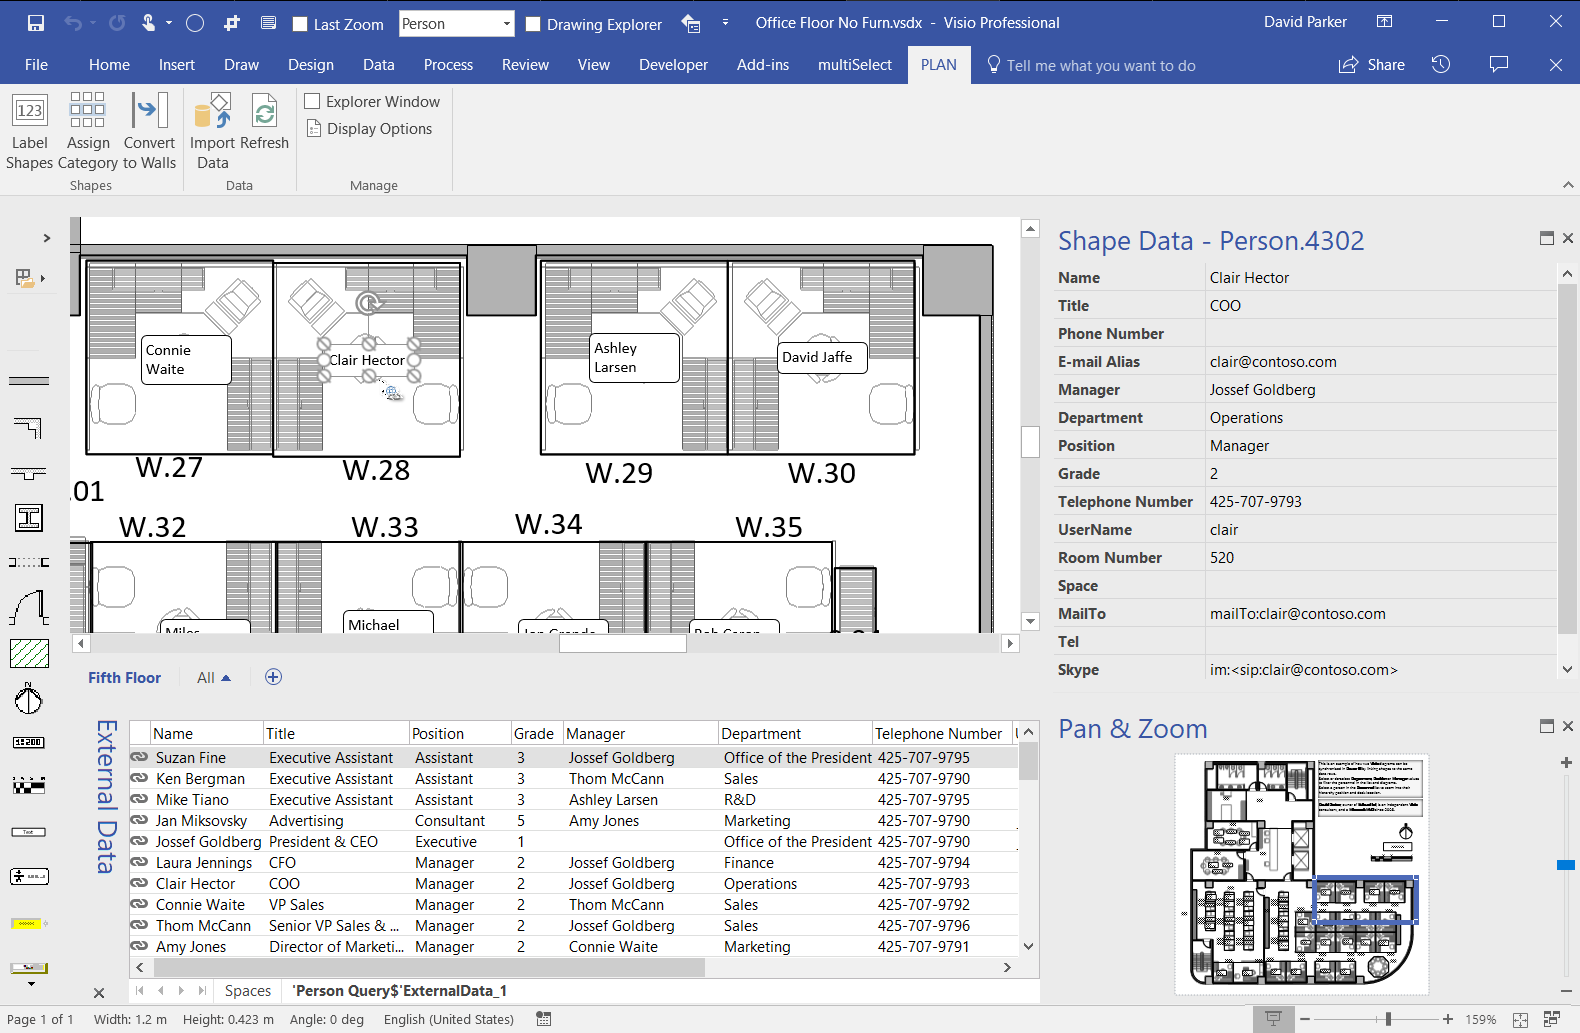
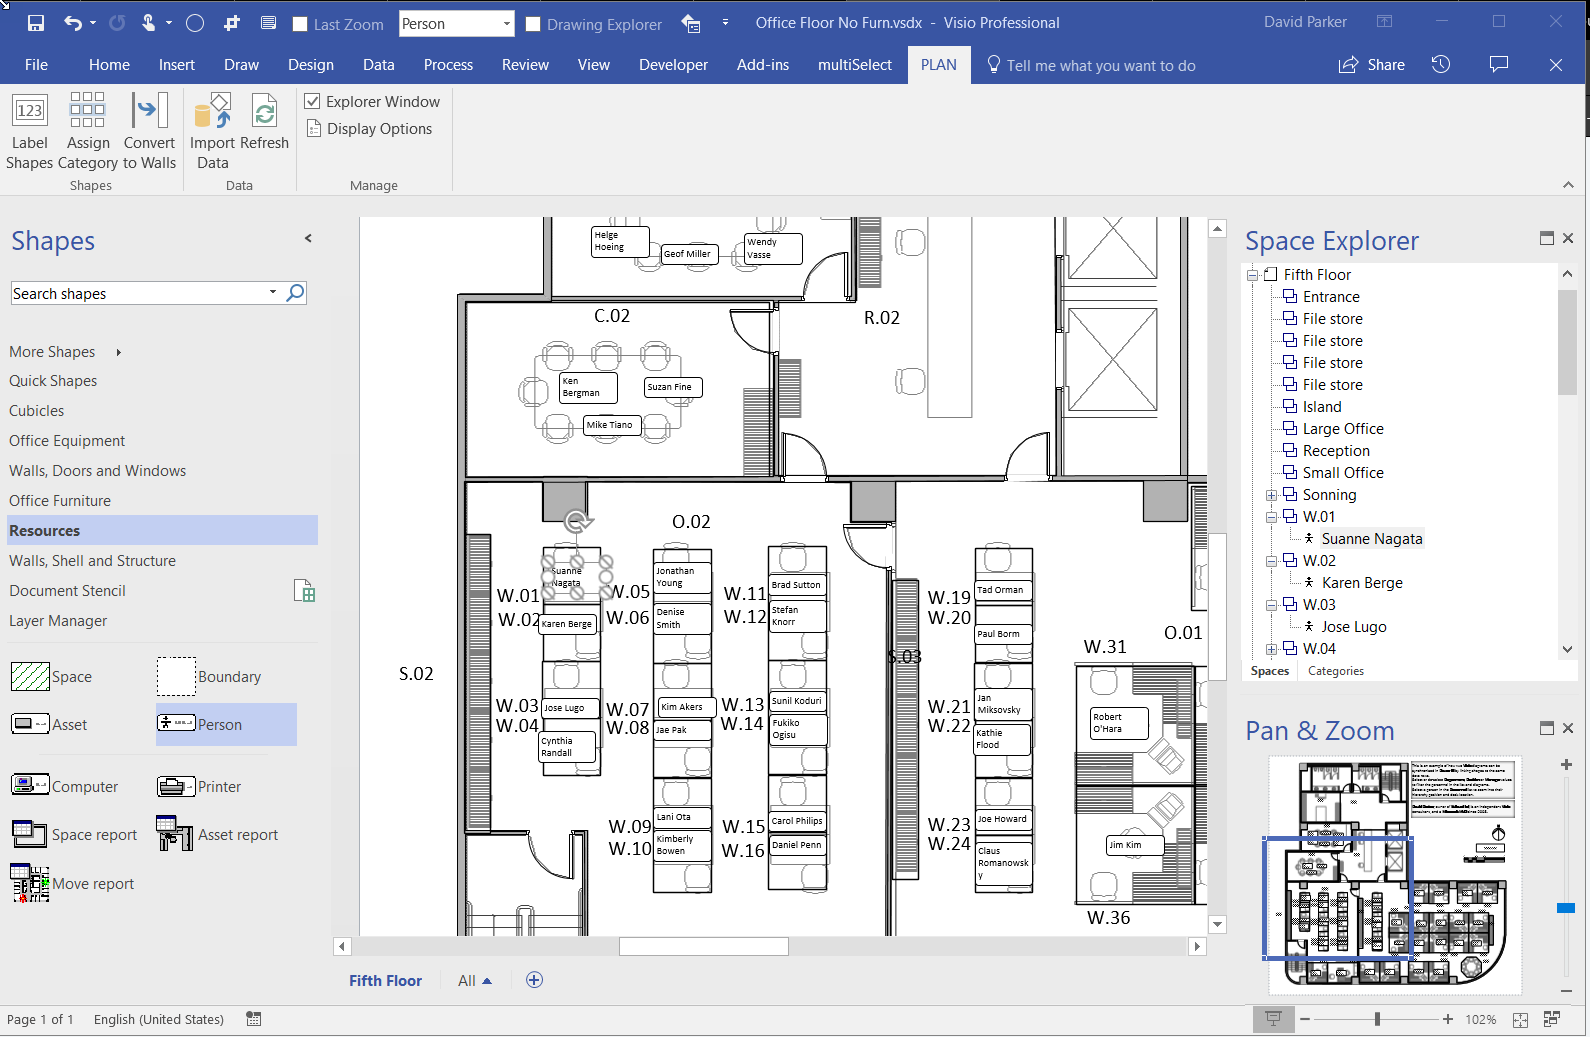
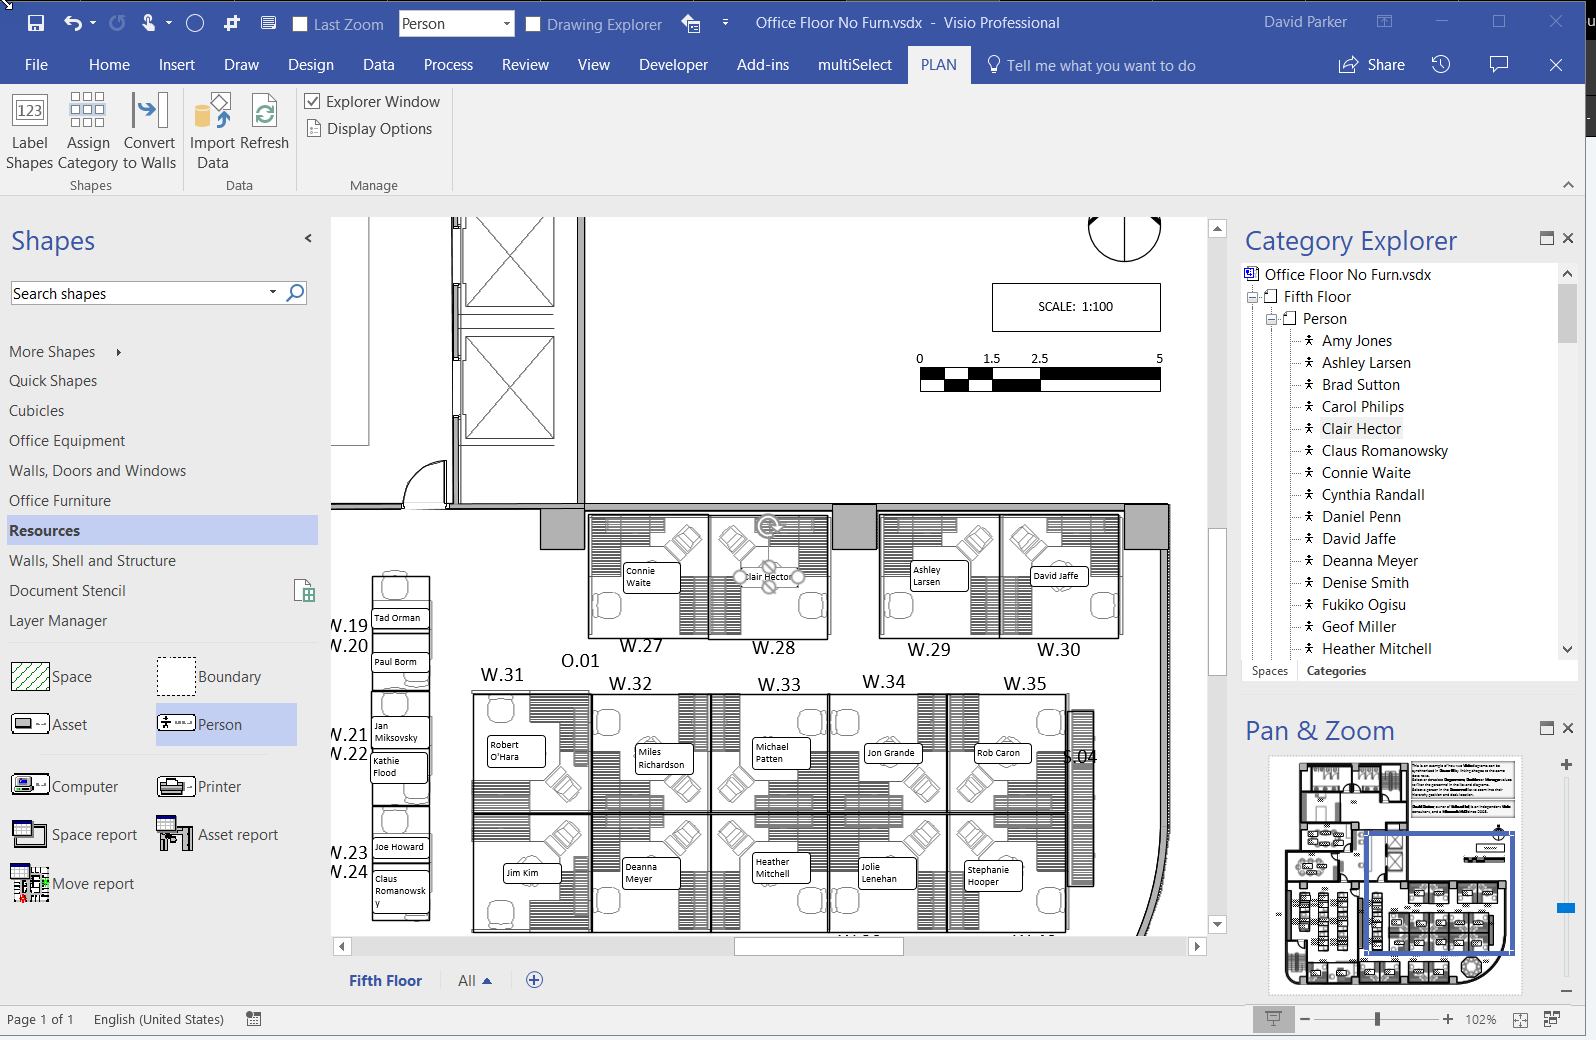
My last article, Aliasing Data Columns for #Visio Organization Chart Wizard , mentioned the slight anomalies in the default Shape Data rows for the Organization Chart shapes and the Resources / Person shape. This prompted me to create an alternative view of the same data that can be linked to the Person shapes on a floor plan, and then to use the preview Visio Custom Visual in Power BI to display both views of personnel synchronised by the same data. This demonstrates how easy it is to create an effective dashboard for locating personnel locations and their position within an organisational hierarchy at the same time!
bVisual Blog by David Parker
Dropping and Connecting Linked Data Shapes in Visio
I like linking data to shapes in Visio. It saves time in filling in Shape Data and adding text, or any Data Graphic to them. Basically I am lazy, and I also like to create macros for repetitive tasks, so in this blog I provide two macros to save the drudgery of two tasks I do so often:
- Dropping and data linking a number of items from an External Data recordset filtered by values in a column or columns
- Connecting shapes together following a parent-child relationship between Shape Data values
Selecting Nodes in Visio PivotDiagrams
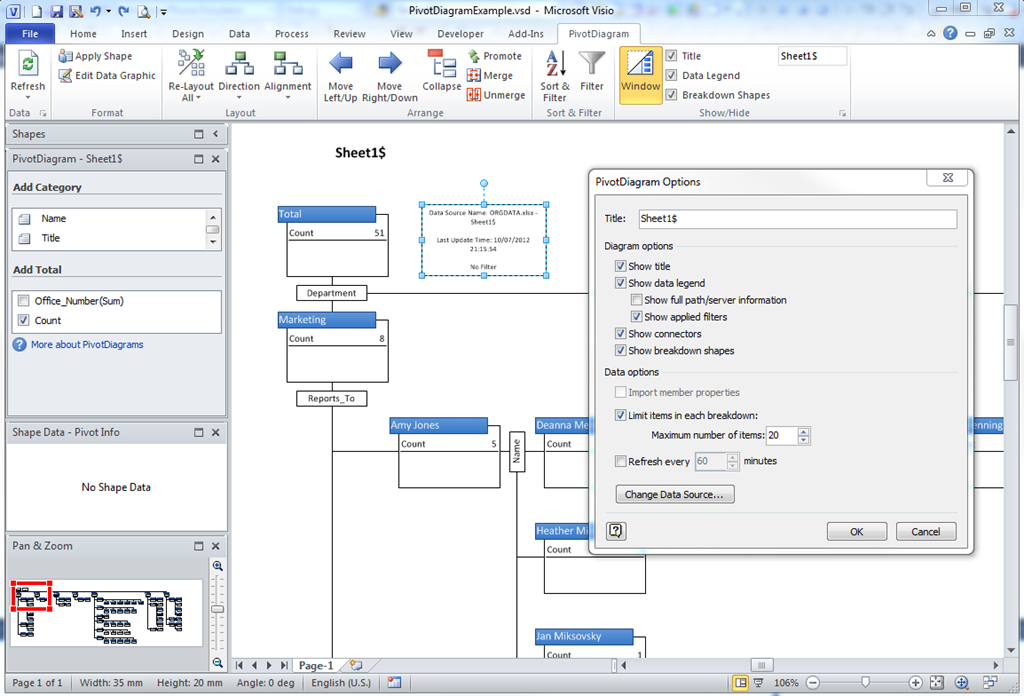
Microsoft Visio 2007 introduced PivotDiagrams to Visio Professional, and continues unchanged in Visio 2010 (see http://office.microsoft.com/en-us/visio-help/create-a-pivotdiagram-HA010357089.aspx ). These diagrams are a great way to analyse and visualize data by allowing you to breakdown data in a similar manner to PivotTables and PivotCharts in Excel. Any one who has both Microsoft Project and Visio installed will have seen that all of the extra diagram reports are in fact Visio PivotDiagrams. However, I have always found that selecting the nodes you want is difficult. In this article I will explain the problem and provide a solution … a new free add-in called PdSelect.
Update : Added new features 20 Jul 2012
In the following example PivotDiagram, I used the built-in OrgData Excel workbook as the data source. This example workbook is normally used to demonstrate the OrgChart Wizard, but I have used it to provide an alternative breakdown by Department / Reports_To / Name.
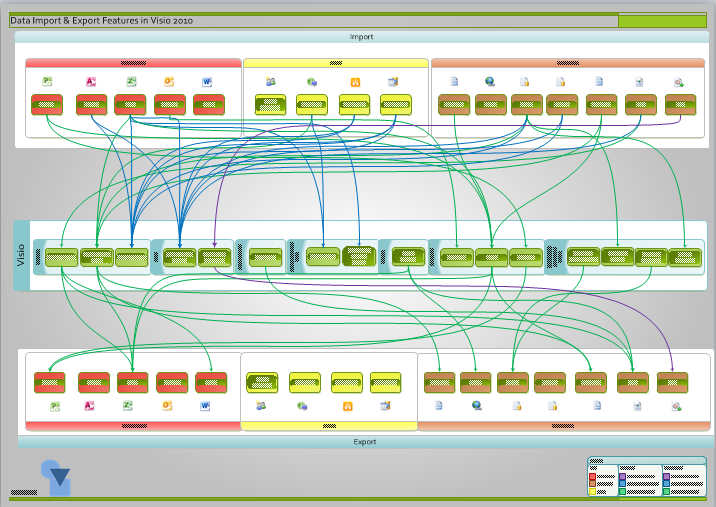
Data Import & Export Features in Visio 2010
I have been using (Microsoft) Visio for importing and exporting data since 1996, and was an early tester/adopter of the Database Wizard features in Visio 4.1 (I think). I think of Visio as a data visualization tool, yet I cannot recall seeing a comprehensive list of the areas in Visio, out-of-the-box, where you can import and export data easily. So I decided to draw a data-linked diagram of just this for Visio 2010.
I have made the files available for you at the following links:
Arrays in Shapes
I was recently asked by my good friend John Marshall, the longest serving Visio MVP (see http://visio.mvps.org/ ), if I had any examples of using arrays in shapes, rather than having scores of Shape Data rows. Indeed, I have used arrays in many shapes, and used the LOOKUP() and INDEX() ShapeSheet functions to extract discreet values, but I thought I would enhance an existing shape, the Pie chart master on the Charting shapes stencil to demonstrate a technique.
In this post, the screenshots are from Visio 2010, and I have used the Link Data to Shapes feature that was introduced in Visio 2007, but a similar effect can be done using the Database Wizard which has been part of Visio since version 4.1 back in 1997.
I started a new Business Charts and Graphs diagram, and dragged a dropped a Pie chart master on to the page. This shape allows for the user to enter values for 1 to 10 pie slices by use of the right mouse menu.
