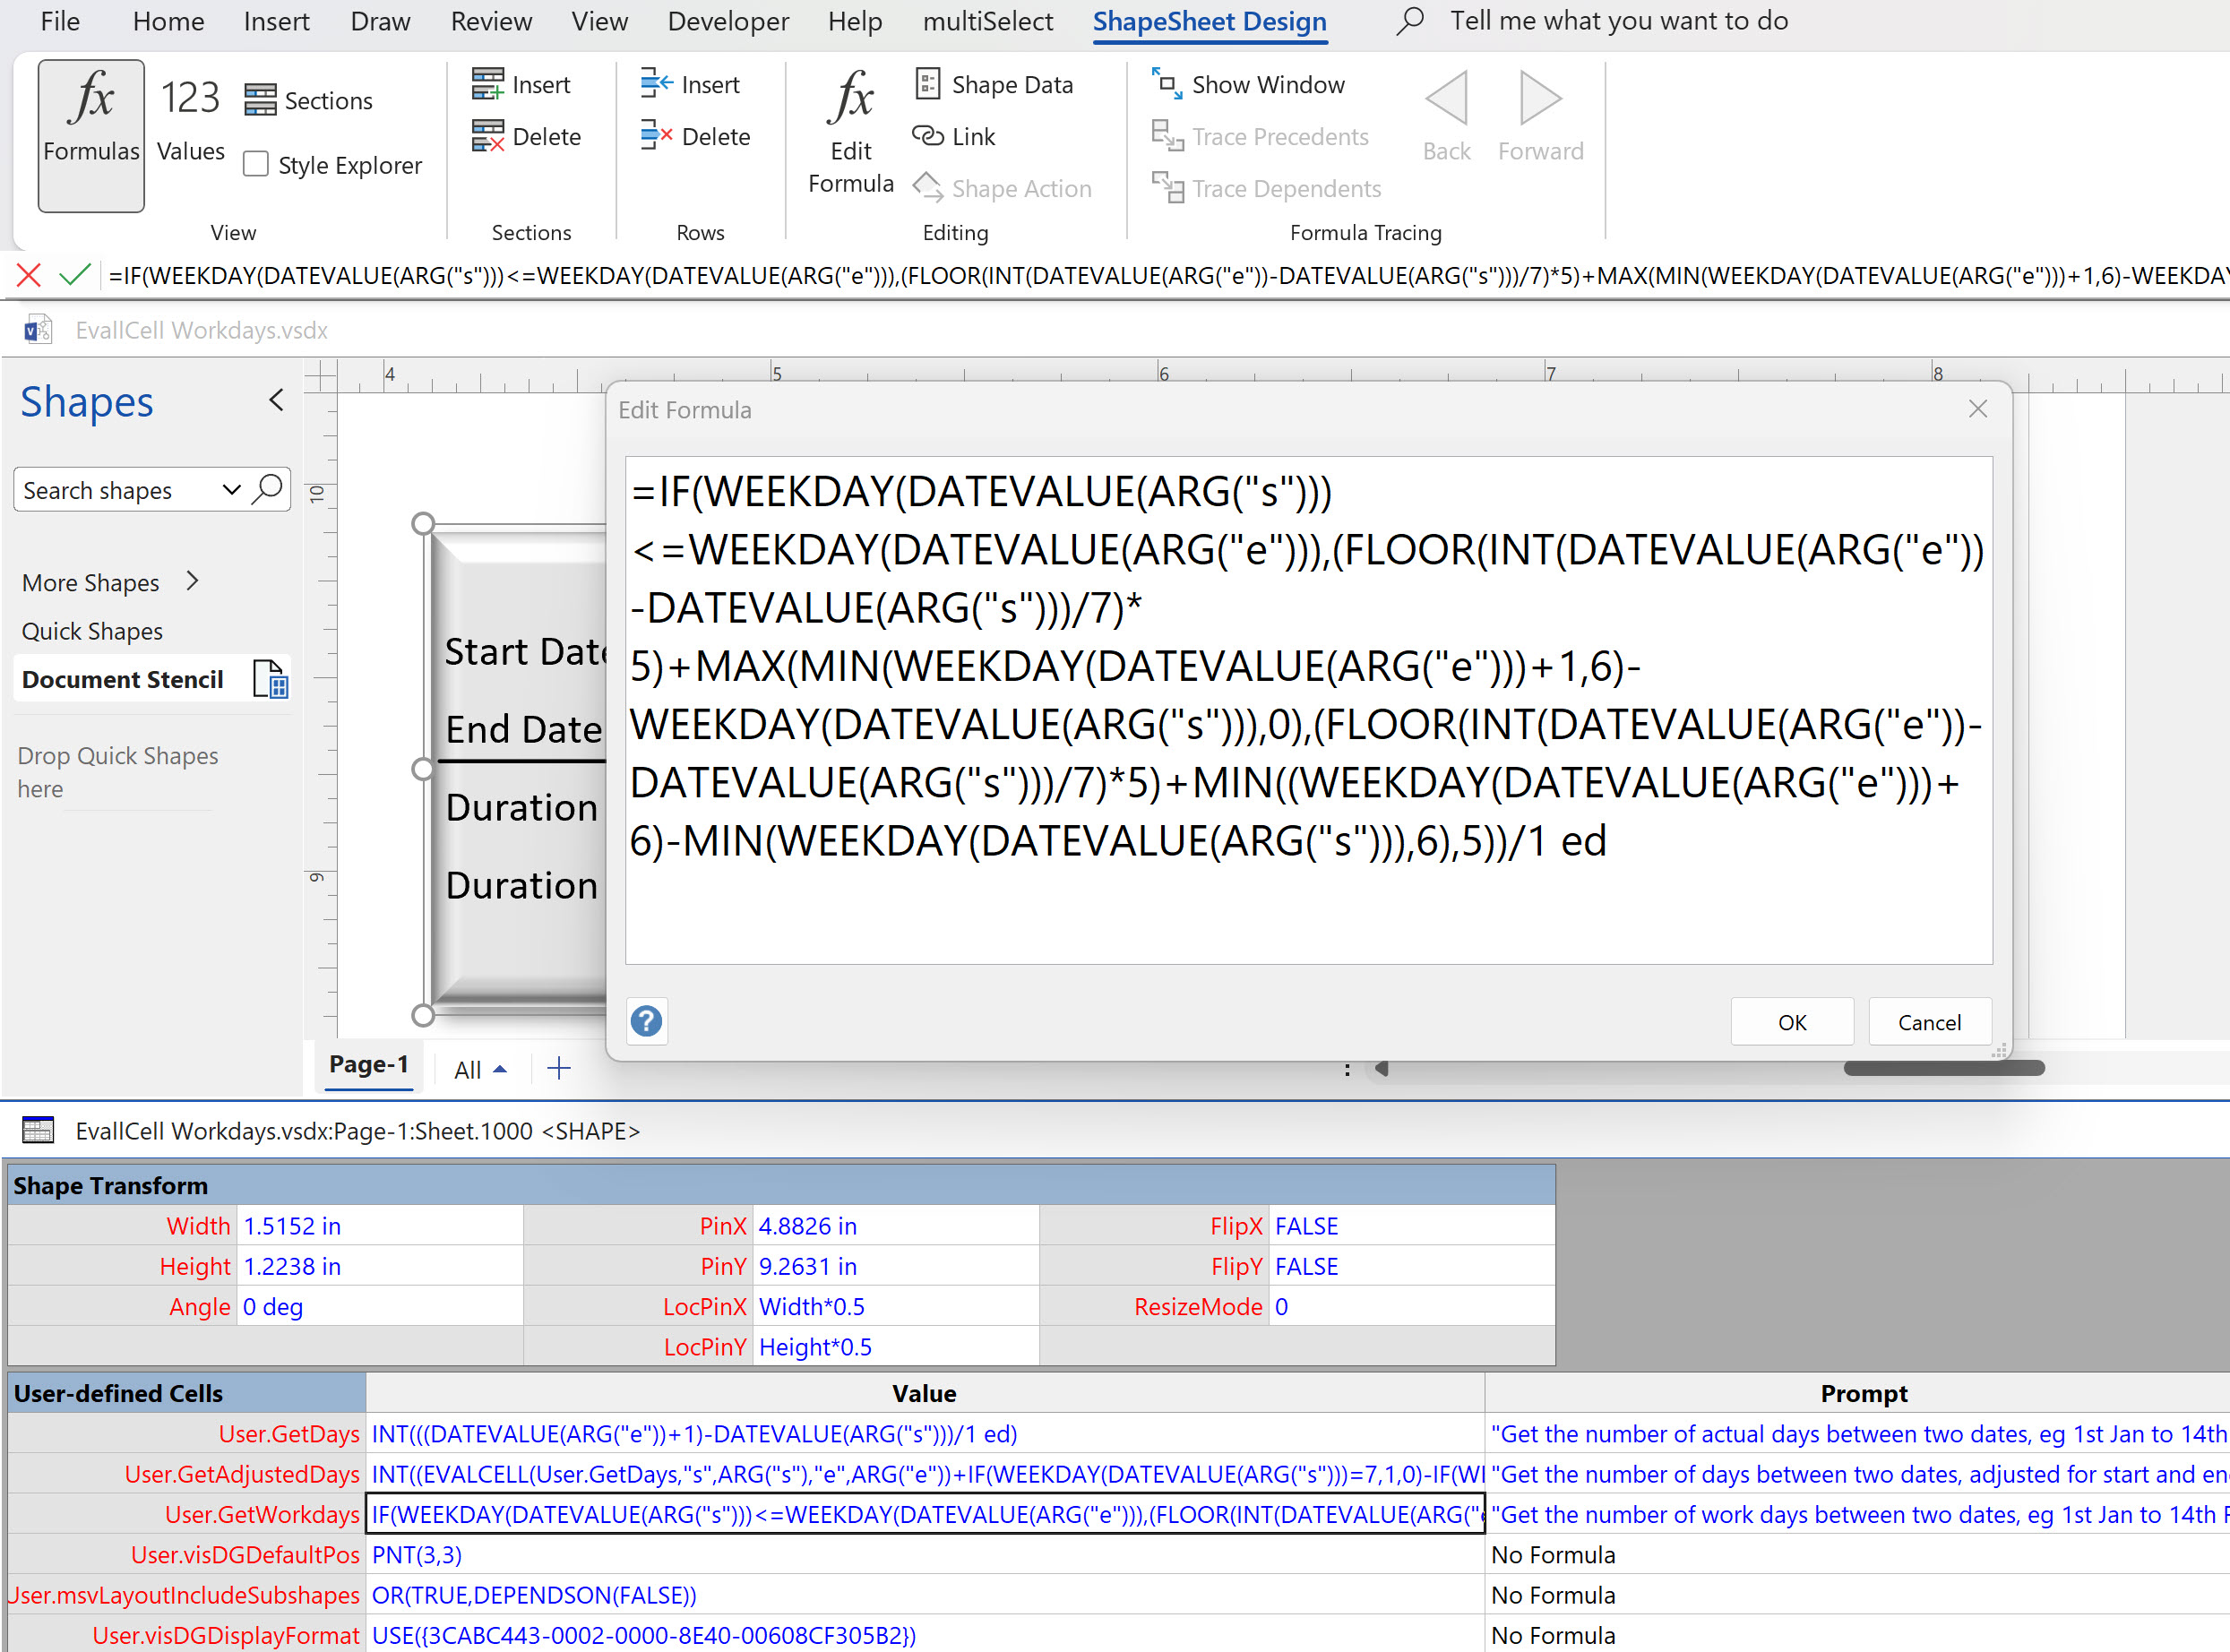
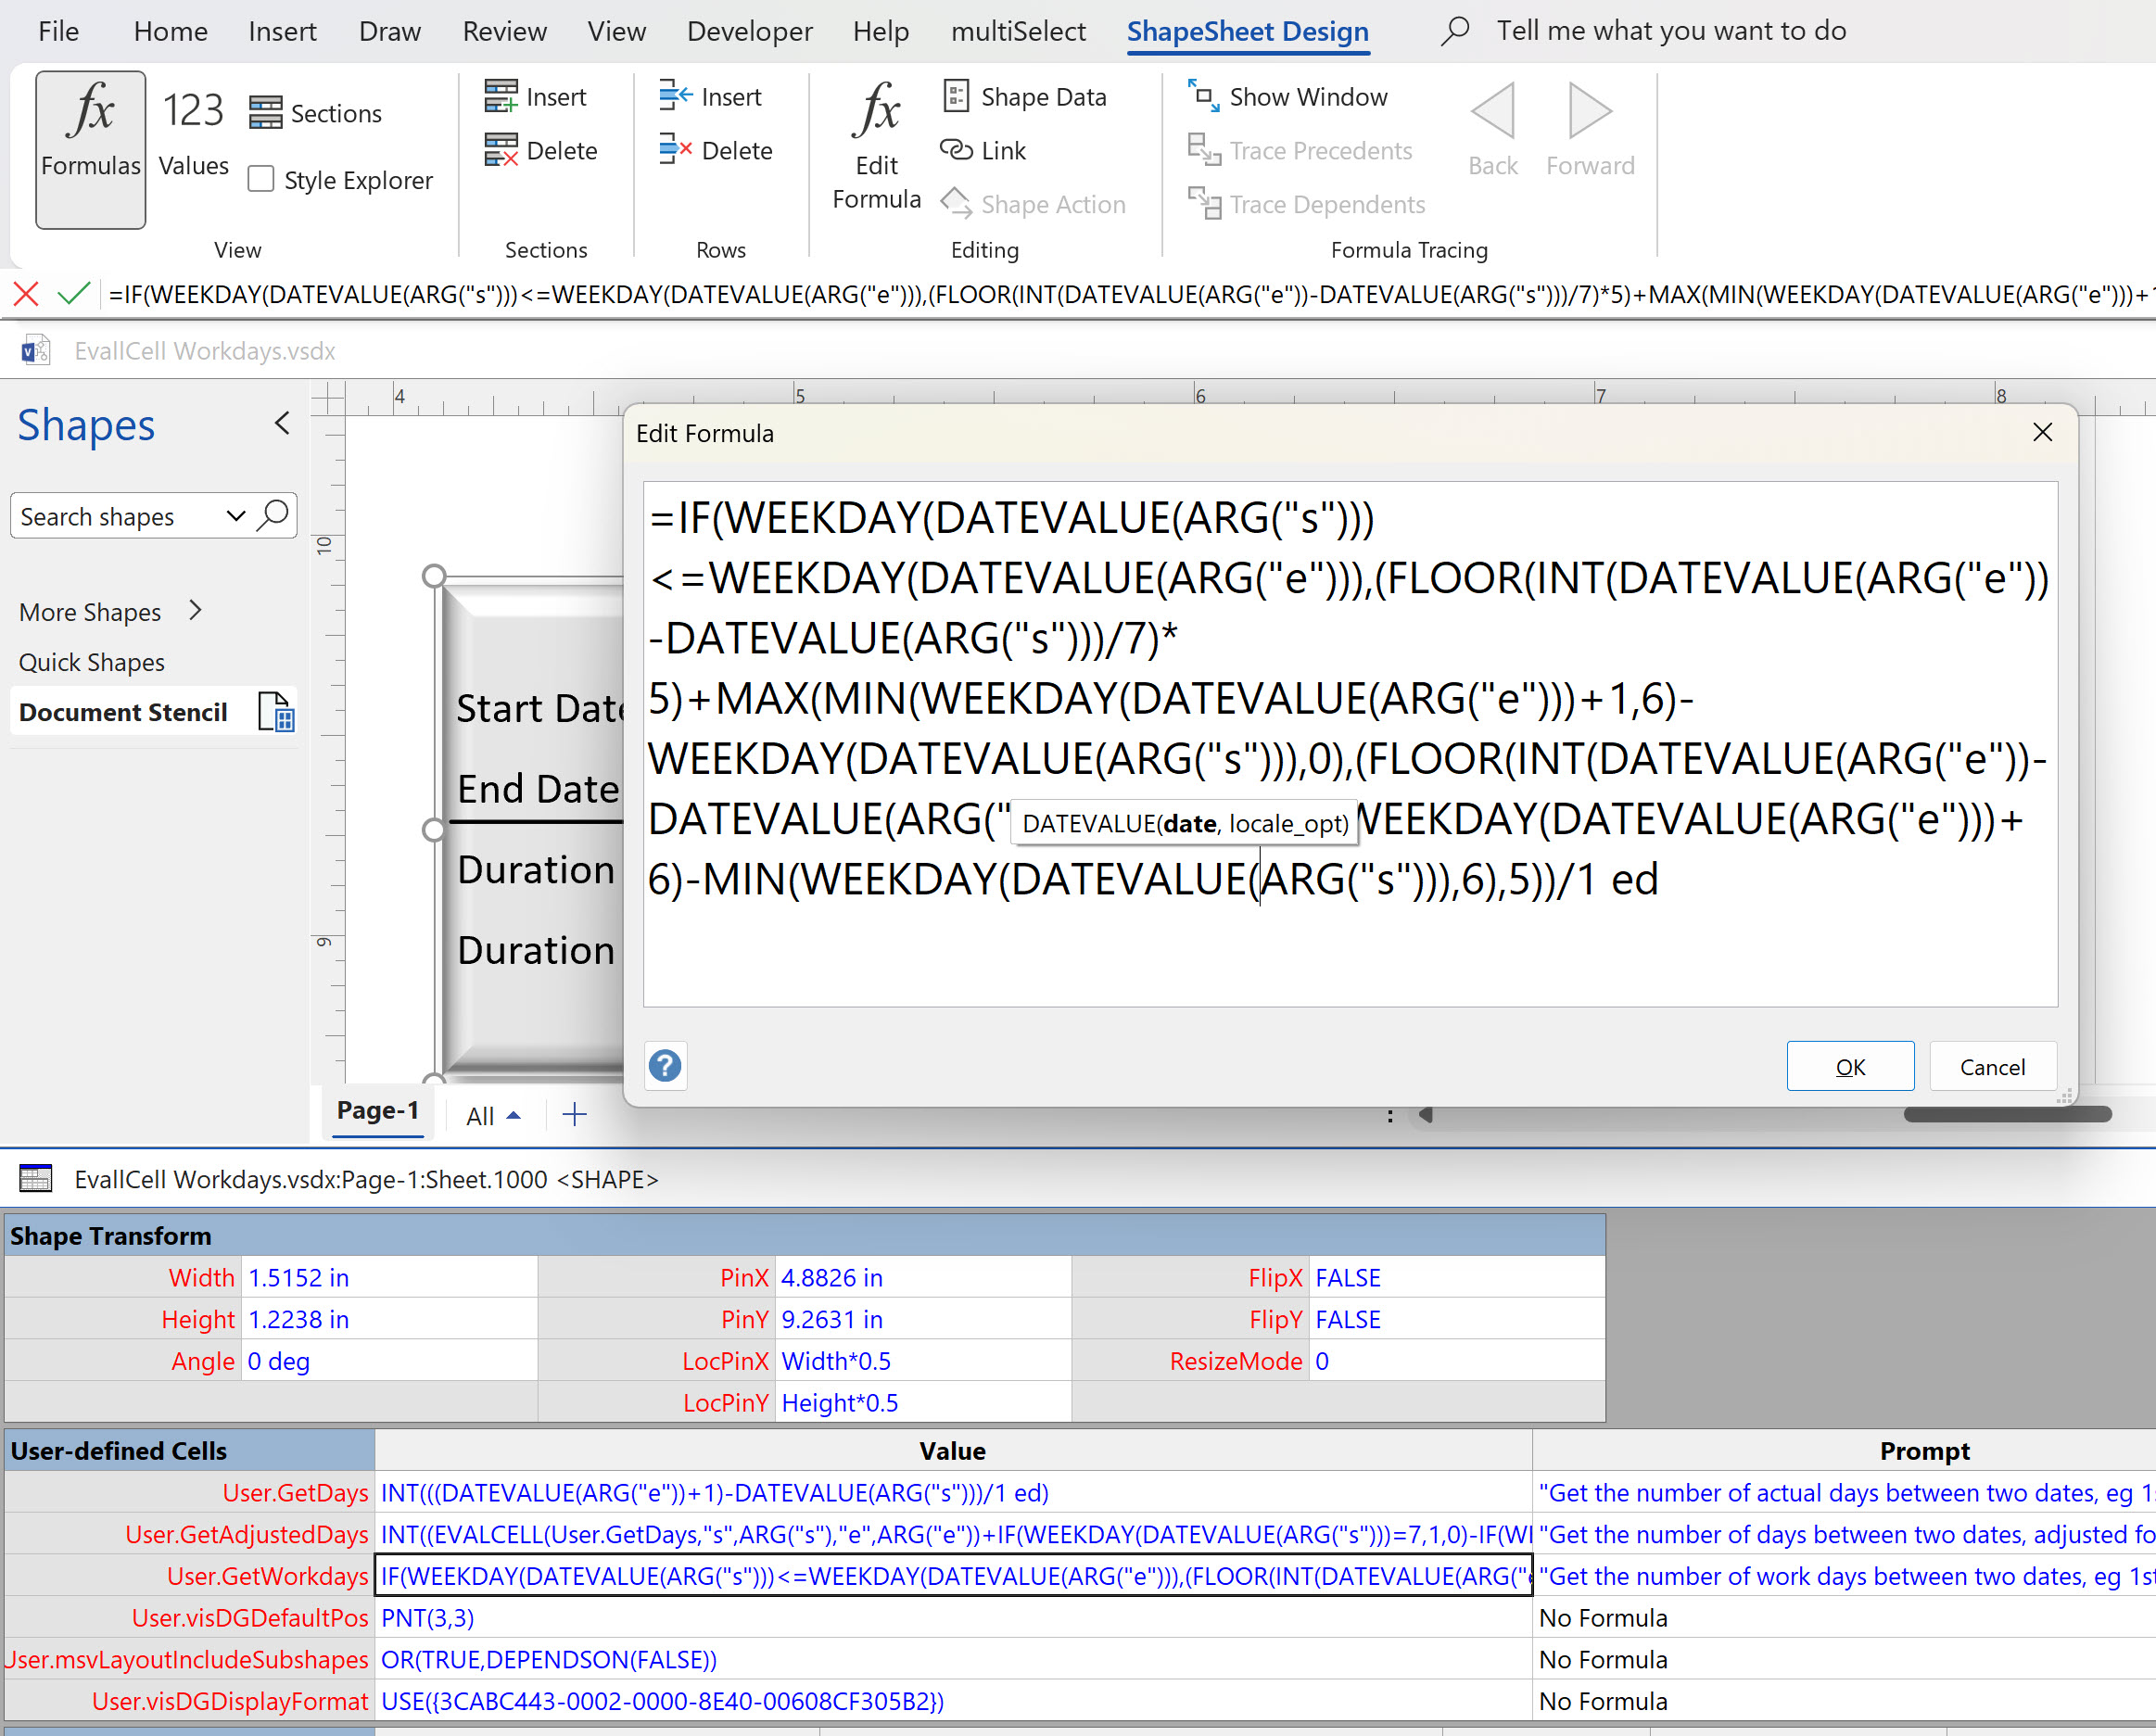
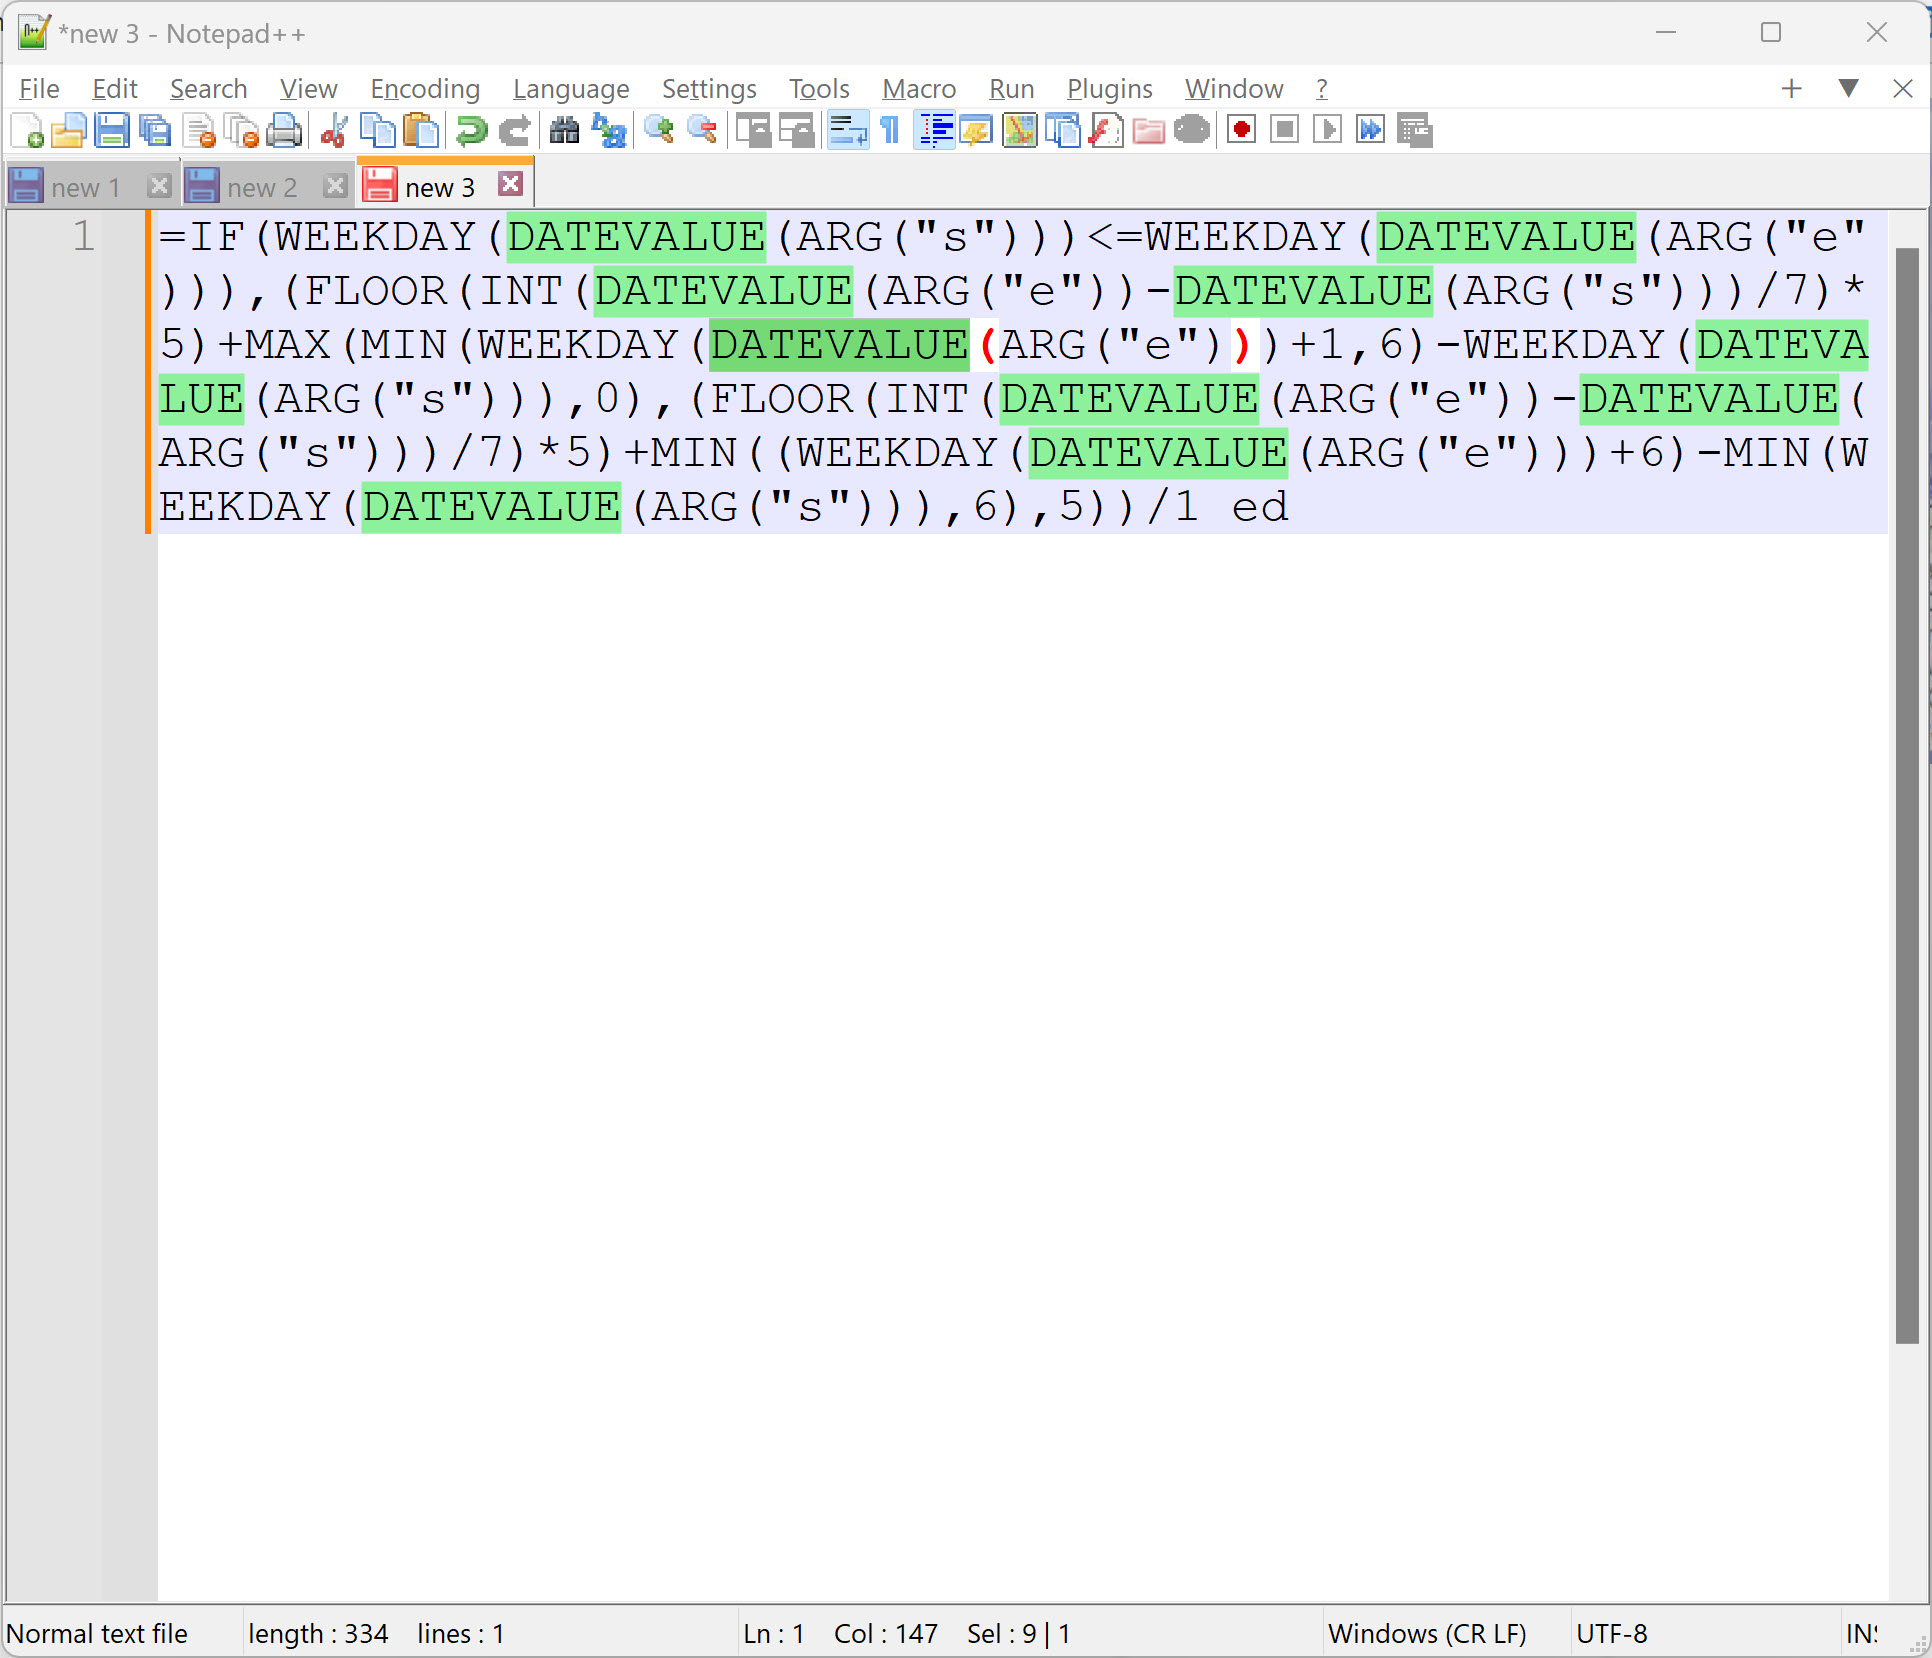
My last article looked at parsing an XML string with a known structure and order of elements and attributes. This can be acceptable in some scenarios, but what if the elements or attributes are in a different order? Then it is necessary to use the element and attribute names rather than their index position. This requires a little more complexity to the ShapeSheet functions, and this can result in longer processing time, so needs to be used cautiously, but it is possible, as I demonstrate in this article.
[Read more…] about More Parsing XML Data in Visio ShapesVisio
Navigate to named areas in Visio with SS Plus
Many years ago, when I was an architect, I used a Unix CAD system with large buildings. I was able to navigate quickly to rectangular areas that I had named. Well, the Export to PowerPoint feature in Visio Plan 2 provides Slide Snippets, which are named areas that can be exported to PowerPoint. My SS Plus add-in already provides enhancements to this feature that provides formatted text and hyperlinks to be exported too, but I was missing a trick. So, now I have added in a dynamic sub-menu that provides quick navigation to these named Slide Snippet areas and can optionally integrate with LayerManager to apply a named LayerSet too!
I have made a short video to demonstrate this:
[Read more…] about Navigate to named areas in Visio with SS PlusCounting glued and connected shapes in Visio
I got a surprise in one of my projects when I counted the shapes glued together using the Shape.GluedShapes(…) method … the sum of the filtered glued shapes just didn’t add up to the unfiltered count. So, I thought I should check the Shape.ConnectedShapes(…) method too … and there is a scenario where that has a similar result.
In the following diagram, I have different coloured squares with connection points of different types at the centre of each edge (as denoted by the connection type numbers), and one under a control point in the bottom left corner. I have glued the ends of coloured connector lines, statically (Red and Black) and dynamically (Green), and glued the Purple Square directly to the Orange Square. The Blue Square shape is glued to a connection point on the green dynamic connector.
I then ran some code to get the count of glued and connected shapes … and noticed some apparent discrepancies…
[Read more…] about Counting glued and connected shapes in VisioMy new book on Visualizing Processes with Microsoft Visio has launched
Back in the early 1990s, there was an application called ABC Flowcharter that was the market leader for diagramming business flowcharts, but some of the brains behind Aldus PageMaker saw an opportunity to create something smarter, and left to write the Visio product, with the stated aim to overtake ABC Flowcharter within 2 years. They did it in just 18 months and Visio expanded to cover more types of diagramming, especially organization charts and network diagramming. Visio became the default vector-based, data-diagramming application for the desktop, and so Microsoft acquired the company in 2000, who started to integrate it with Microsoft Office applications. Many imitators on the desktop tried to emulate Visio, but most fell by the wayside. There were constant requests for Visio to work on Apple Macs, but Microsoft resisted making a Mac specific version, and instead started to make Visio work in a web-browser, so it can work anywhere on any modern device. There are literally millions of lines of code on Visio, so it was never going to be straightforward or easy, but now we do have a light edition of Visio provided to all M365 business subscribers, and two extra subscription levels for more features and capabilities. We still have desktop Visio Standard and Professional, but the edition that straddles both the desktop and web is Visio Plan 2. It has some desktop only features delivered via web-services, and an enhanced browser-based editing experience. Visio Plan 2 is the edition for heavy or advanced users, but any of the desktop editions can be viewed as a design studio for content that can be used by the browser users because of Visio’s unique ShapeSheet feature that contains Excel-like formulas to control the properties of the shapes. Almost all of these formulas work in the web browser, but desktop Visio is required to write the formulas initially. This means that powerful customizations are possible without any web-scripting, and achievable by anyone who can write formulas in Excel!
So, this new book focuses on the original driver for Visio, process flowcharts, and explains how the different Visio editions can be used to create, edit, collaborate, comment, present, automate, export them, and finally how to customize them. Find out more at Visualize Complex Processes with Microsoft Visio!
[Read more…] about My new book on Visualizing Processes with Microsoft Visio has launchedLayer Set menu options and calls from code added to LayerManager
LayerManager for Microsoft Visio layer sets can now be called from external code and are also available from a sub-menu of the Layer Buttons drop-down ribbon button. The Layer Manager window does not need to be open to use the sub-menu because it detects the Layer Set buttons on the page.
[Read more…] about Layer Set menu options and calls from code added to LayerManagerInteractive Demographics of the European Union in Visio
I was recently contacted by a reader, Stanley M. Max (Towson University lecturer), who had started creating a Visio map of the 27 countries in the European Union in 2020, along with the demographics culled from Wikipedia. He wanted to know if the map and stats could be combined to make a more appealing presentation. Well, that prompted me to not only combine the data and country shapes, but to explore ways in which a presentation of the map can be made more interesting in Visio. So, I added data and hyperlinks to the shapes, and set up a page property for the selected country which automatically highlights the country shape, statistics, and header, to which I added flags. So, the user can either set the page country using the Shape Data window for the page, or context menu of each country, or simply by double-clicking.
[Read more…] about Interactive Demographics of the European Union in Visio