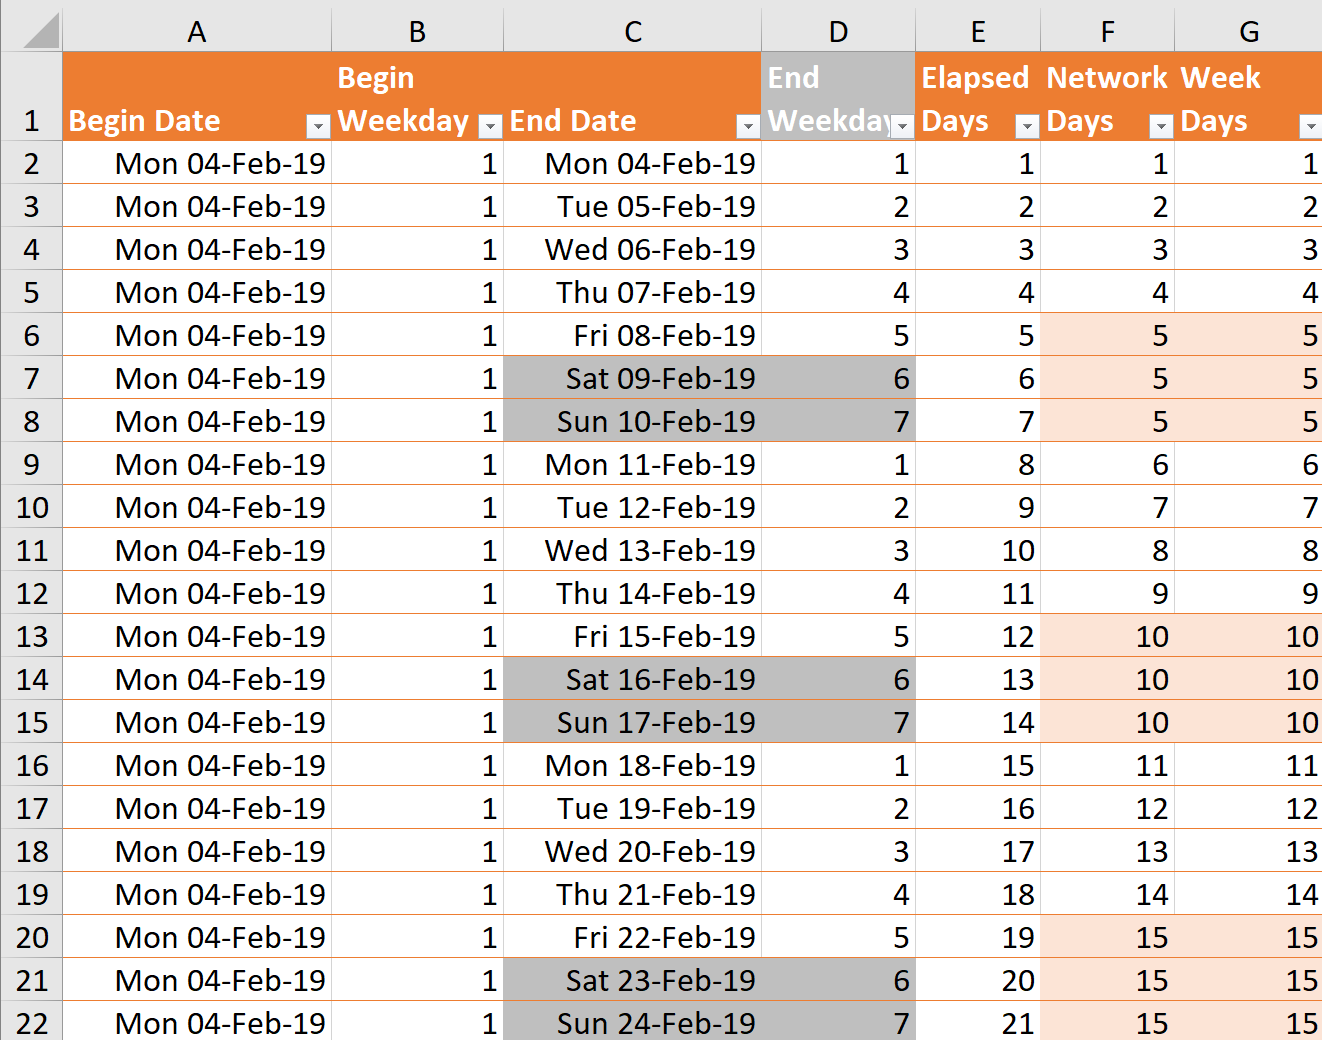
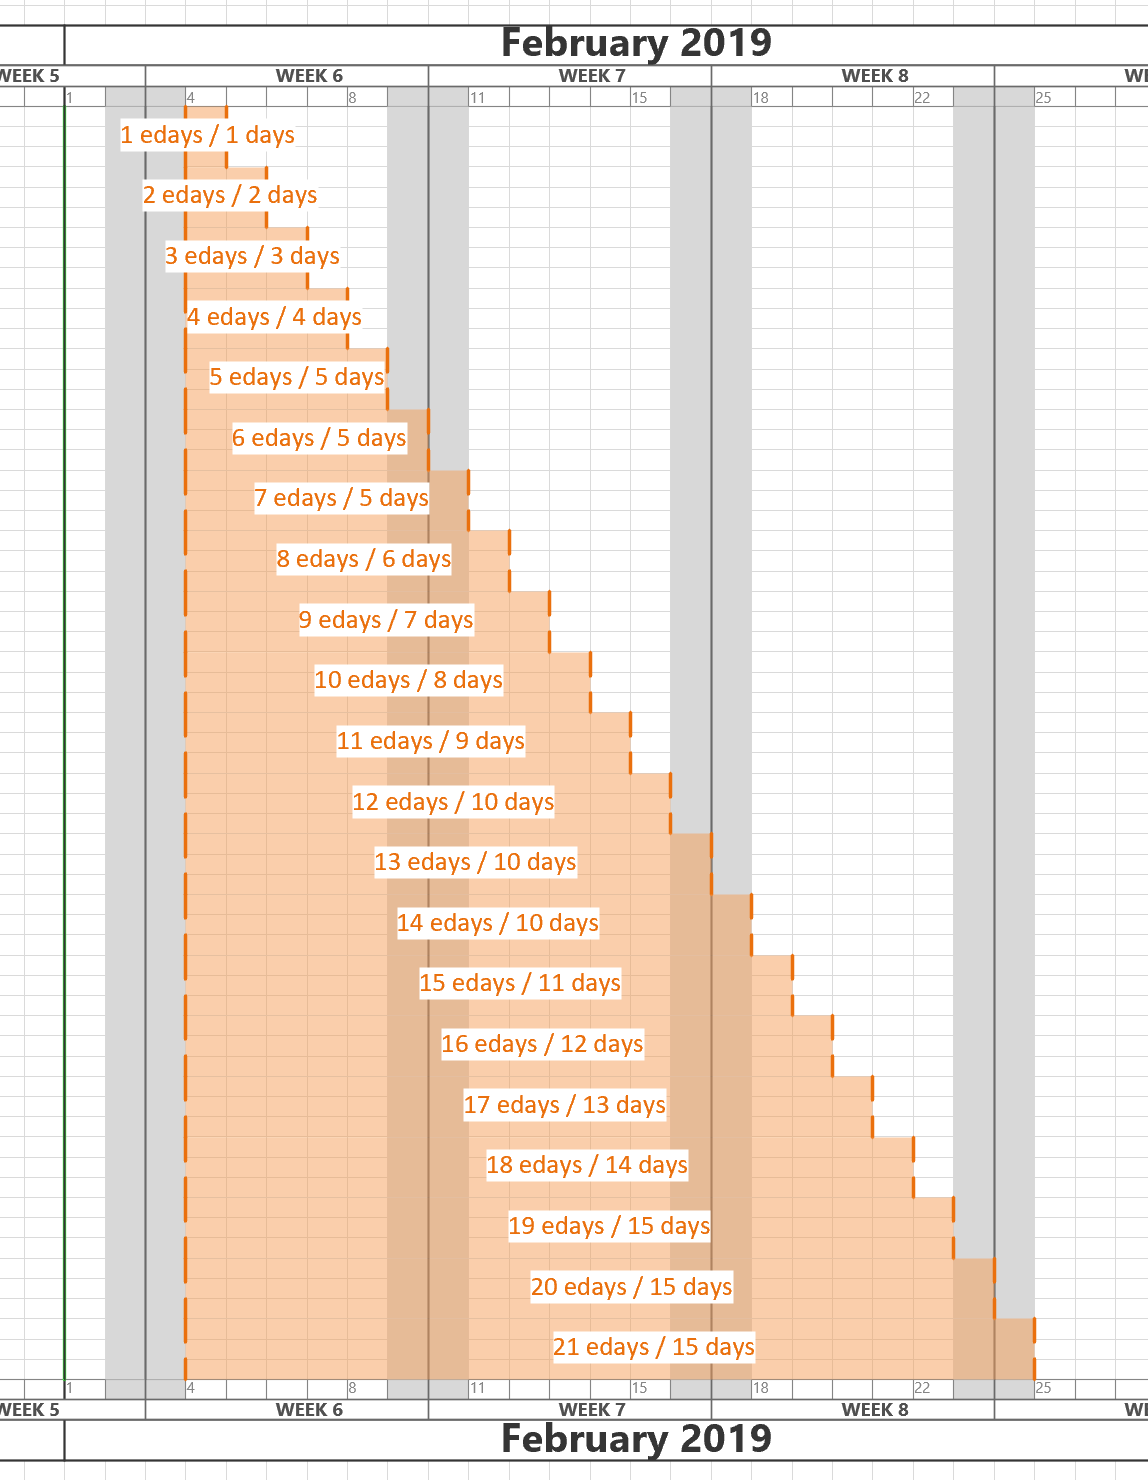
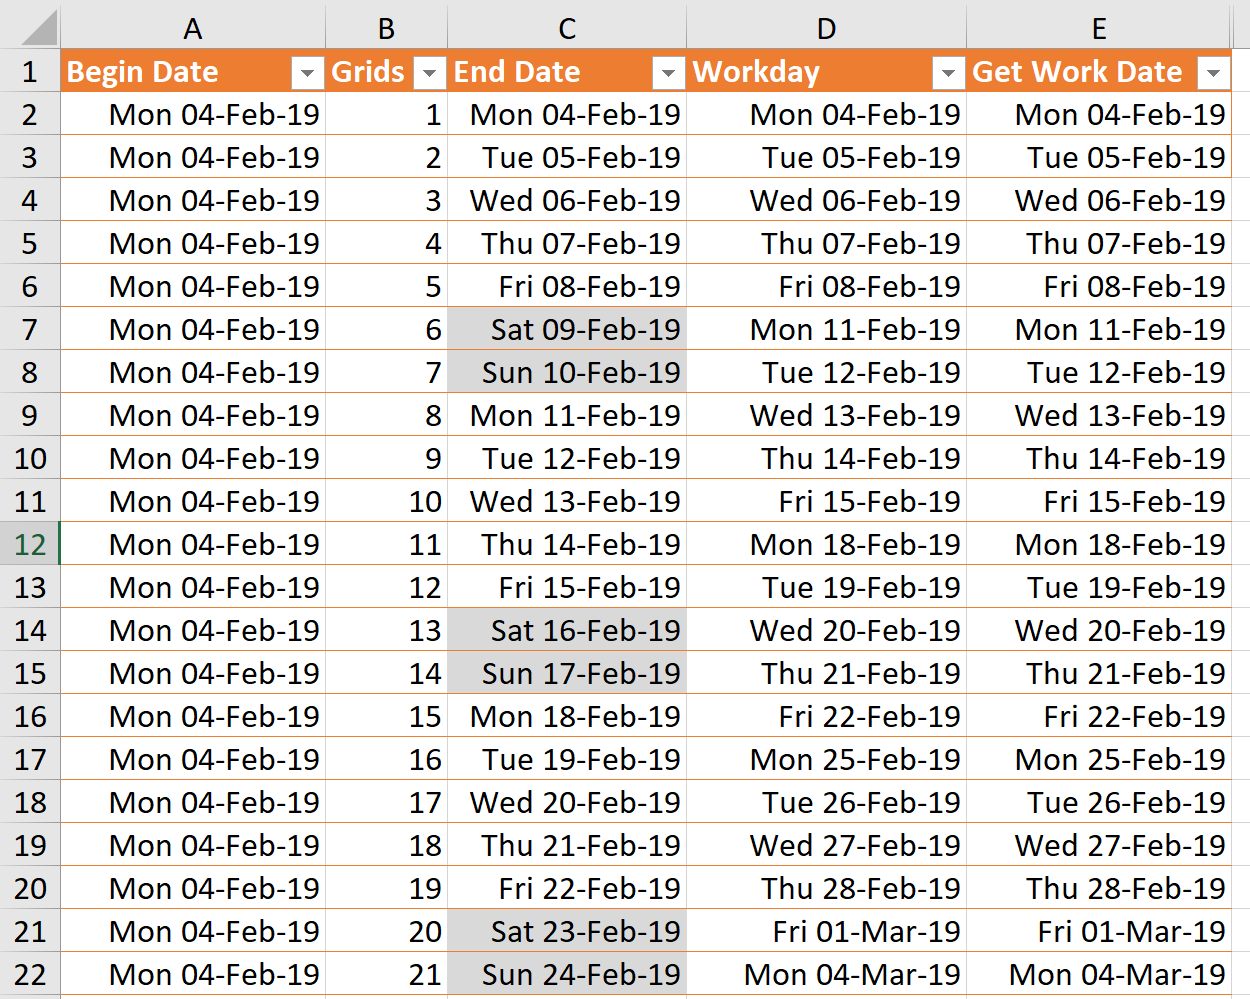
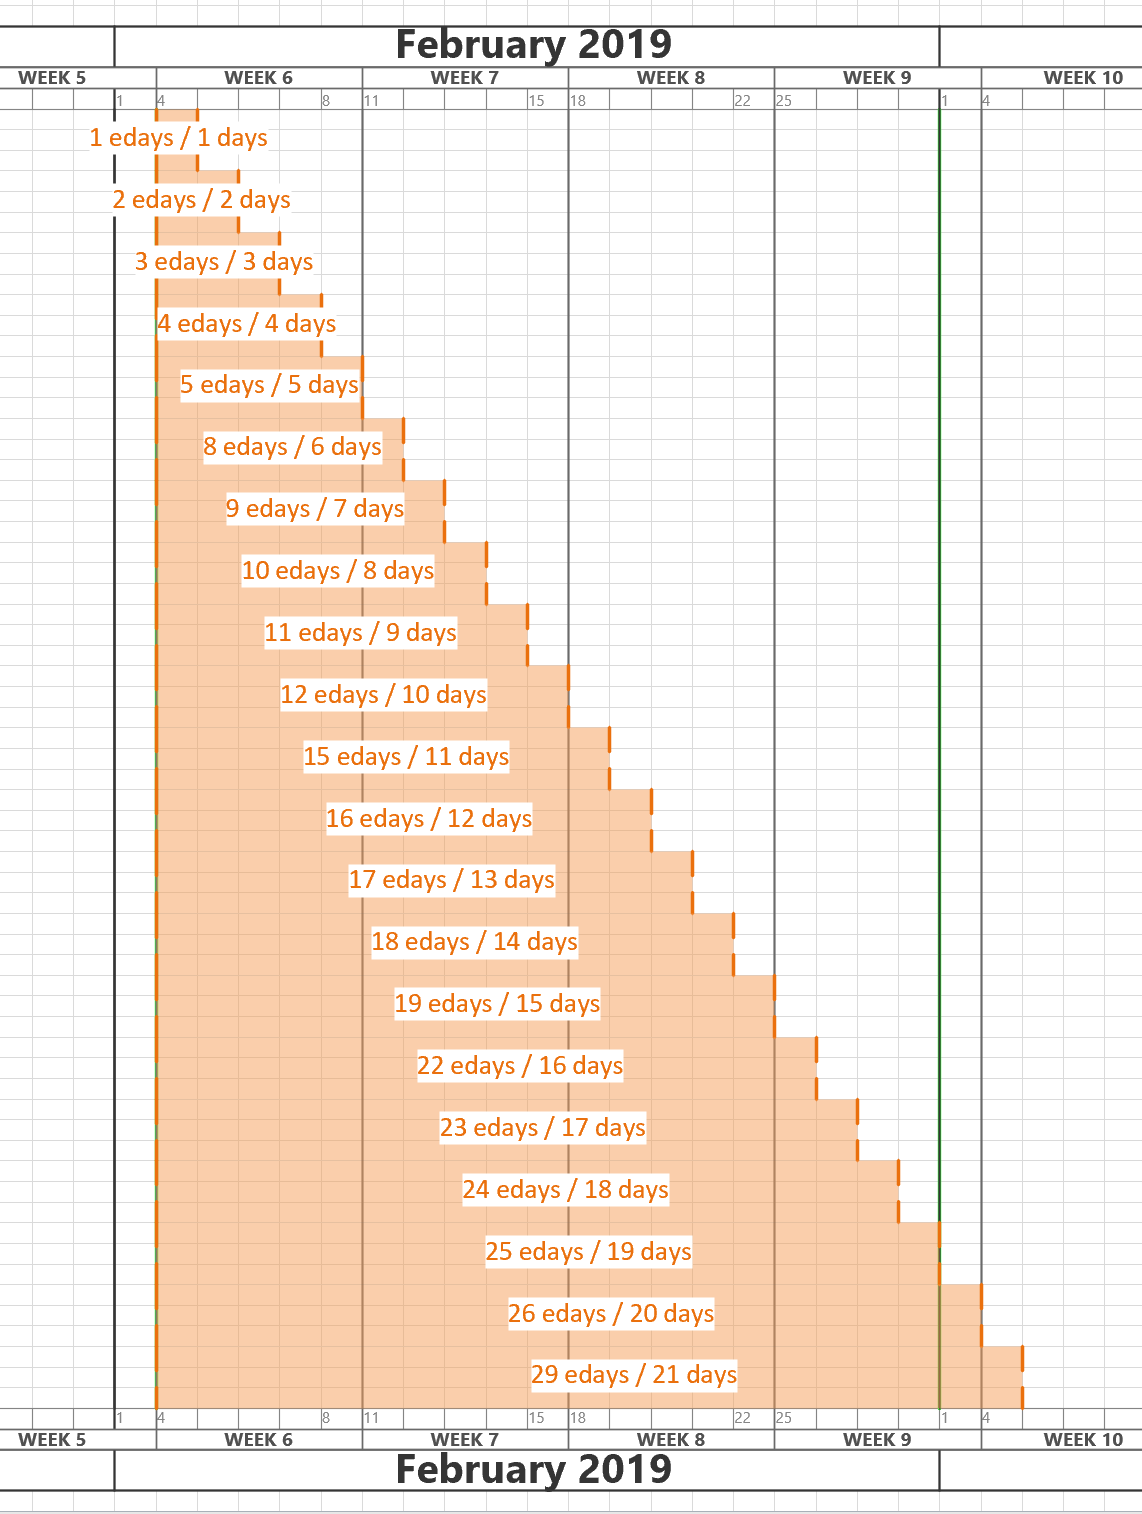
I am working on an application where the horizontal axis of the Visio page represents dates from left to right. In fact, the each of the fixed horizontal grids are 1 day, and I need to have shapes that understand the begin date at the left edge of the shape, and the end date at the right edge of the shape. There is, therefore, a number of elapsed days representing by the width of the shape. However, the underlying grid can either represent all days, or it can be changed to only represent weekdays by omitting the weekends. I struggled to find the best formula to calculate the elapsed days or weekdays between two dates in Visio ShapeSheet formulas, so I turned to Excel to provide an inspiration. The Visio ShapeSheet is modelled on the Excel worksheet, and formulas can be entered into the cells in much the same way. However, the available functions differ since Excel is mainly used for arithmetic and statistics, but Visio is used for graphics and data. In this article, I demonstrate how I used C# and Excel to construct and test formulas for use in a Visio shape.
[Read more…] about Prototyping Visio ShapeSheet Formulas in ExcelExcel
Replacing Images in Visio Shapes by Changing Data
I wrote an article last year about Swapping Images in a #Visio Shape manually, but I want to be able to do this whenever a Shape Data value changes. This is because I use I invariably use shapes linked to data. I also want to be able to have multiple images within a single grouped shape, and all of them changing when their referenced Shape Data values change. I believe that this will be more adaptable for a lot of scenarios than trying to repurpose Data Graphic Icon Sets ( see Make Your Own Visio Data Graphic Icons Sets … automatically). I also discovered that the Shape.ChangePicture(…) function can just as easily work with urls as it can with network file paths, so even more possibilities are opened up! For example, the Visio Online JavaScript API has the ability to overlay an image (see ShapeView.addOverlay(…)).
So, I have created some macros to provide quick and easy selection, positioning and updating of images within a group shape.
I decided to present this article with VBA code rather than my preferred C# so that a stencil could be downloaded to provide instant usability, rather than having to install an add-in. It can be download from Image Utils.vssm, and should then be placed in to My Shapes folder, so that it becomes available to open in Visio. When it is opened, then the macros will need to be enabled.
There are just five public macros:
Visio Roadmap @ MSIgnite 2018
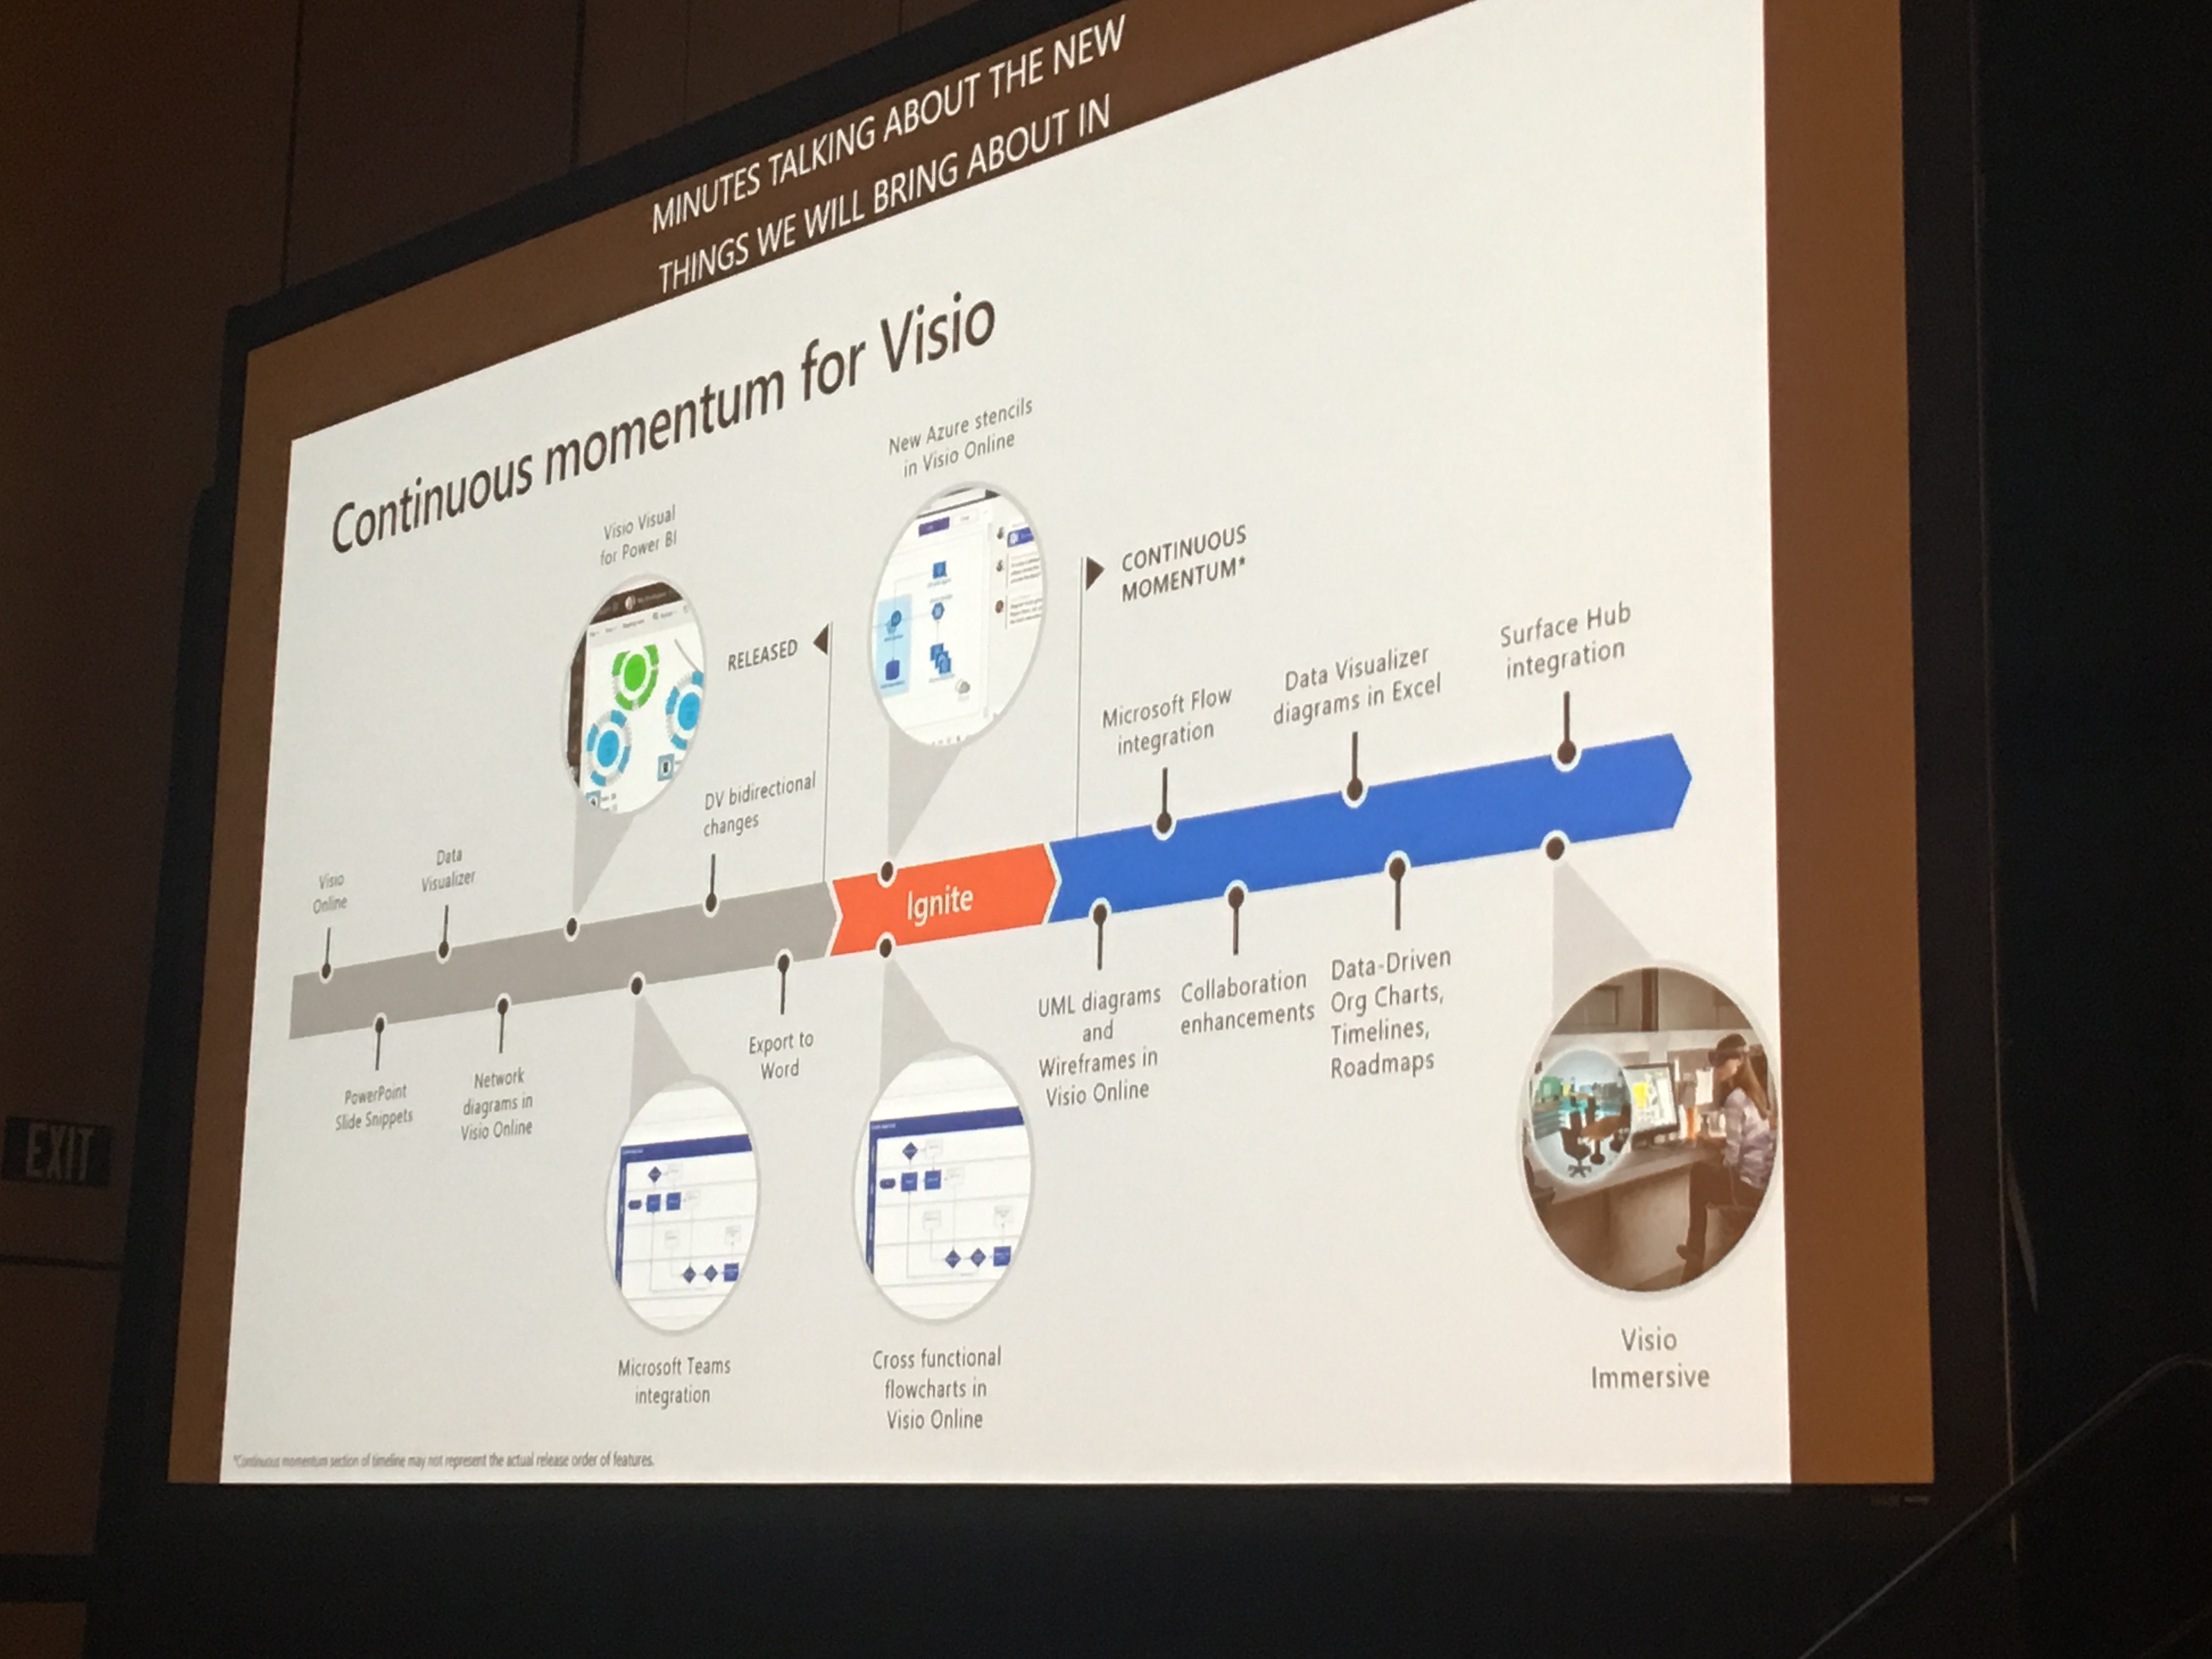
The first slot of the day at the furthest away room from the main conference area is not the ideal time to present anything, but those attendees that made it saw how many new features have been added to Visio recently, and what is soon to be added. The session recording should be available soon, but for those who can’t wait, here is a spoiler! ( View the session here )
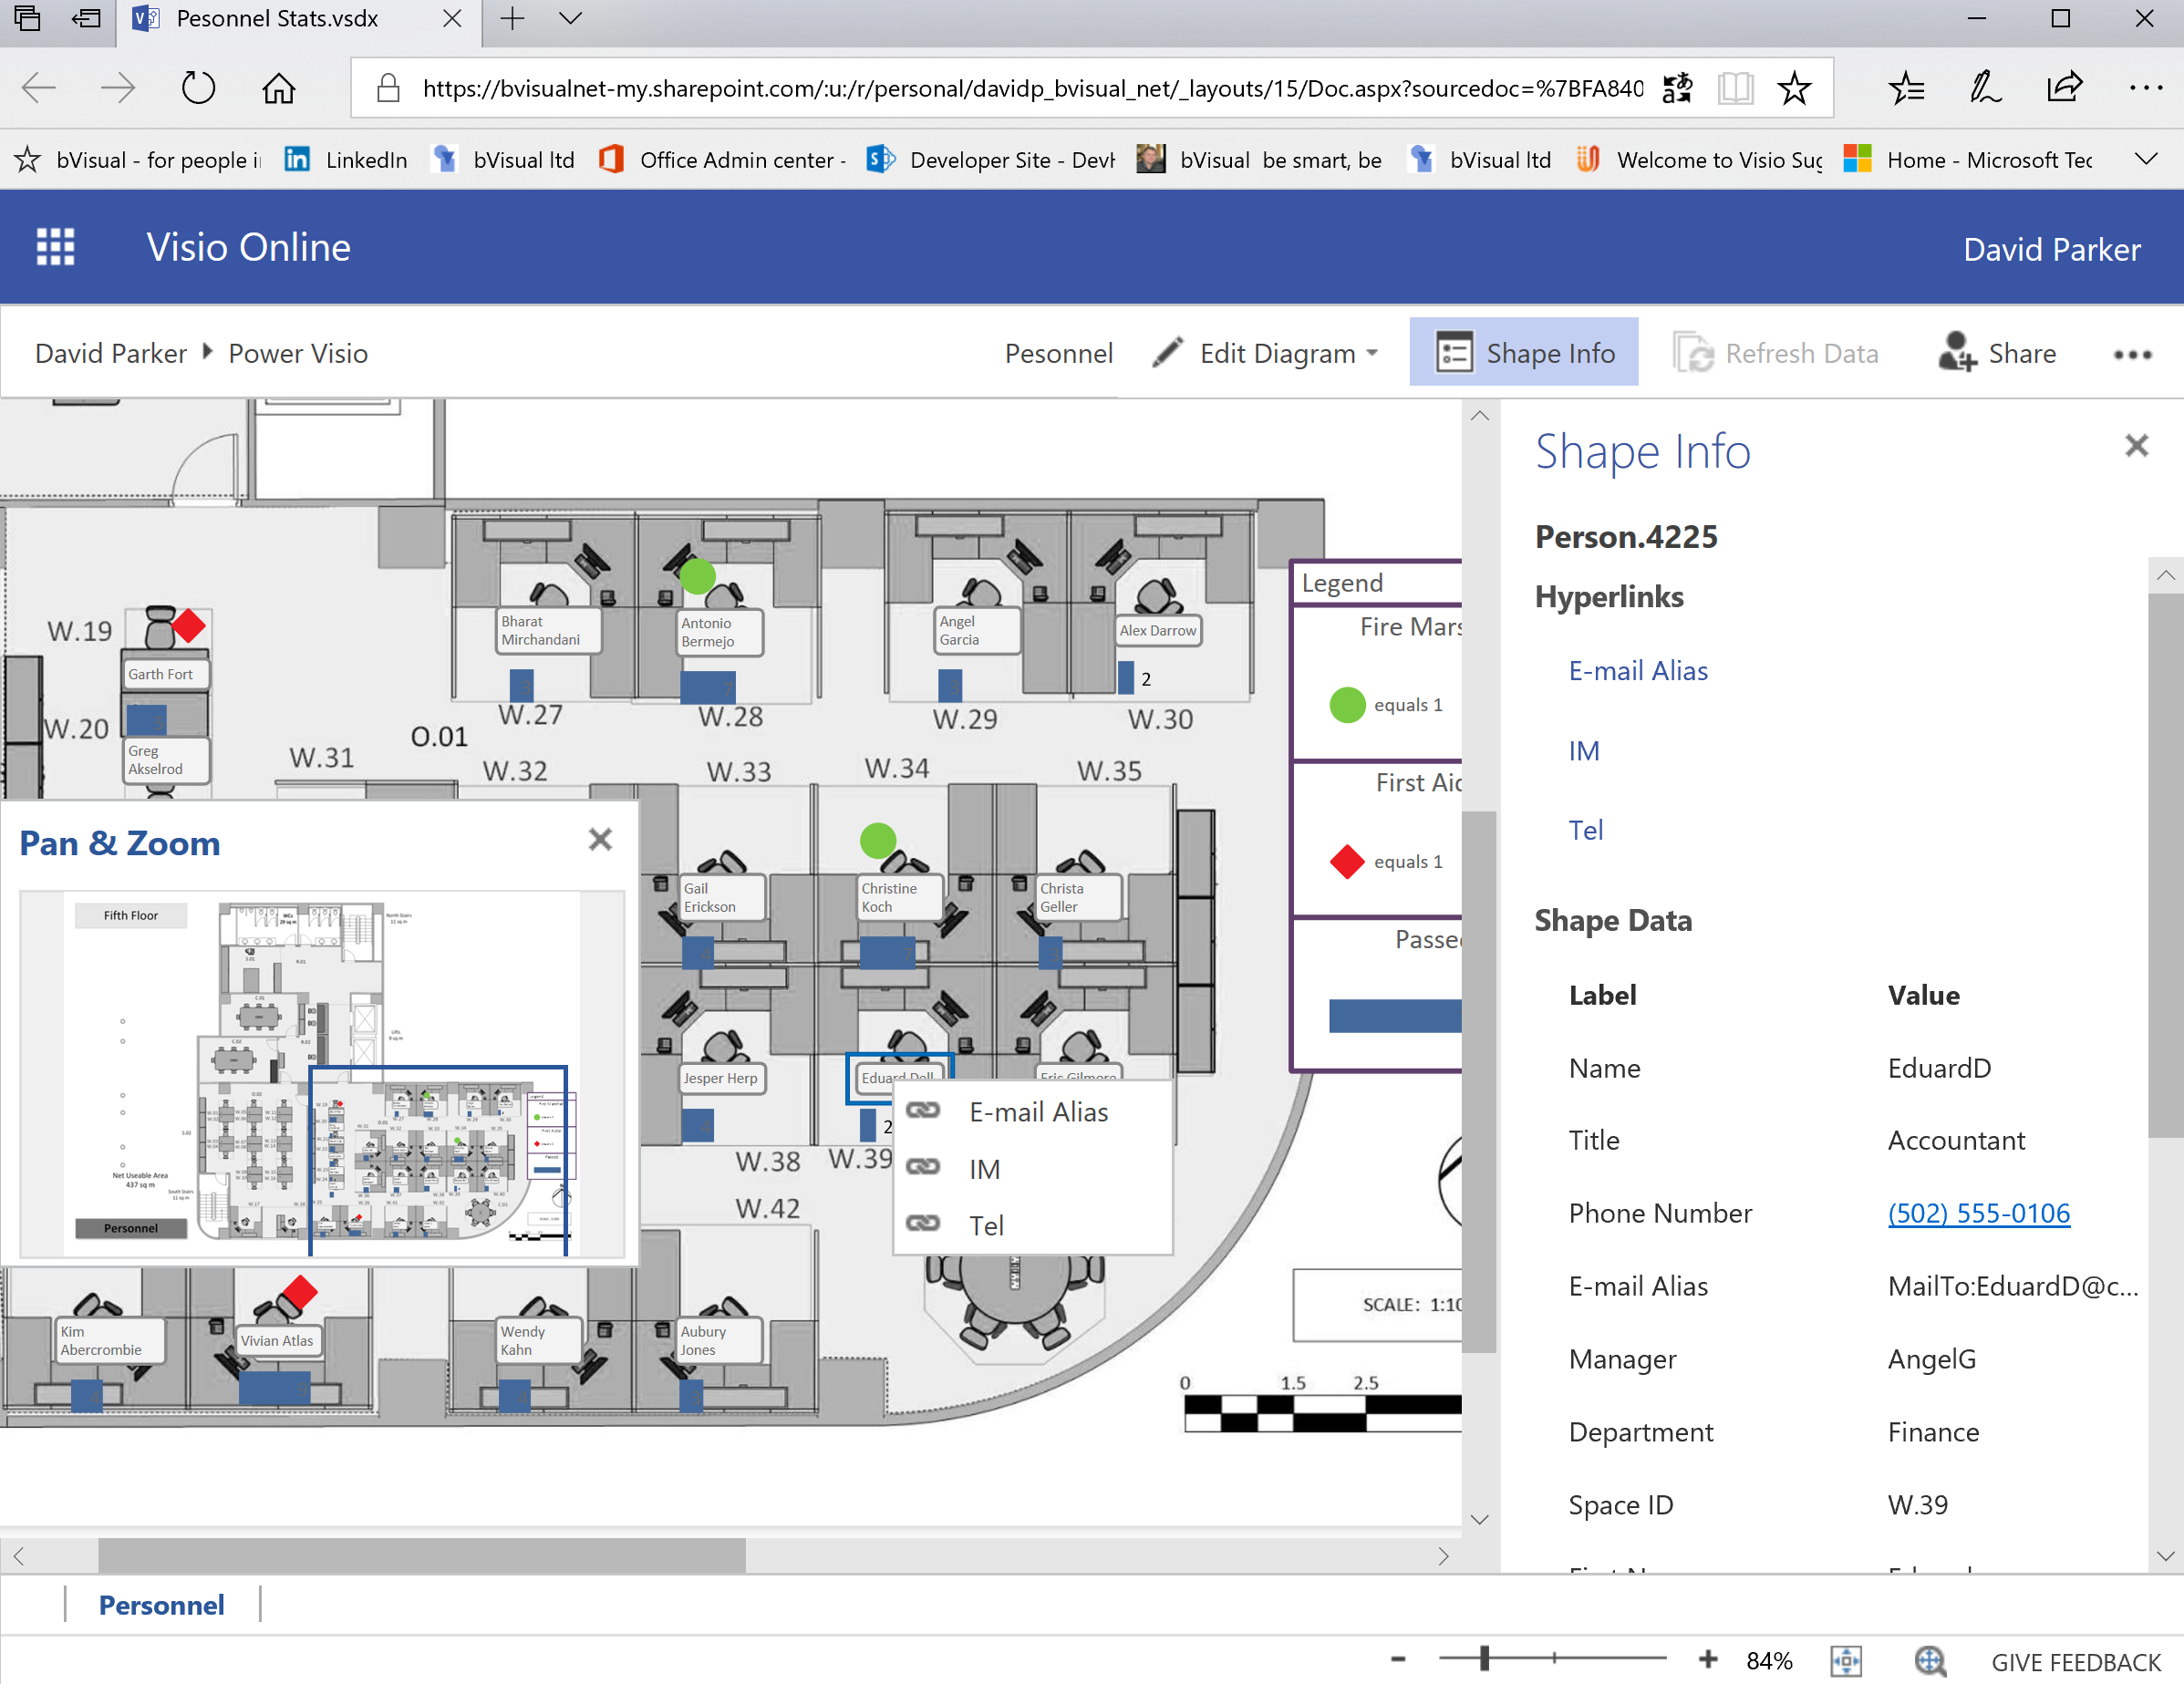
Using SharePoint Links and Hyperlinks in Visio
A current project of mine has caused me to look more closely at the use of links and hyperlinks in “modern” SharePoint Online libraries. Every “modern” SharePoint Online library gets the option to create a new Link in addition to any other content types. They are InternetShortcut files with a .url extension. Only the filename is easily editable once created because the target url is within the file, and no editor is provided. However, it does provide a method to create a repository of approved urls. The alternative approach is to create a column of Hyperlink type, which can be edited easily. This article looks at the implications of each when used in SharePoint Online and used within an external data recordset in Visio, with the intention of providing shapes with hyperlinks.
The video above shows how a Link is created in SharePoint Online, whilst the video below shows how a Hyperlink can be created (and edited).
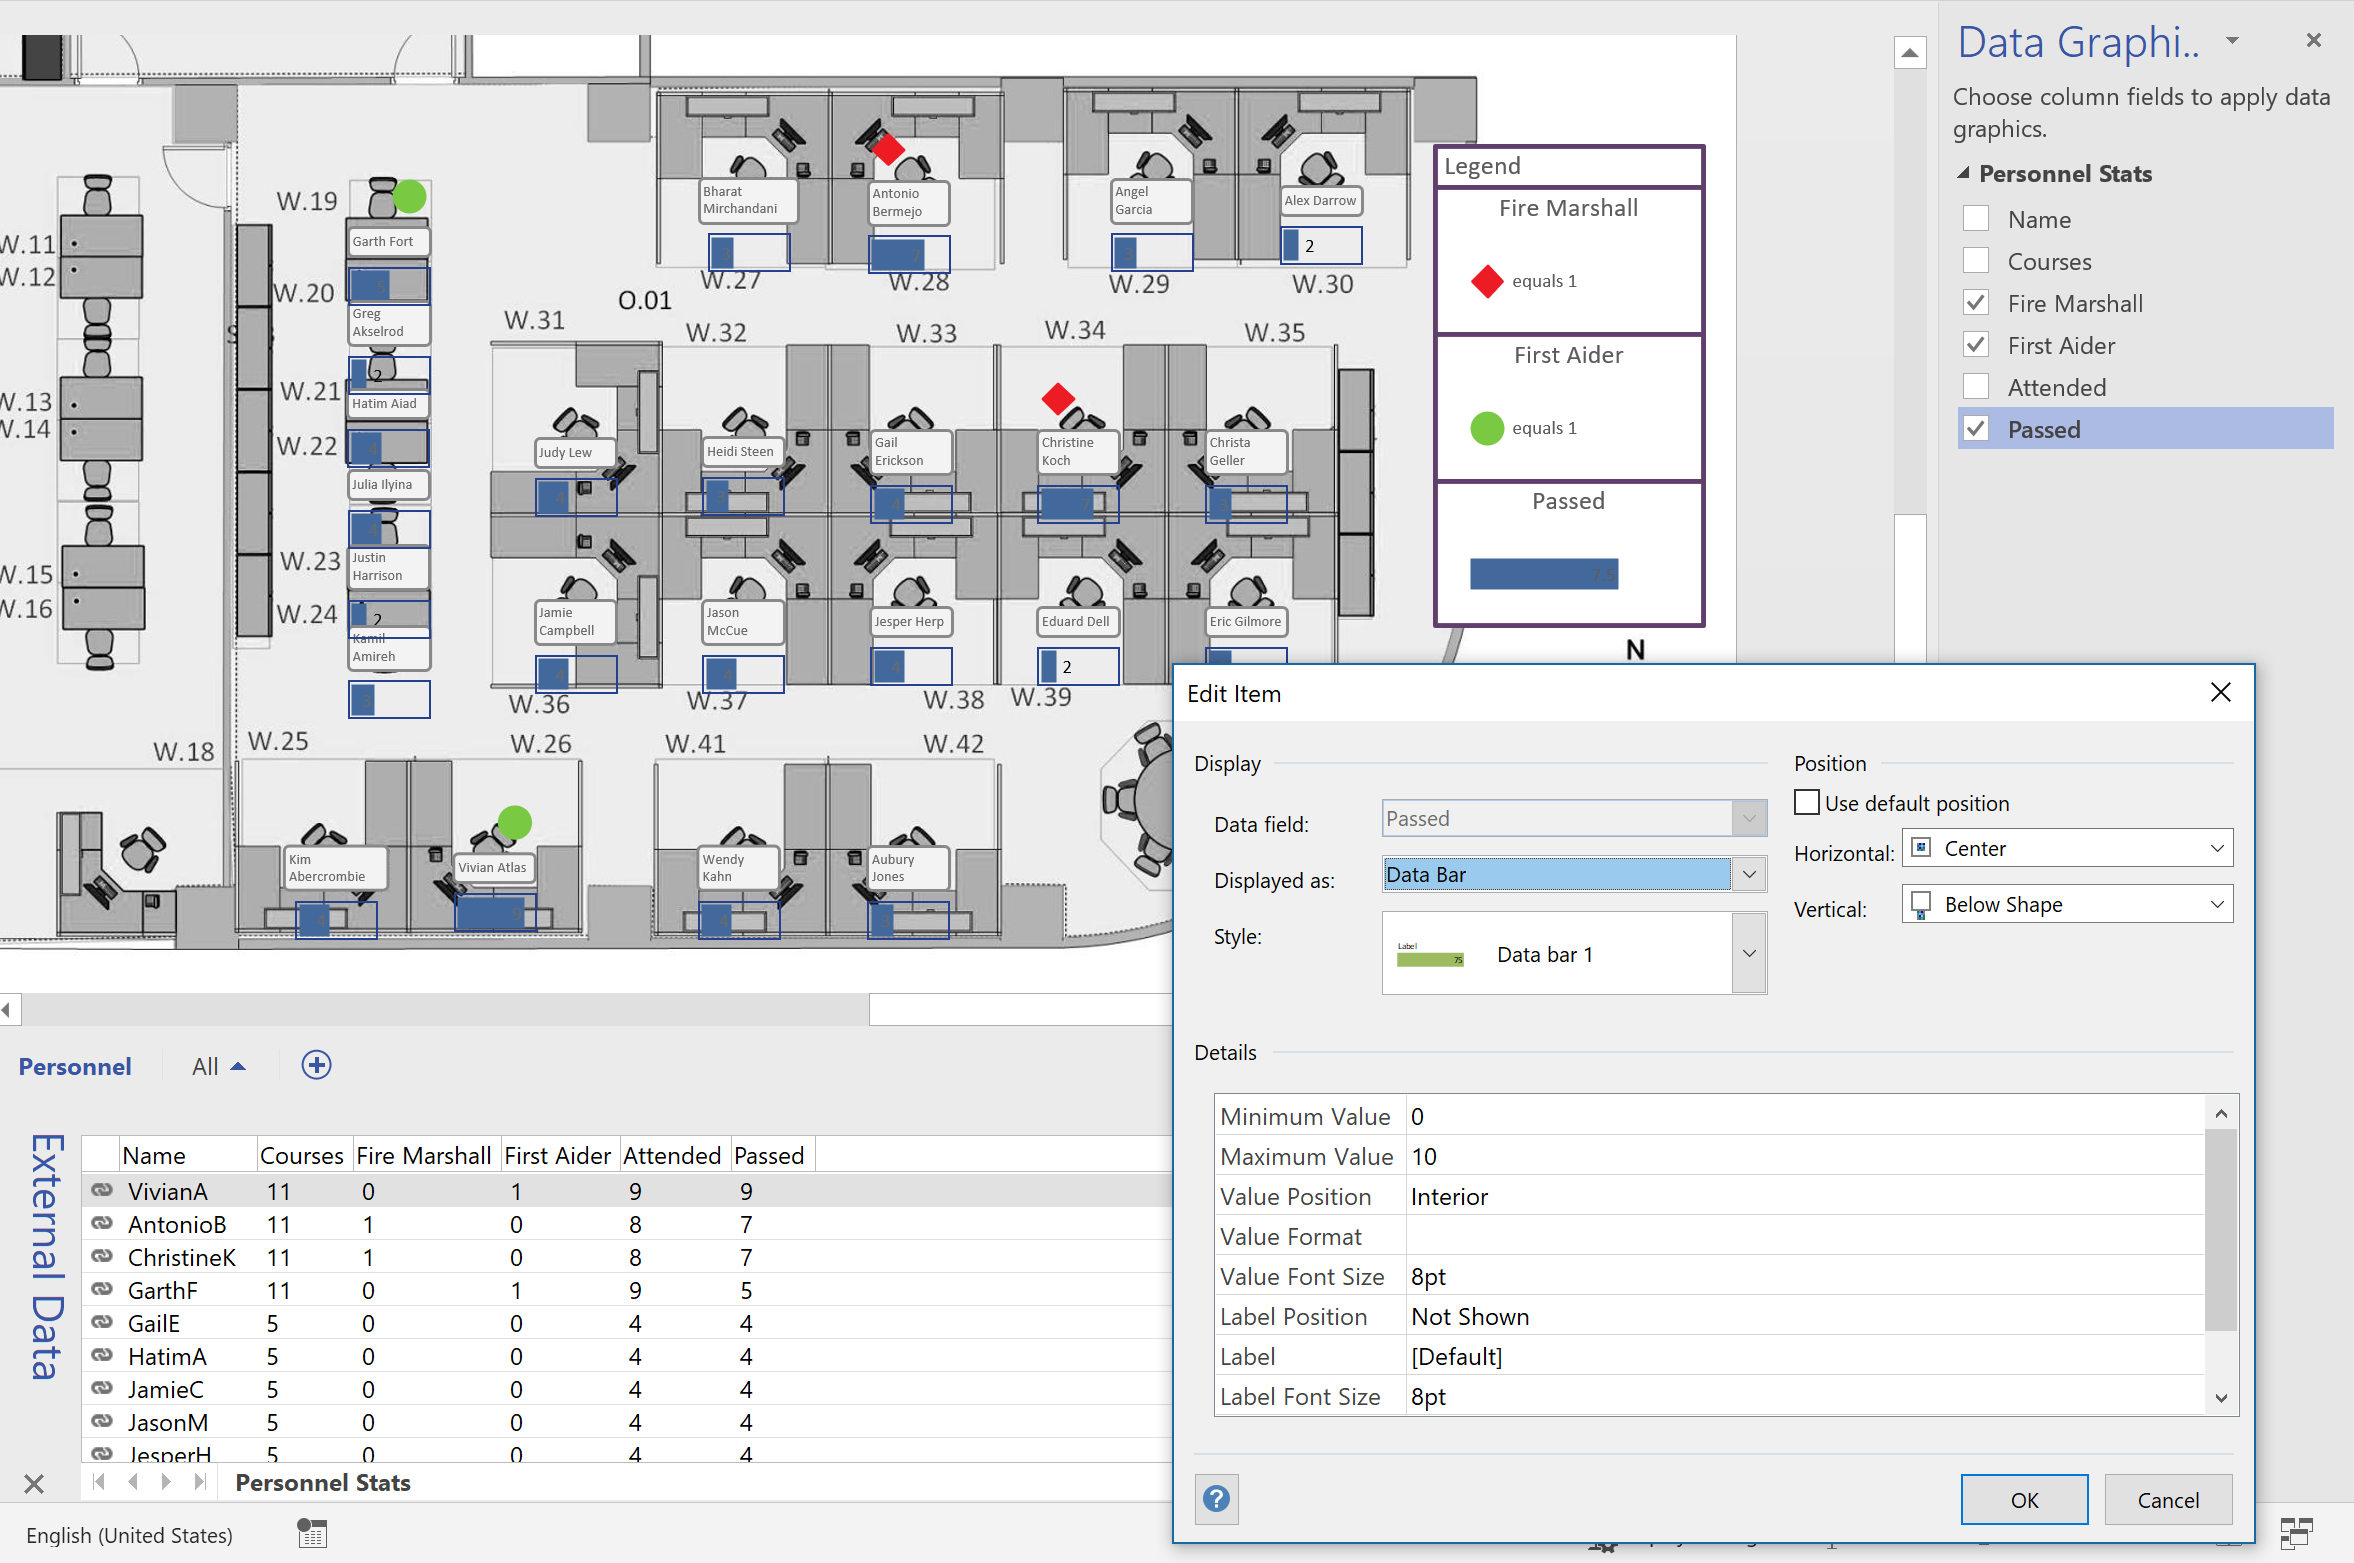
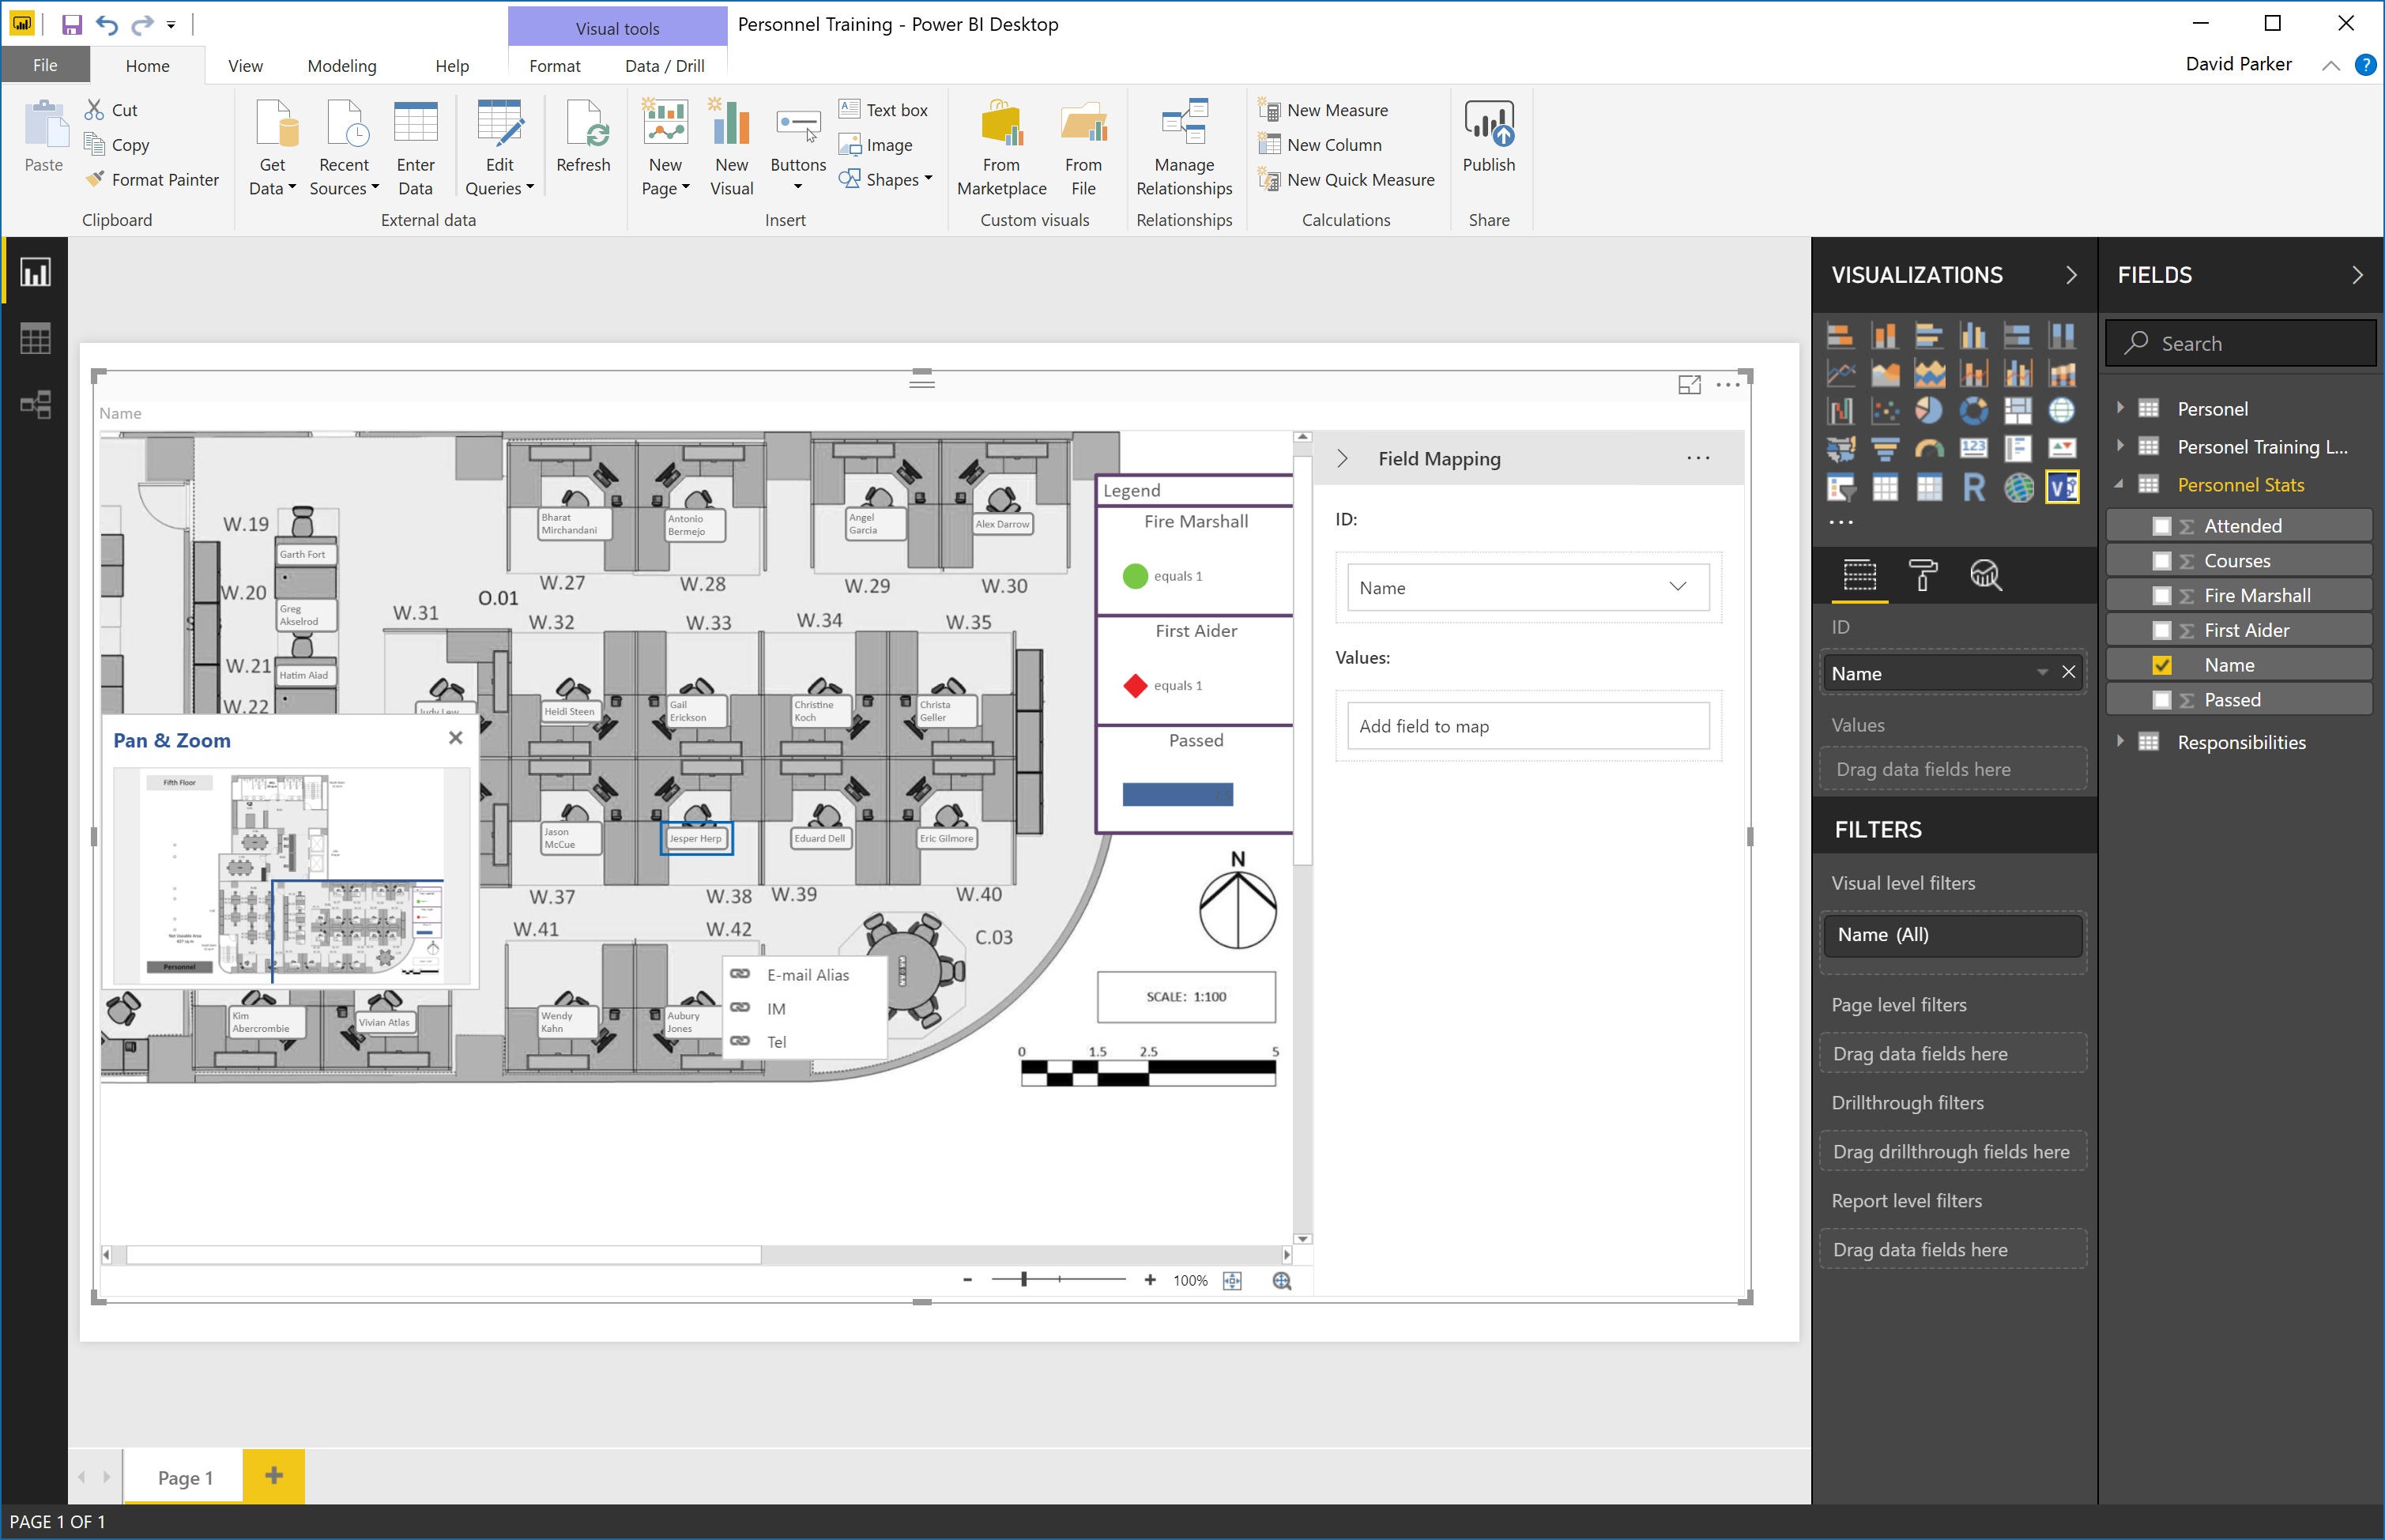
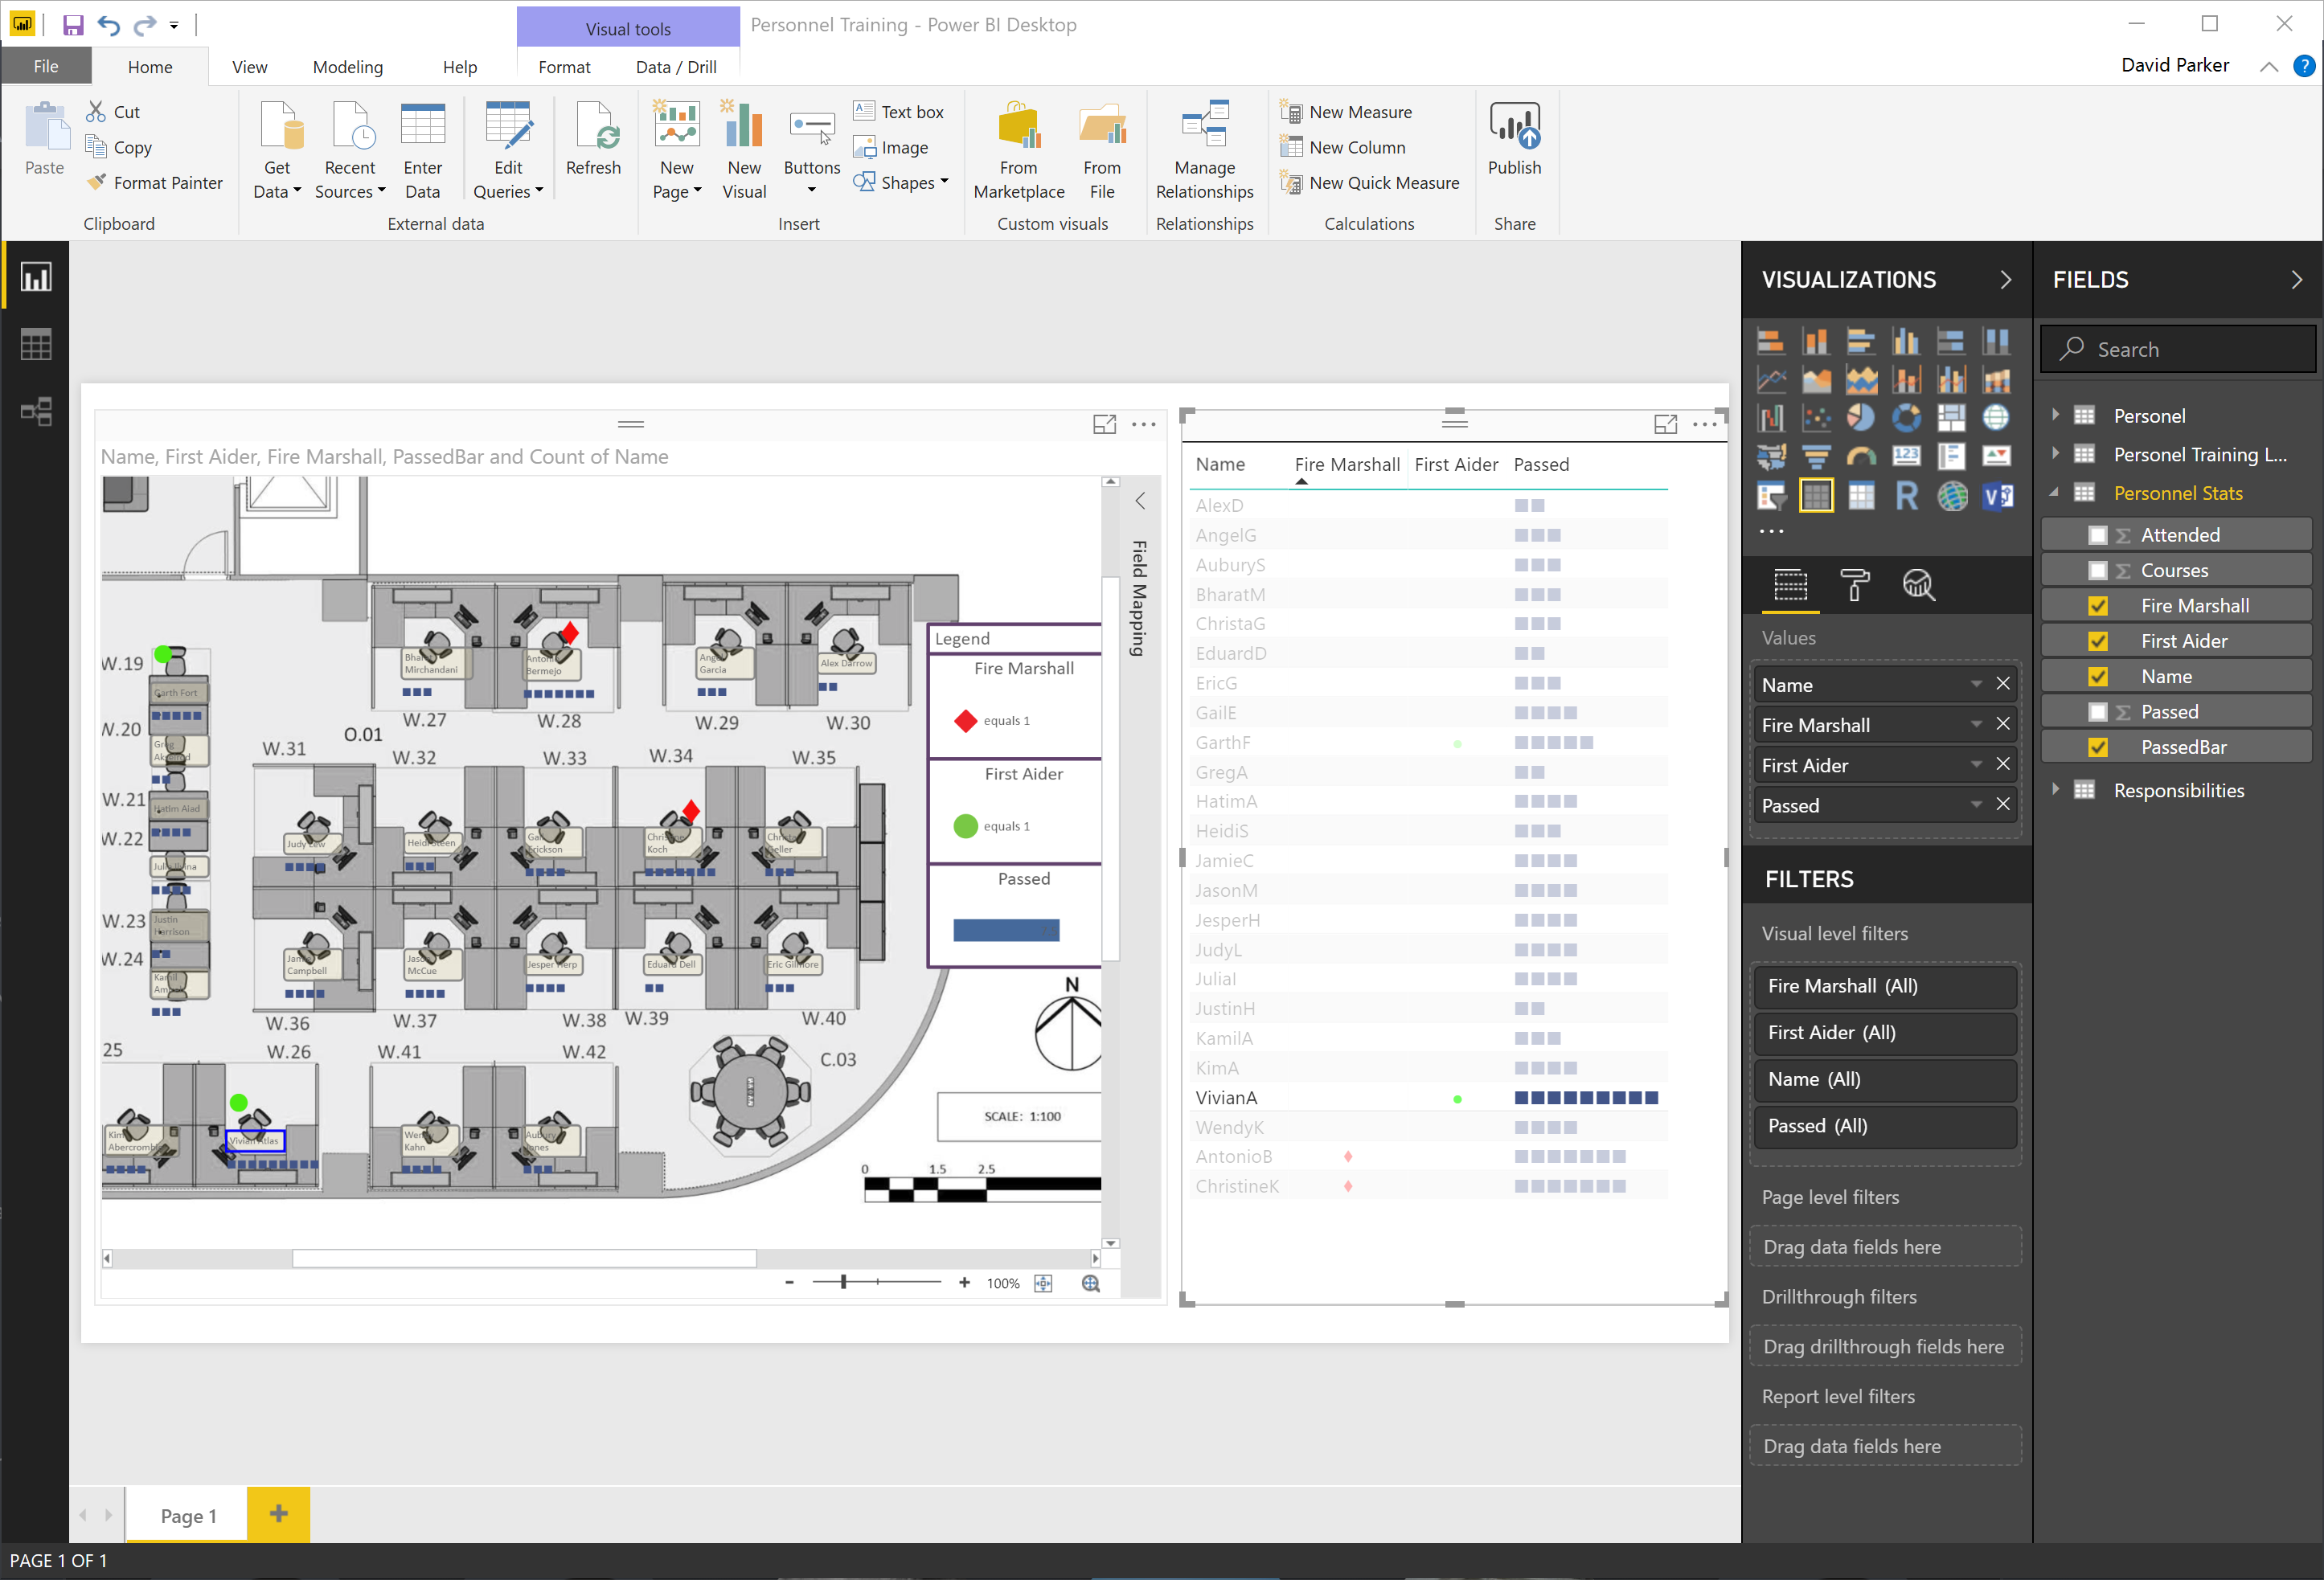
Icons Sets and Data Bars in PowerBI Visio visual
I really enjoy linking data to Visio diagrams, either directly or using the Visio custom visual in Power BI. This visual has the ability to display PowerQuery data as text or color, but not as icons or data bars. These last two features are something that can be used natively in Visio, and automatically updated in Visio Online. I have previously urged Microsoft to add these abilities to the Visio custom visual in Power BI, but there is no sign of it appearing just yet. The custom visual actually removes any Data Graphics ( Text Callouts, Icon Sets, Data Bars or Color by Value) that may already exist in a Visio diagram when it is embedded into Power BI. This reduces the number of shapes in the visual (there is currently a low limit) and, in any case, the data should be displayed from Power BI.
I want to be able to display some data as icons and data bars within the Visio diagram, so what is the alternative? Fortunately, there is a way using text symbol characters and the wonderful Power Query formulas!
Aliasing Data Columns for Visio Organization Chart Wizard
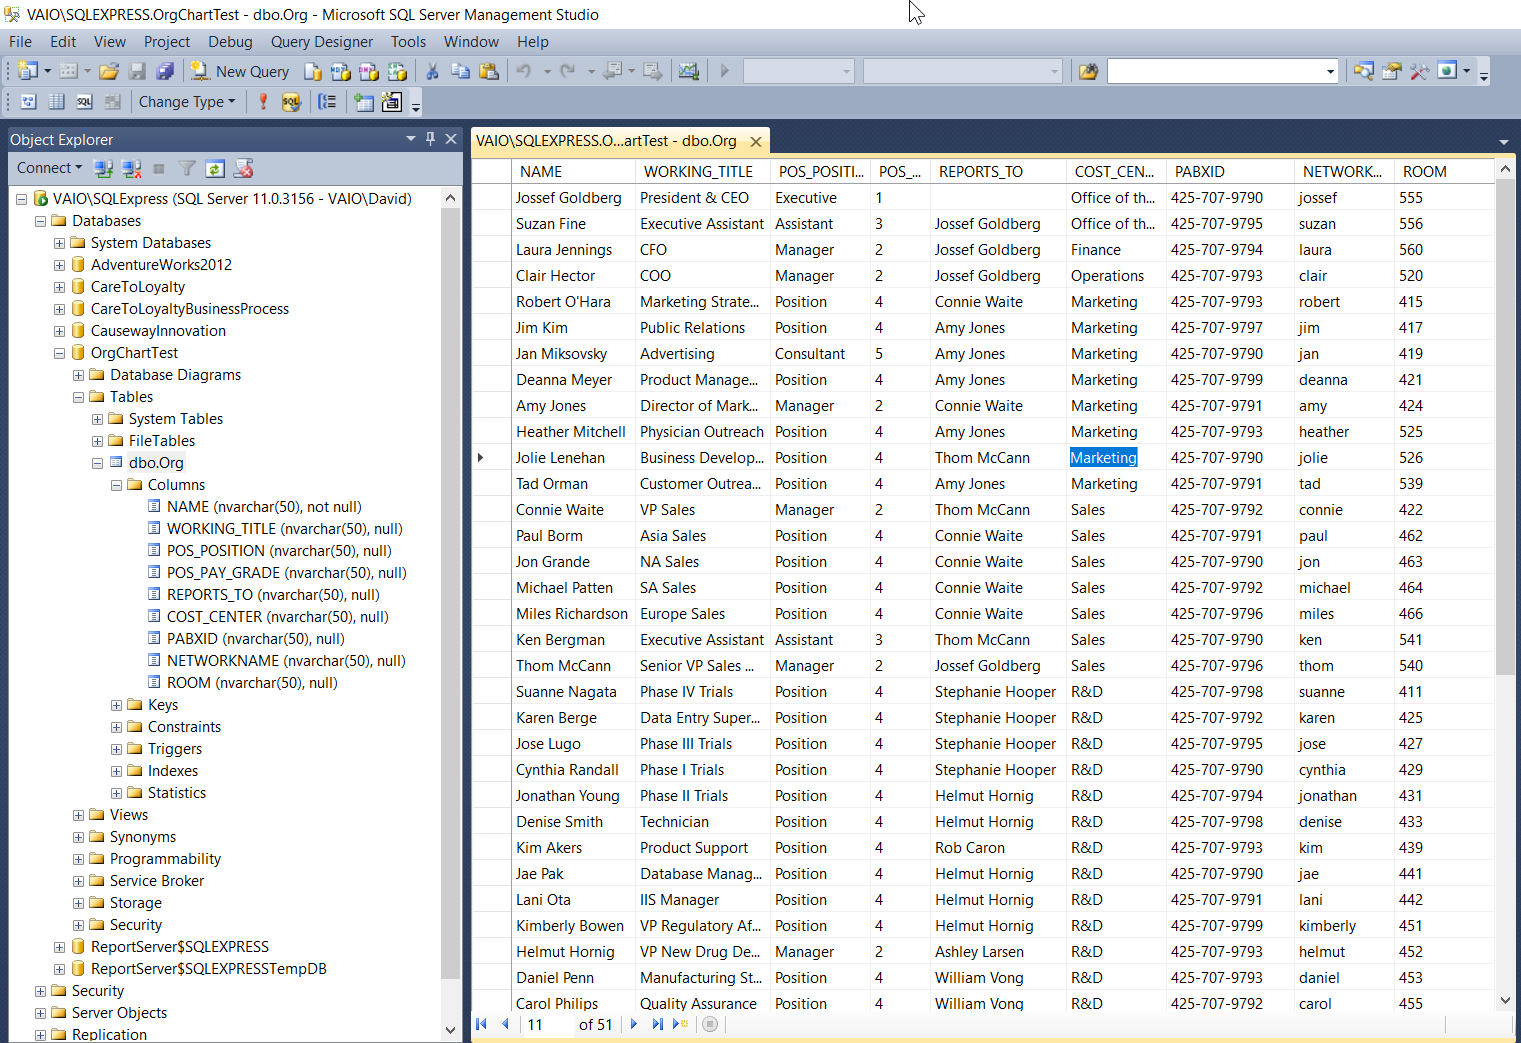
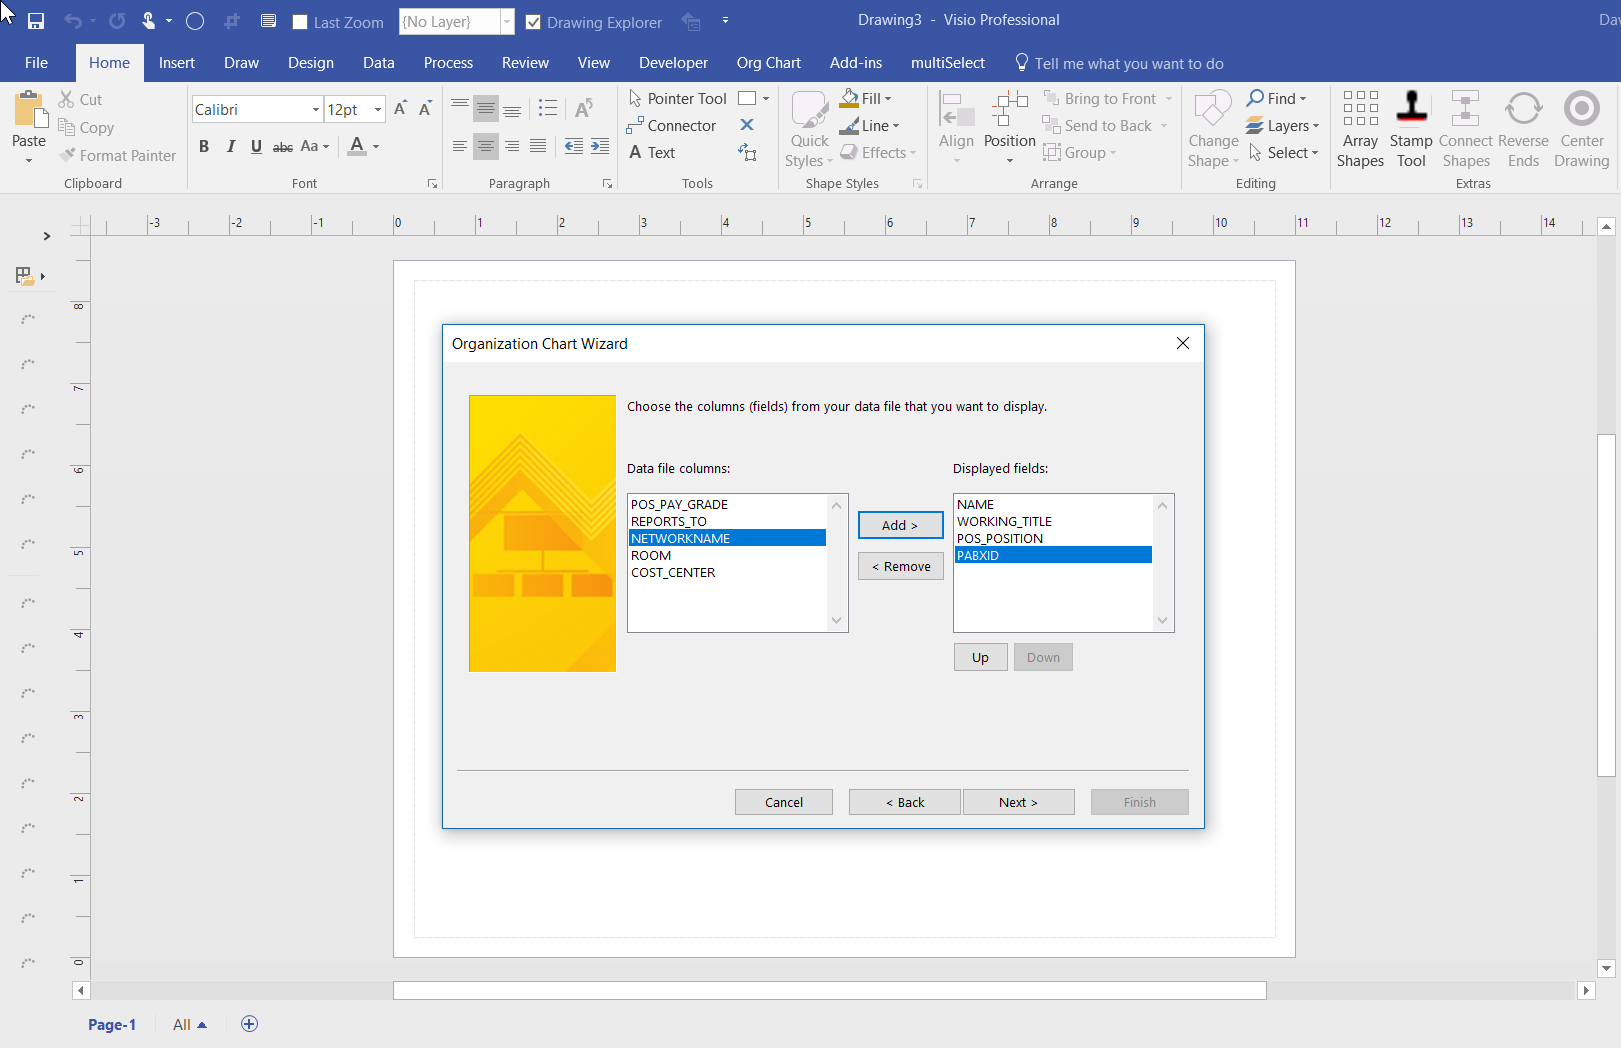
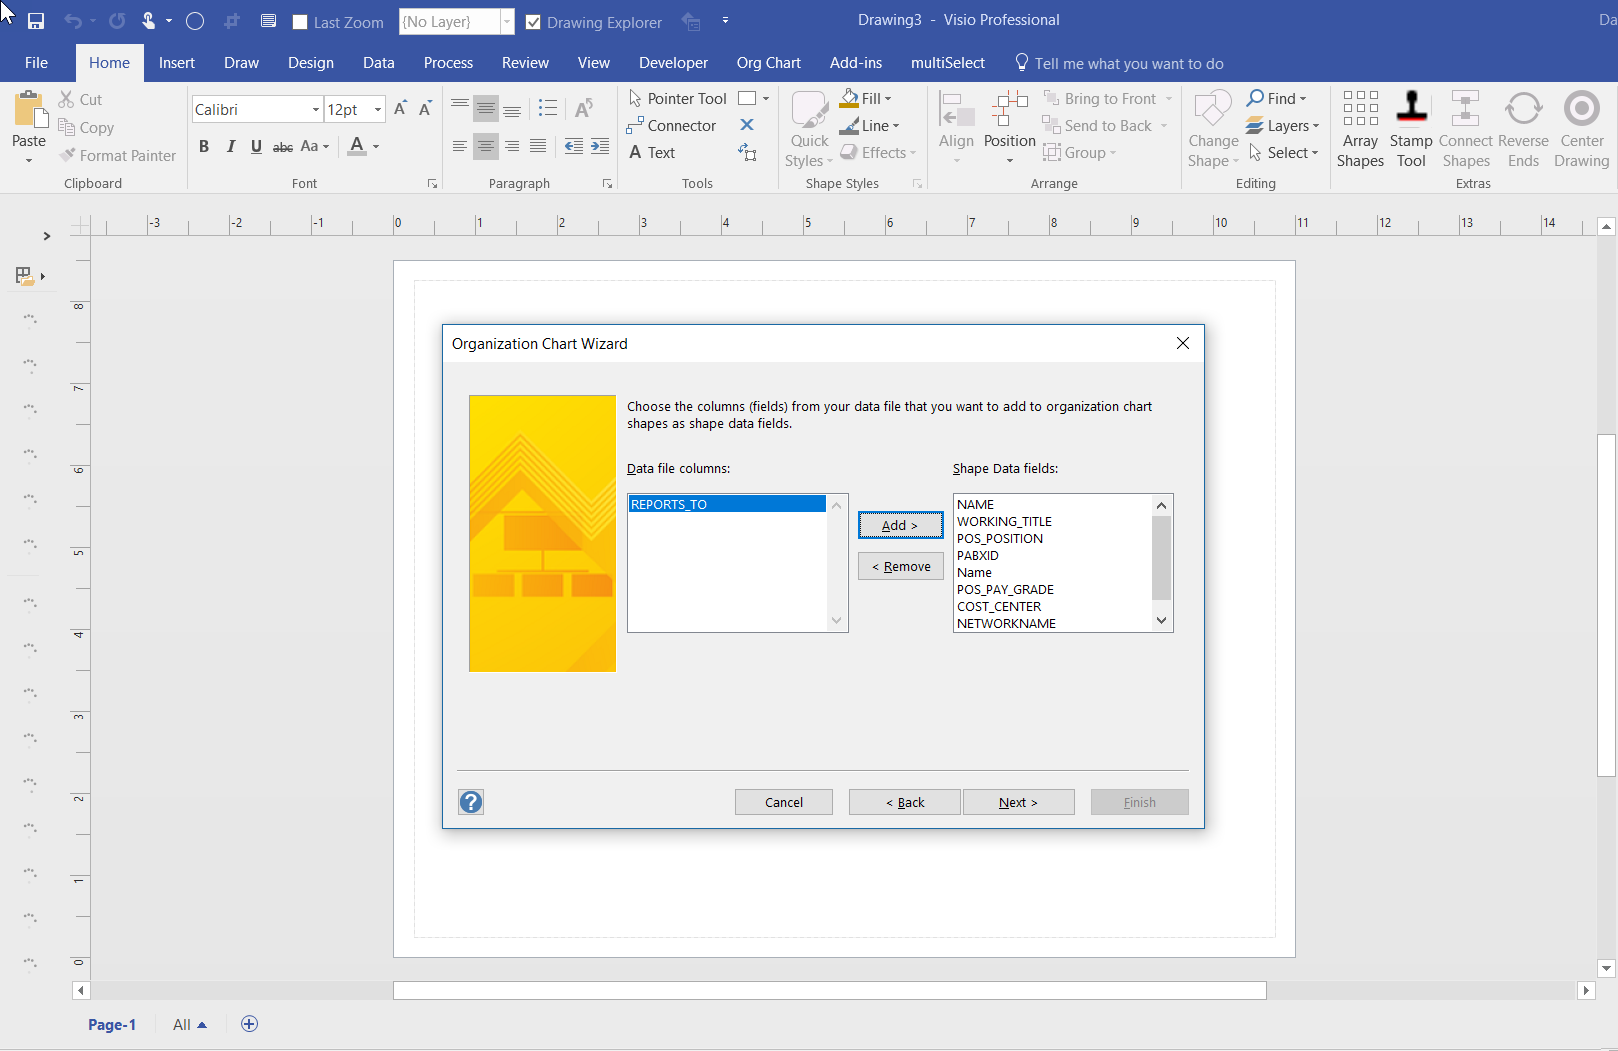
One of the most frequently used components of Visio is the Organization Chart Wizard (OrgChWiz), but it is also one of the most frustrating because of its apparent inflexibility. I was recently asked how to use different table column names with the wizard because the originating ODBC source could not be touched. Well, I have previously used Access to modify and enhance tables in this situation, but the OrgChWiz is quite old, and does not like using the newer Access queries as a data source unfortunately. If the basic table column names do not match the default column names in the organization chart shapes, then there may be superfluous Shape Data rows created on each shape and the ability to change the shape style is compromised, and the Shape Data rows get quite confused!
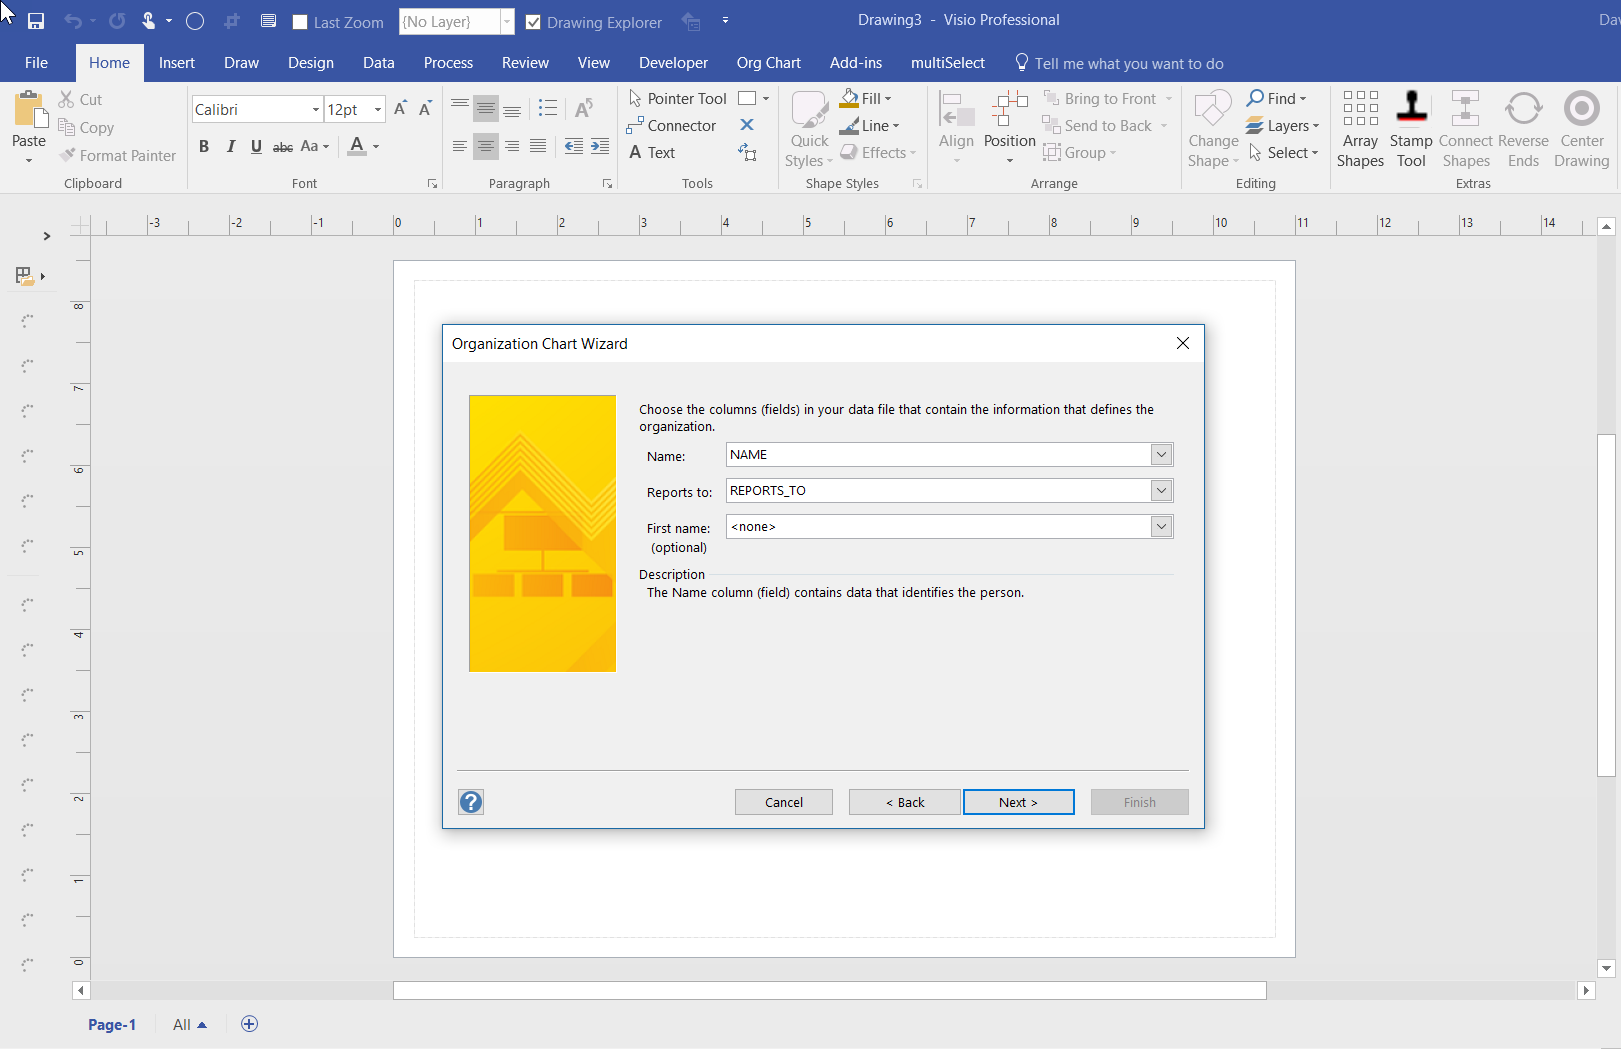
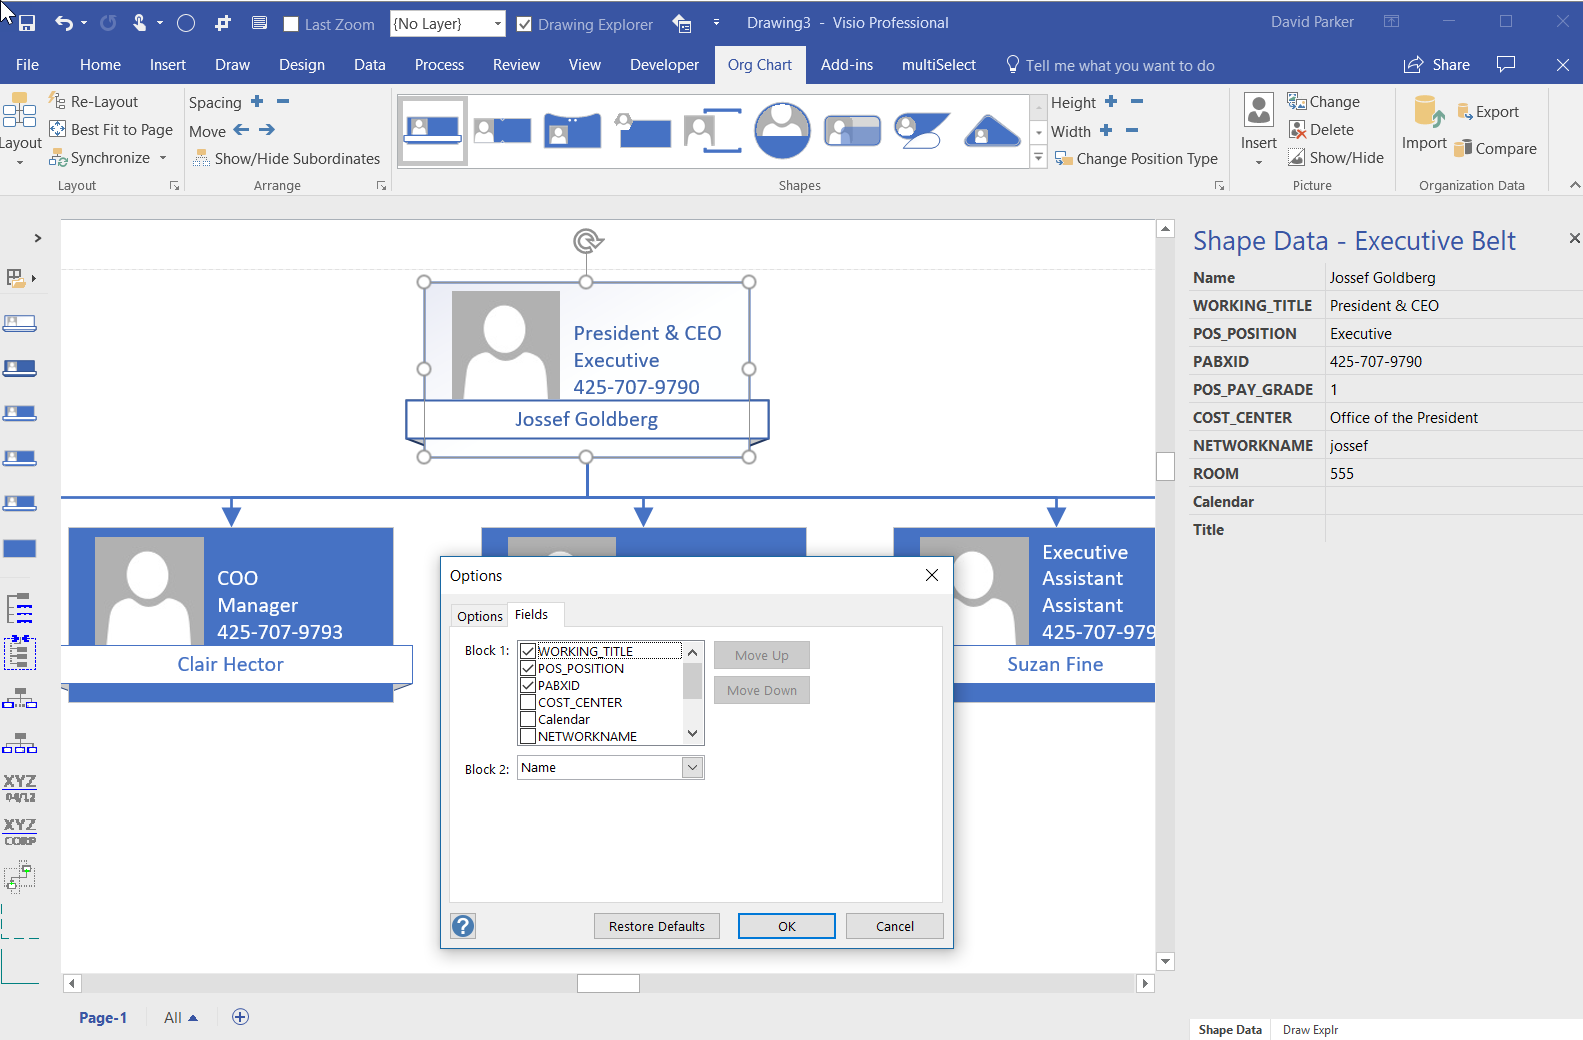
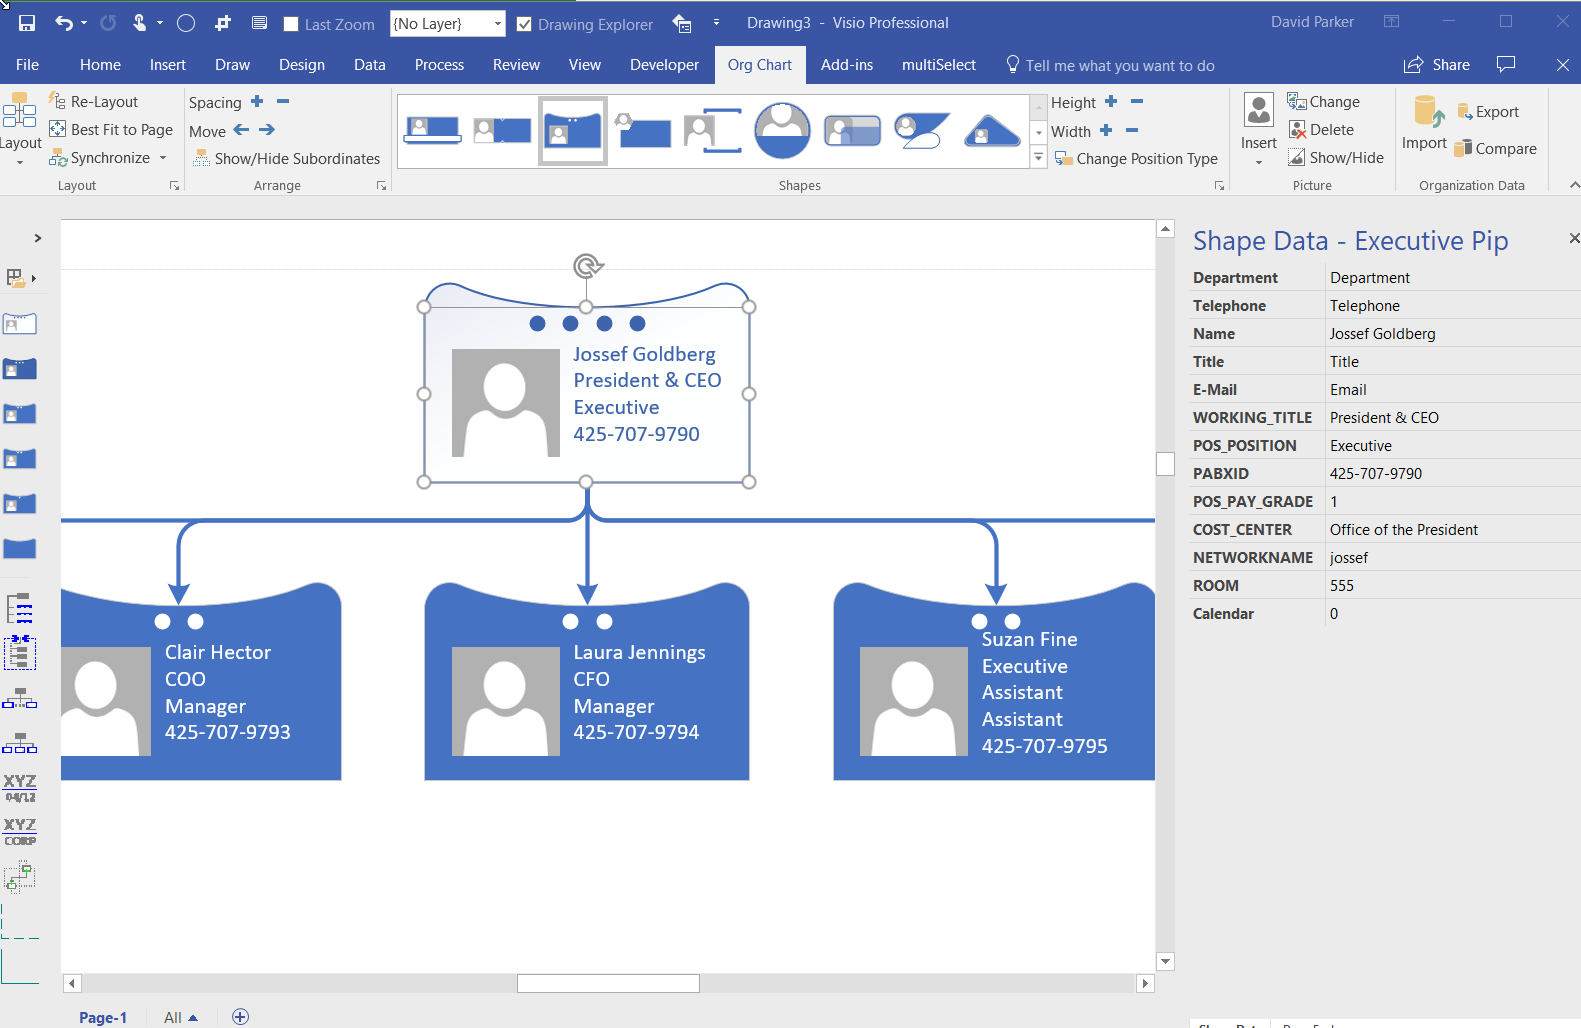
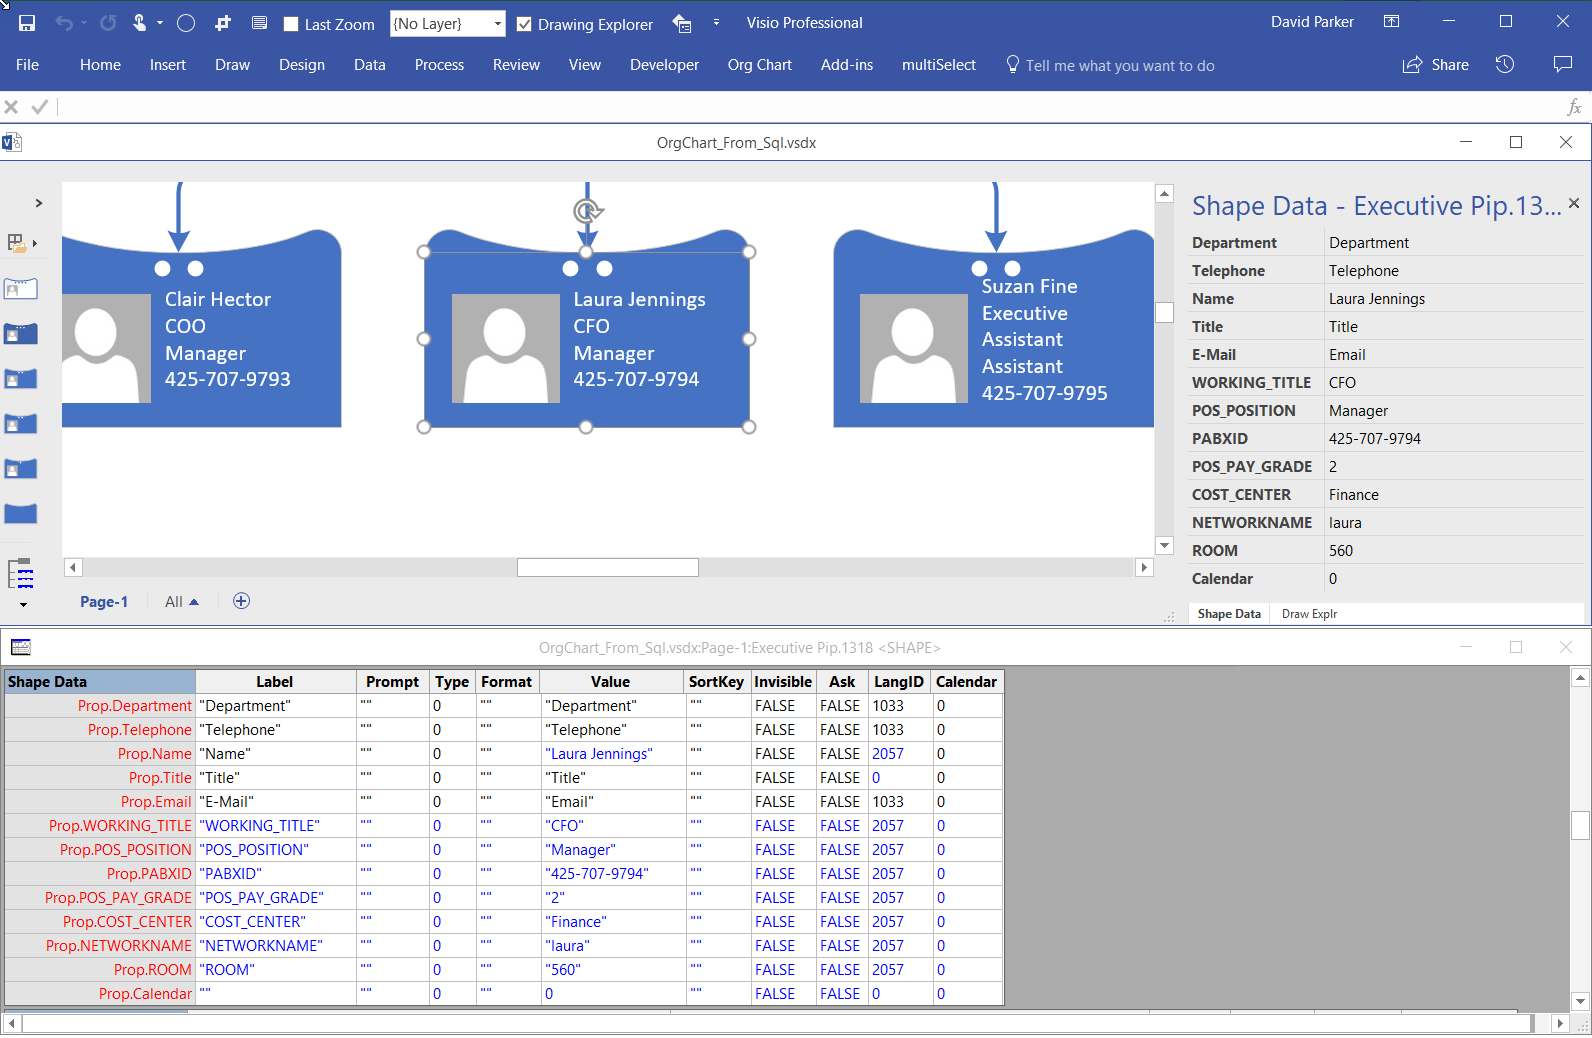
The Organization Chart template opens with the Belts – Organization Chart Shapes stencil open by default, although the Master shapes used can be replaced with those on one of the other nine using the Org Chart / Shapes gallery: