I needed to display the week number of dates in a Visio project of mine, but there is no WeekNum(…) function built-in, so I had to write one, and allow for the date that the week numbers begin in to be varied from 1st January. I also needed to allow for the week numbers to go backwards from the specified week number begin date.
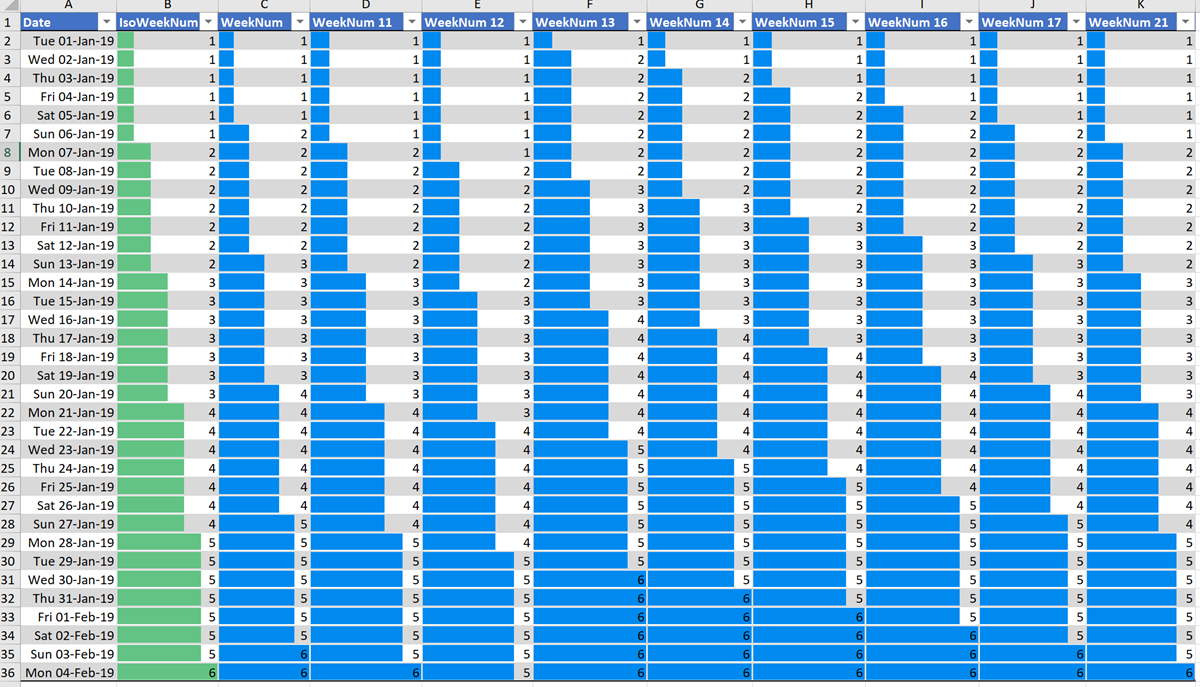
Excel has a WeekNum(..) function, which can take an optional parameter for the day of the week to begin on, and an IsoWeekNum(..) function, and the following table shows the values change for the first 35 days of the year:
[Read more…] about Writing a WeekNum(…) function for Visio
Visio 2016
My session @ MSIgnite about Visio and PowerBI
Well, that is the first day of MSIgnite over, and I am looking forward to hearing more about the roadmap for Visio today. I presented my session yesterday in a theater that seats 50 but 1,000 had registered for. In the end, the space was so full, I had no idea how many were there, but it was a lot! ( View my session on YouTube / View a 360 image)

I will be on the Visio booth now for a lot of the time during the conference, so please come talk to me about the possibilities of Visio solutions and integration with other Office applications and Office365. Microsoft have some cool demos of Visio / 3D Mixed Reality, Visio / MSFlow and, of course, Visio / PowerBI.
My book publishers have kindly provided some discounts for the duration of the conference:
- eBook Discount: 50%Code – MDVMP50
- Print Discount: 15%Code – MDVMP15
- Valid until September 30th 2018
- Go to packtpub.com
In addition, we will be offering the chance to win a copy of mine and Scott Helmers’ book “Microsoft Visio 2016 Step by Step” on the booth.
From Seattle to Orlando in 21 years


I was going through my wardrobe the other day, and found my speaker shirt from the Visio Solutions Conference in 1997. This was the first time that I spoke about my use of Visio in the workplace. Back then I was automatically creating dealer desk layouts from a Sybase database for a major bank in London. Next week, I will be at MS Ignite in Orlando, demonstrating how Visio and PowerBI can provide a searchable, updatable dashboard of a data center. If you are there, then I would be delighted to meet you.
Enhancing the Built-In Containers in Visio
The concept of Structured Diagrams was introduced in Visio 2010 to provide core functionality for a variety of the templates in Visio, such as the Cross-Functional Flowchart, BPMN Diagram and Wireframe Diagram. This is primarily evident as Containers, Lists and Callouts and they can be customized (see Custom Containers, List and Callouts ), as shown in some of my previous articles ( see https://blog.bvisual.net/?s=container). One example of this extension can be found in all of the flowchart shapes that placed into a swimlane in a cross-functional flowchart. They have a Shape Data row, Function, that automatically inherits the text entered into the header of the swimlane. In another example, a Visio user can use Insert / Diagram Parts / Container to visually group other shapes together, and update the header text of the container. Well, I often do want my custom shapes to inherit the text of a container, so, in this article, I show how the built-in containers can be enhanced to provide this ability.
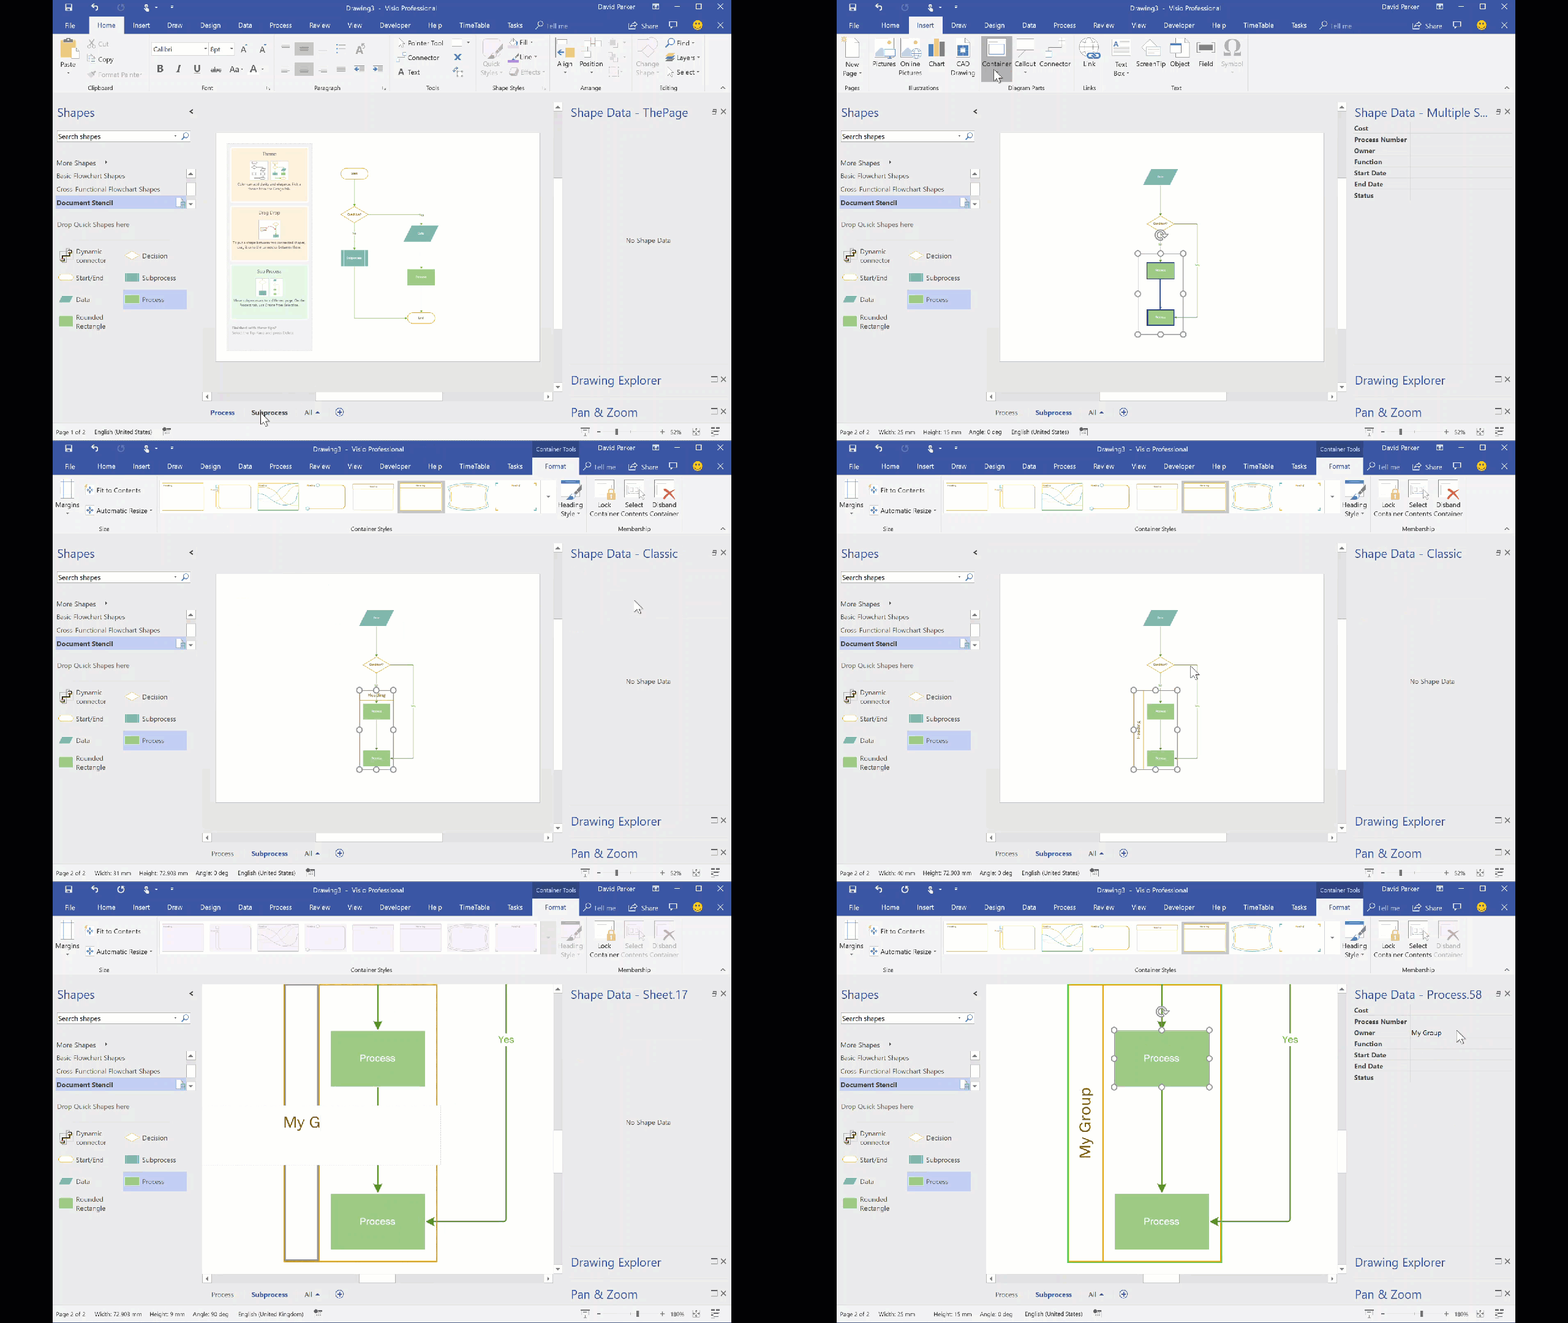
You should be aware that I often exploit the fact that Visio creates a local copy of each master shape that it uses within a document. This can be modified and set to match master by name on drop, to ensure that it is the one to use, even if the original Microsoft provided version is used. In this case, I use this trick to create hidden, enhanced versions of the containers that are available in the gallery of containers. Microsoft also do this with the Dynamic connector shape in a number of their own templates.
If you examine the Function Shape Data row of any of the flowchart shapes, then you will find the formula:
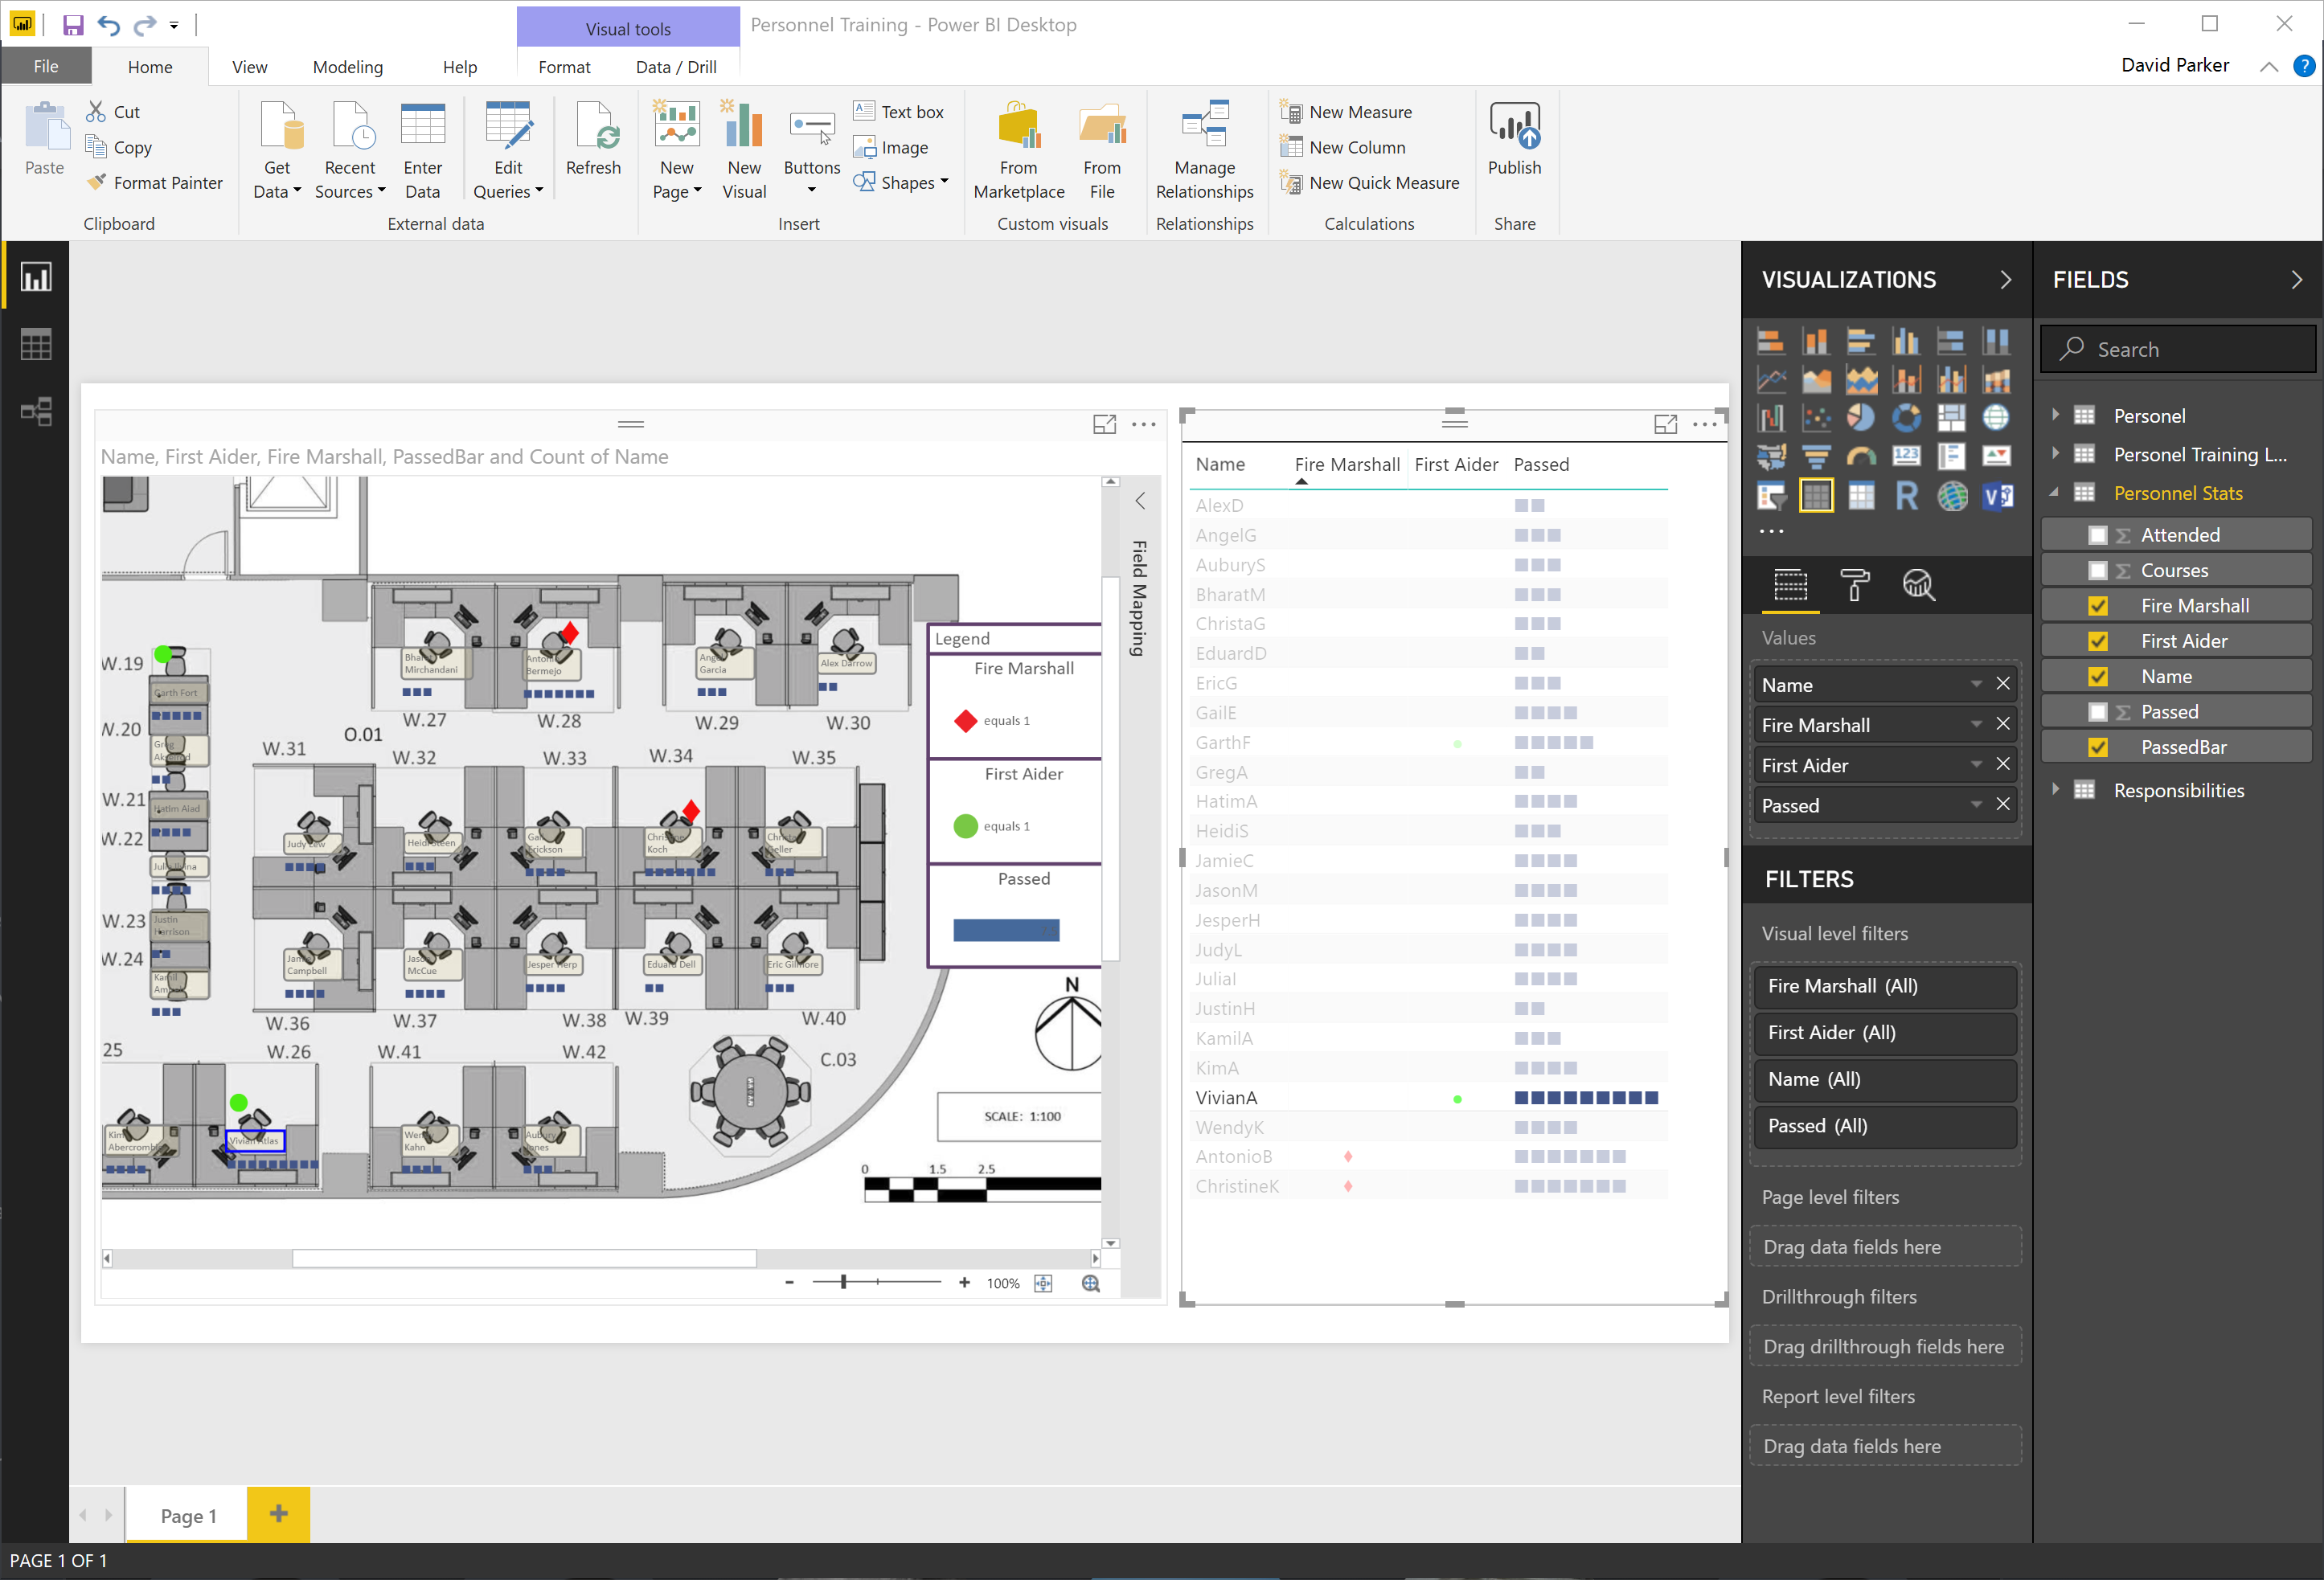
Icons Sets and Data Bars in PowerBI Visio visual
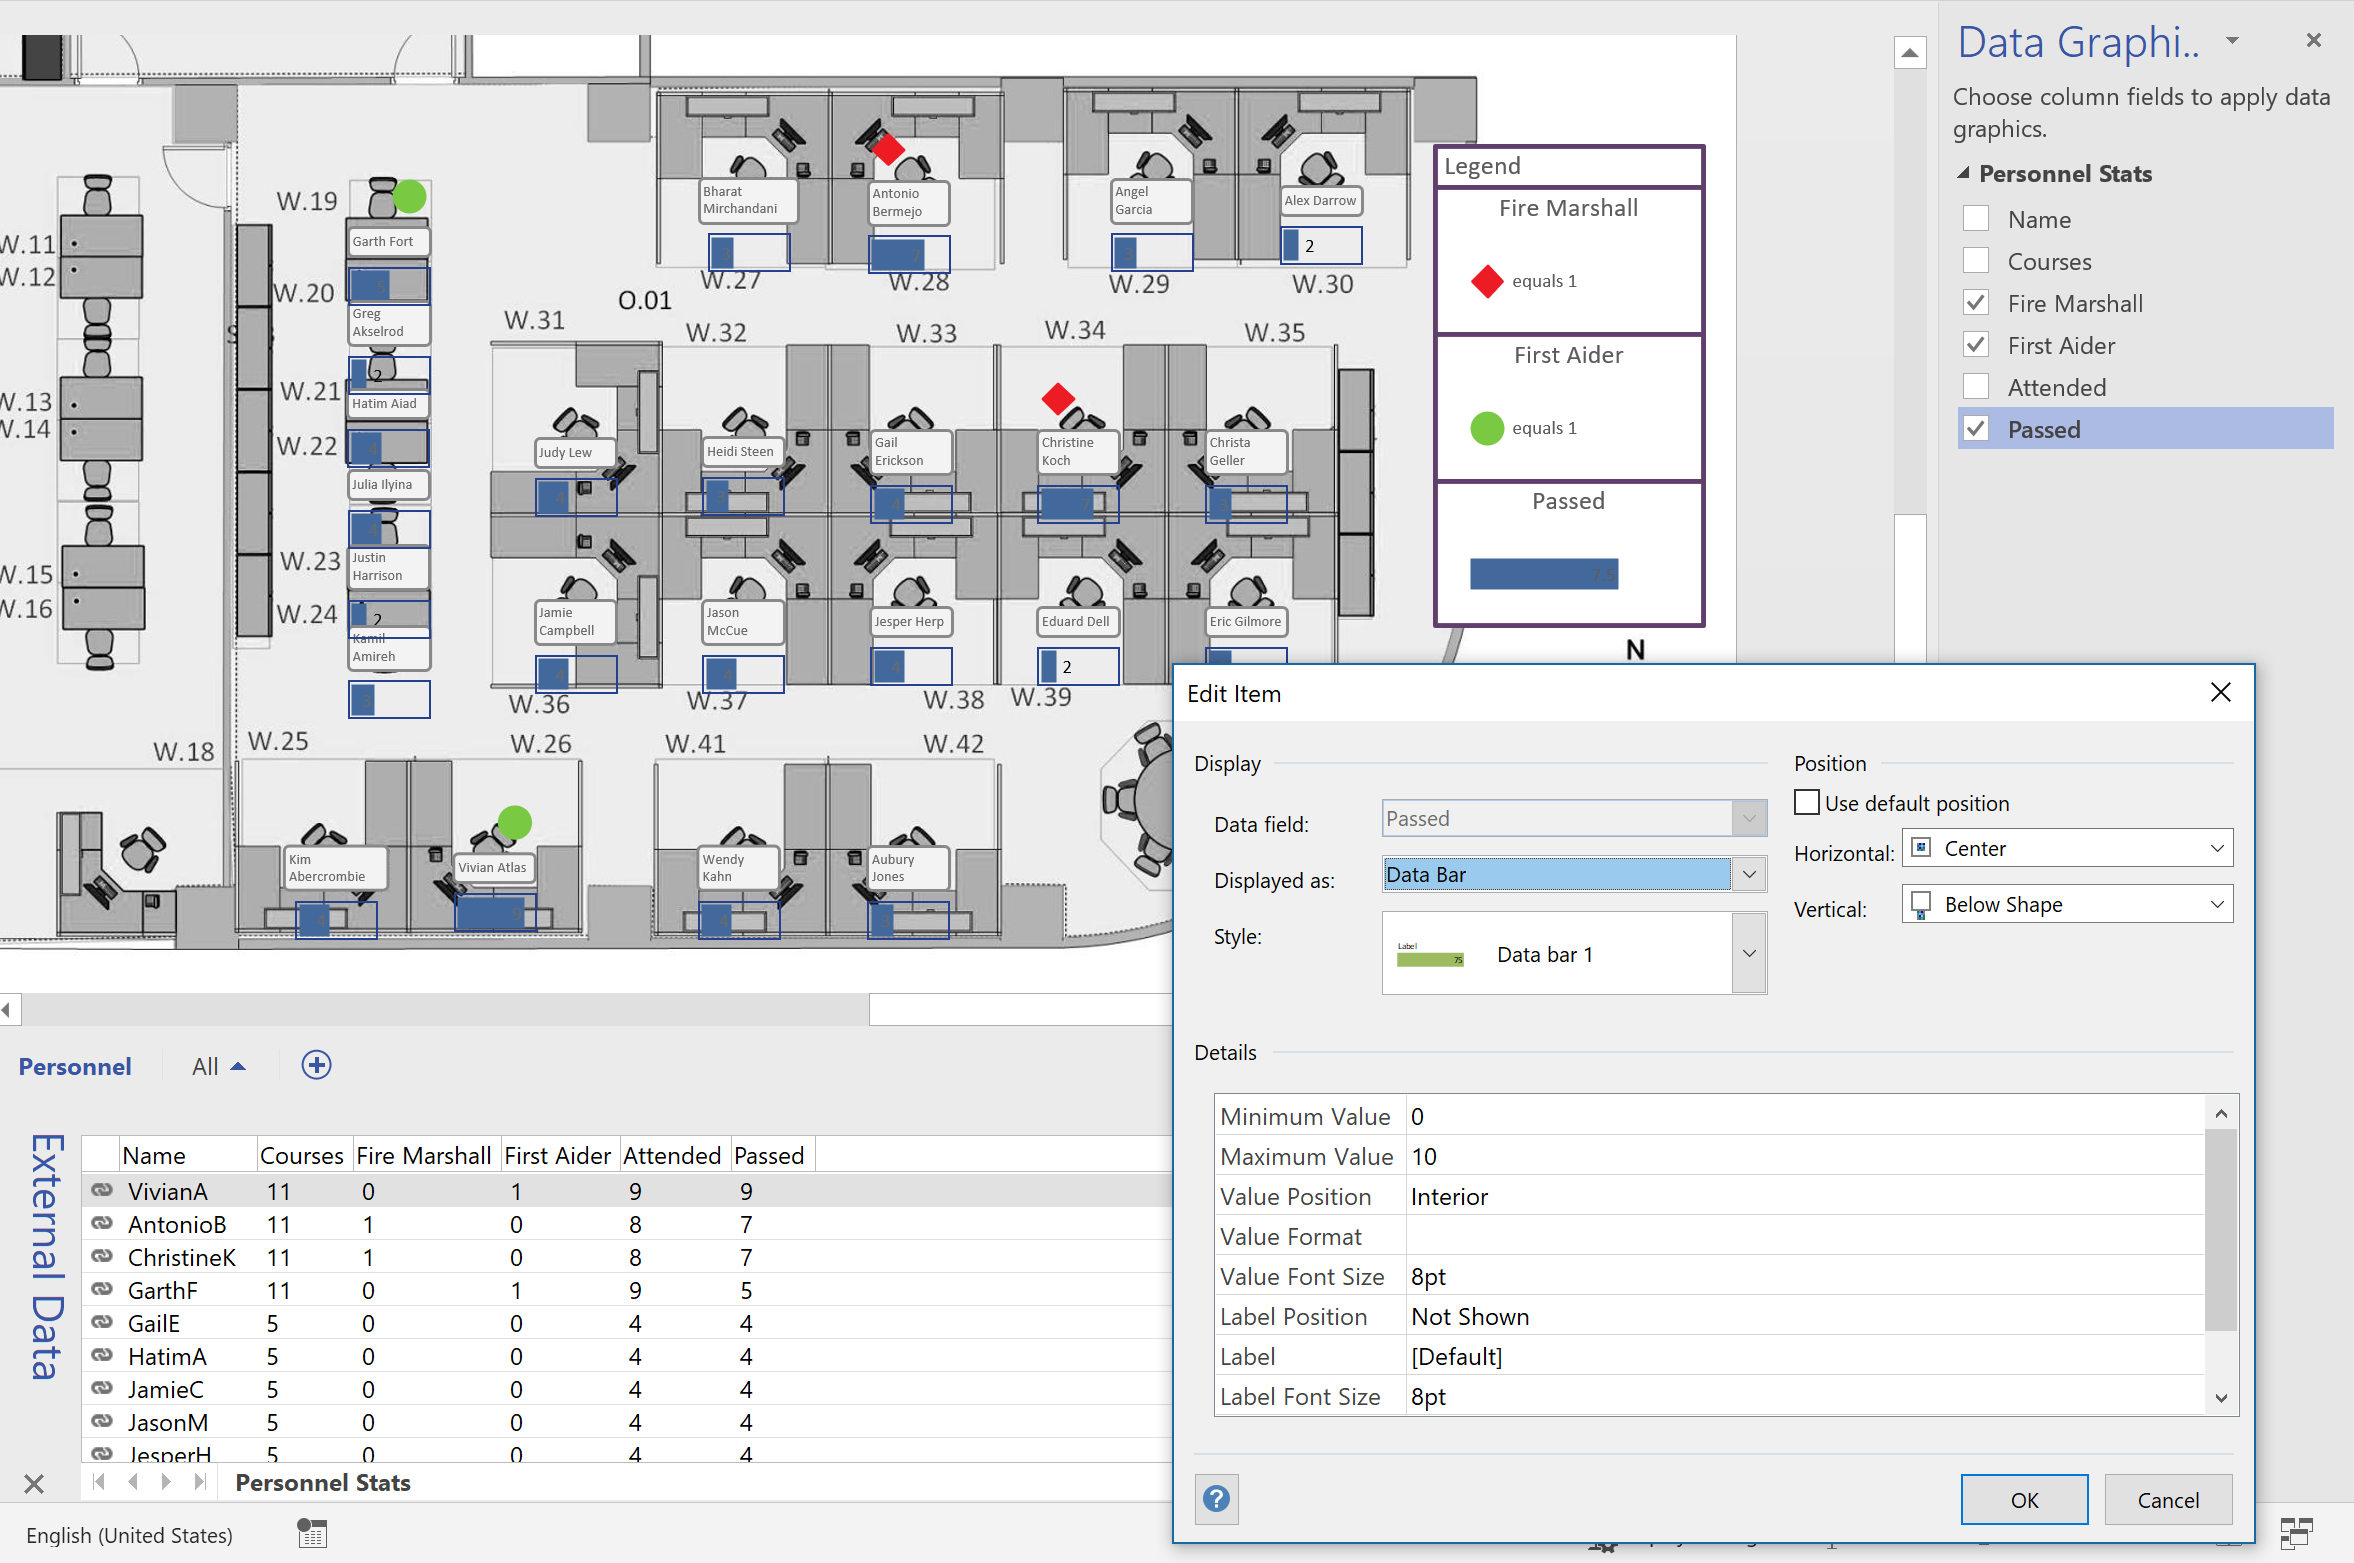
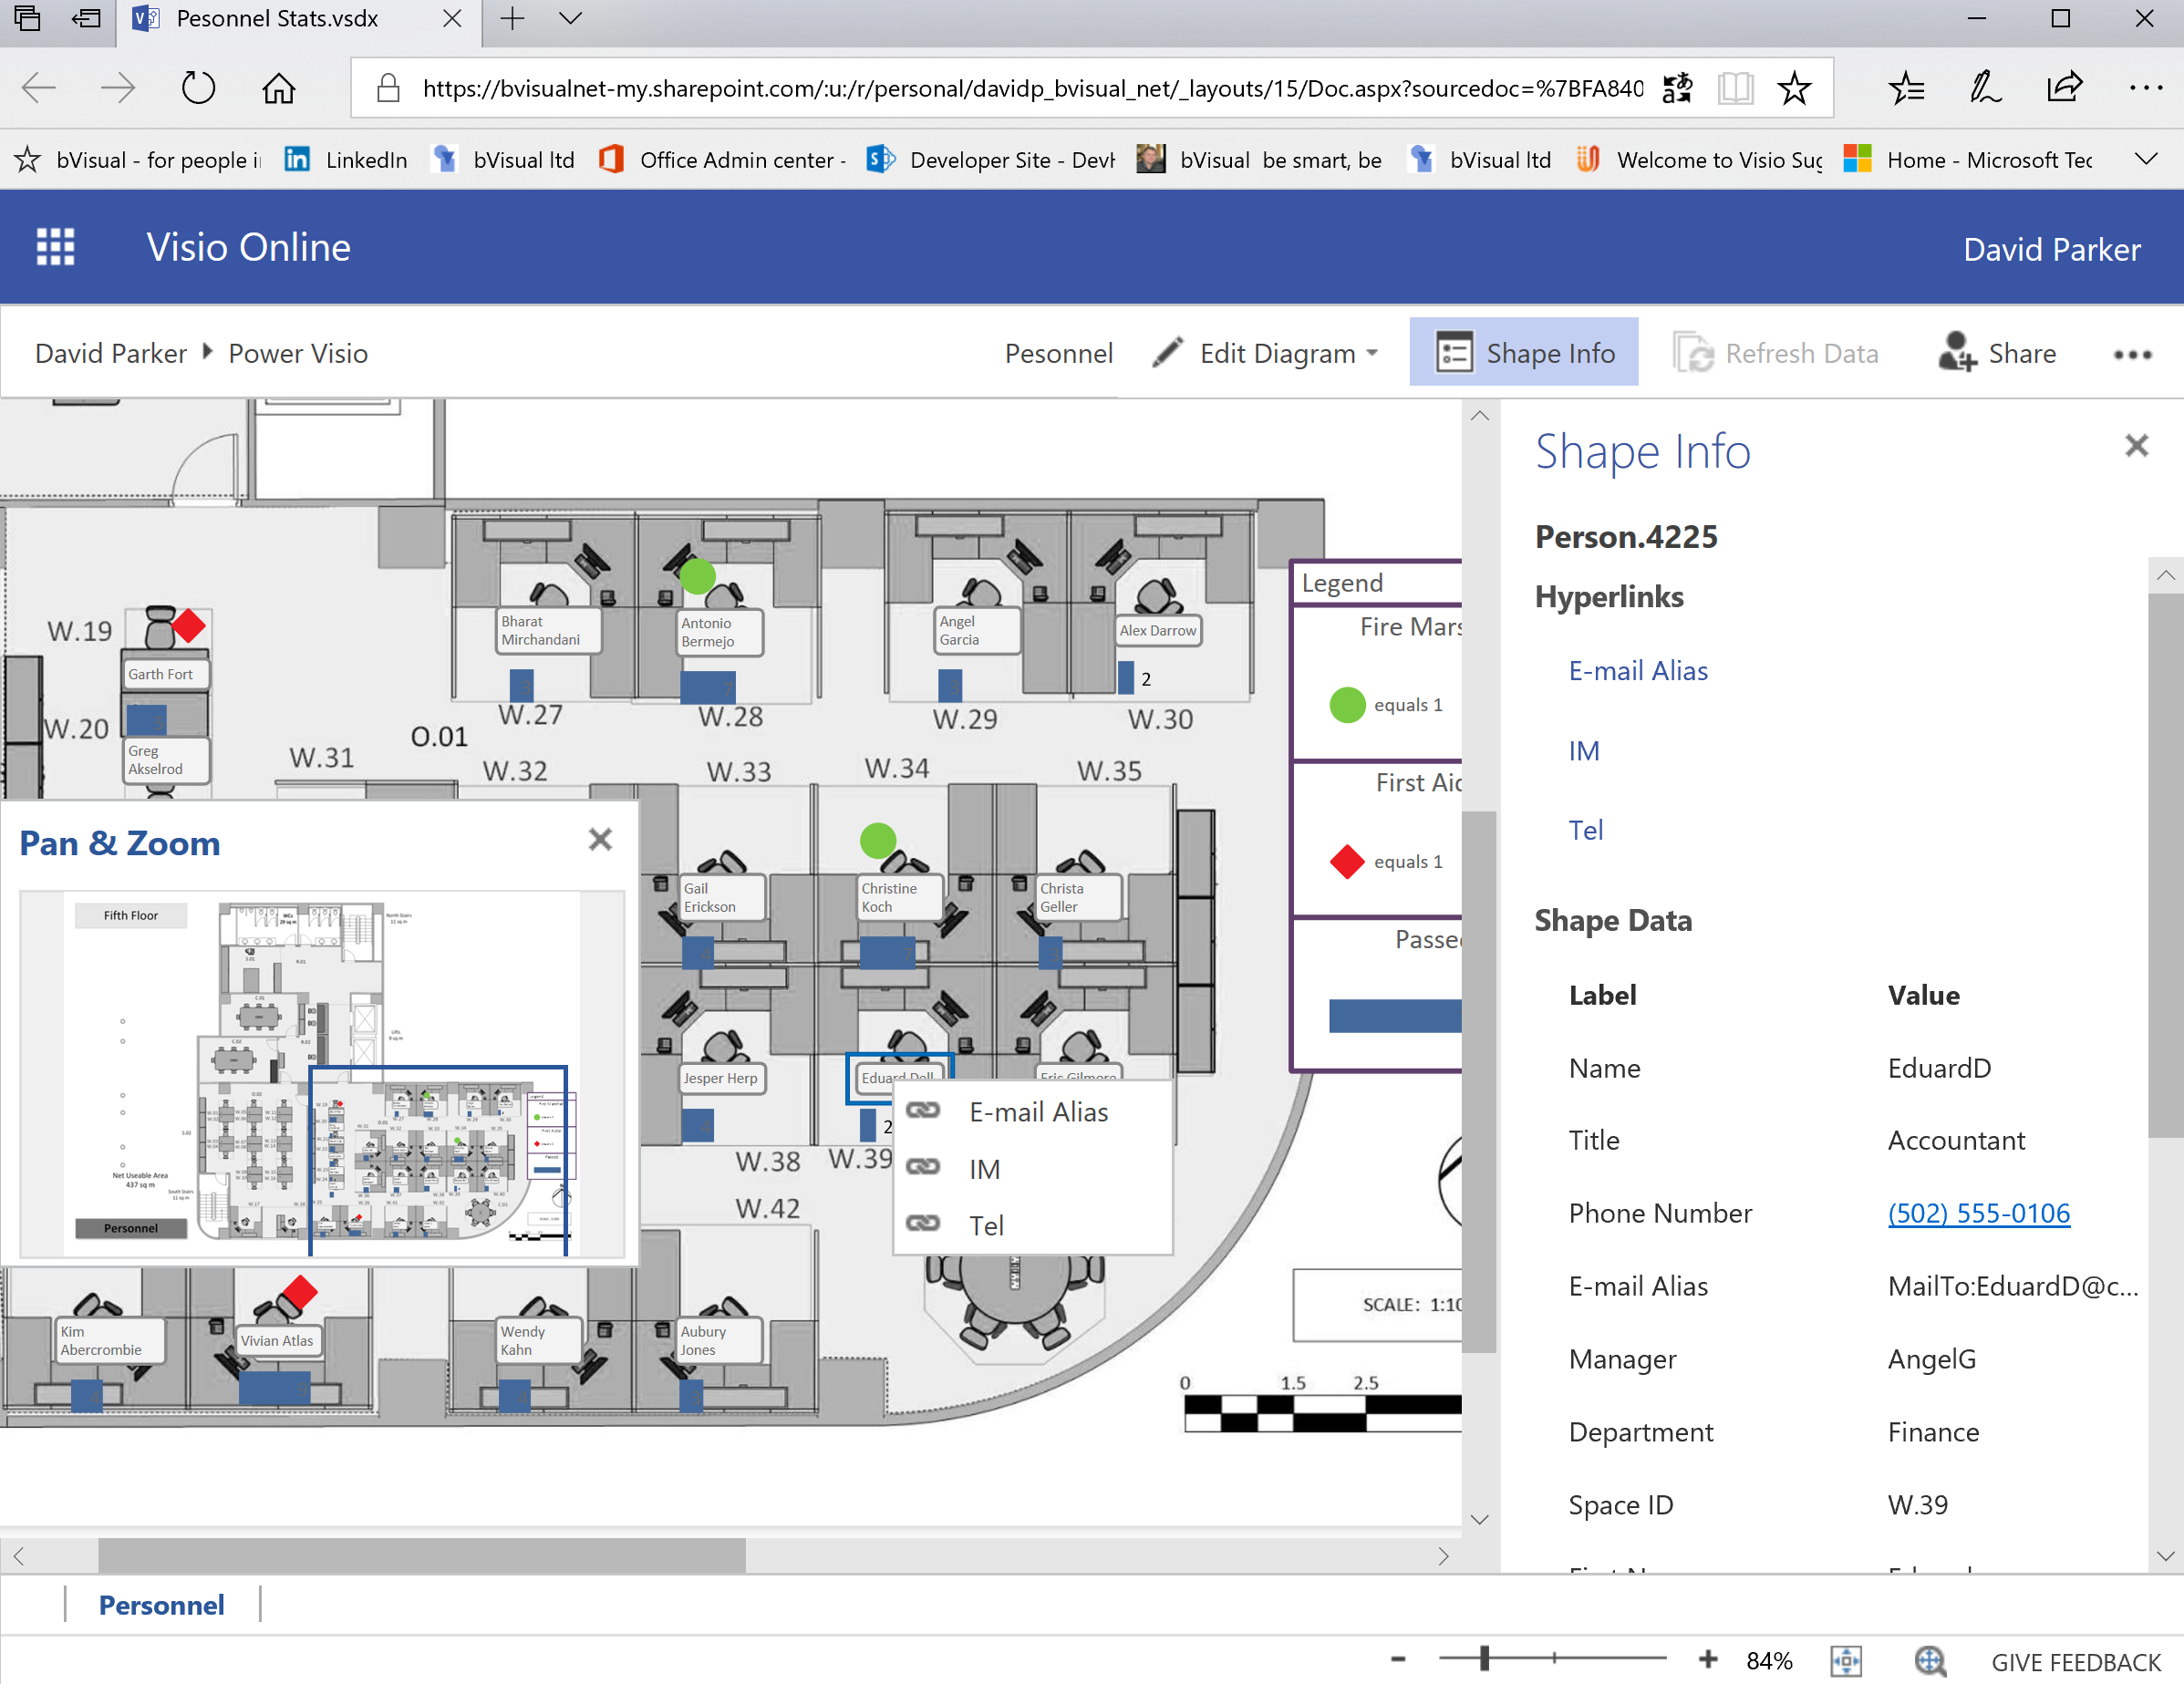
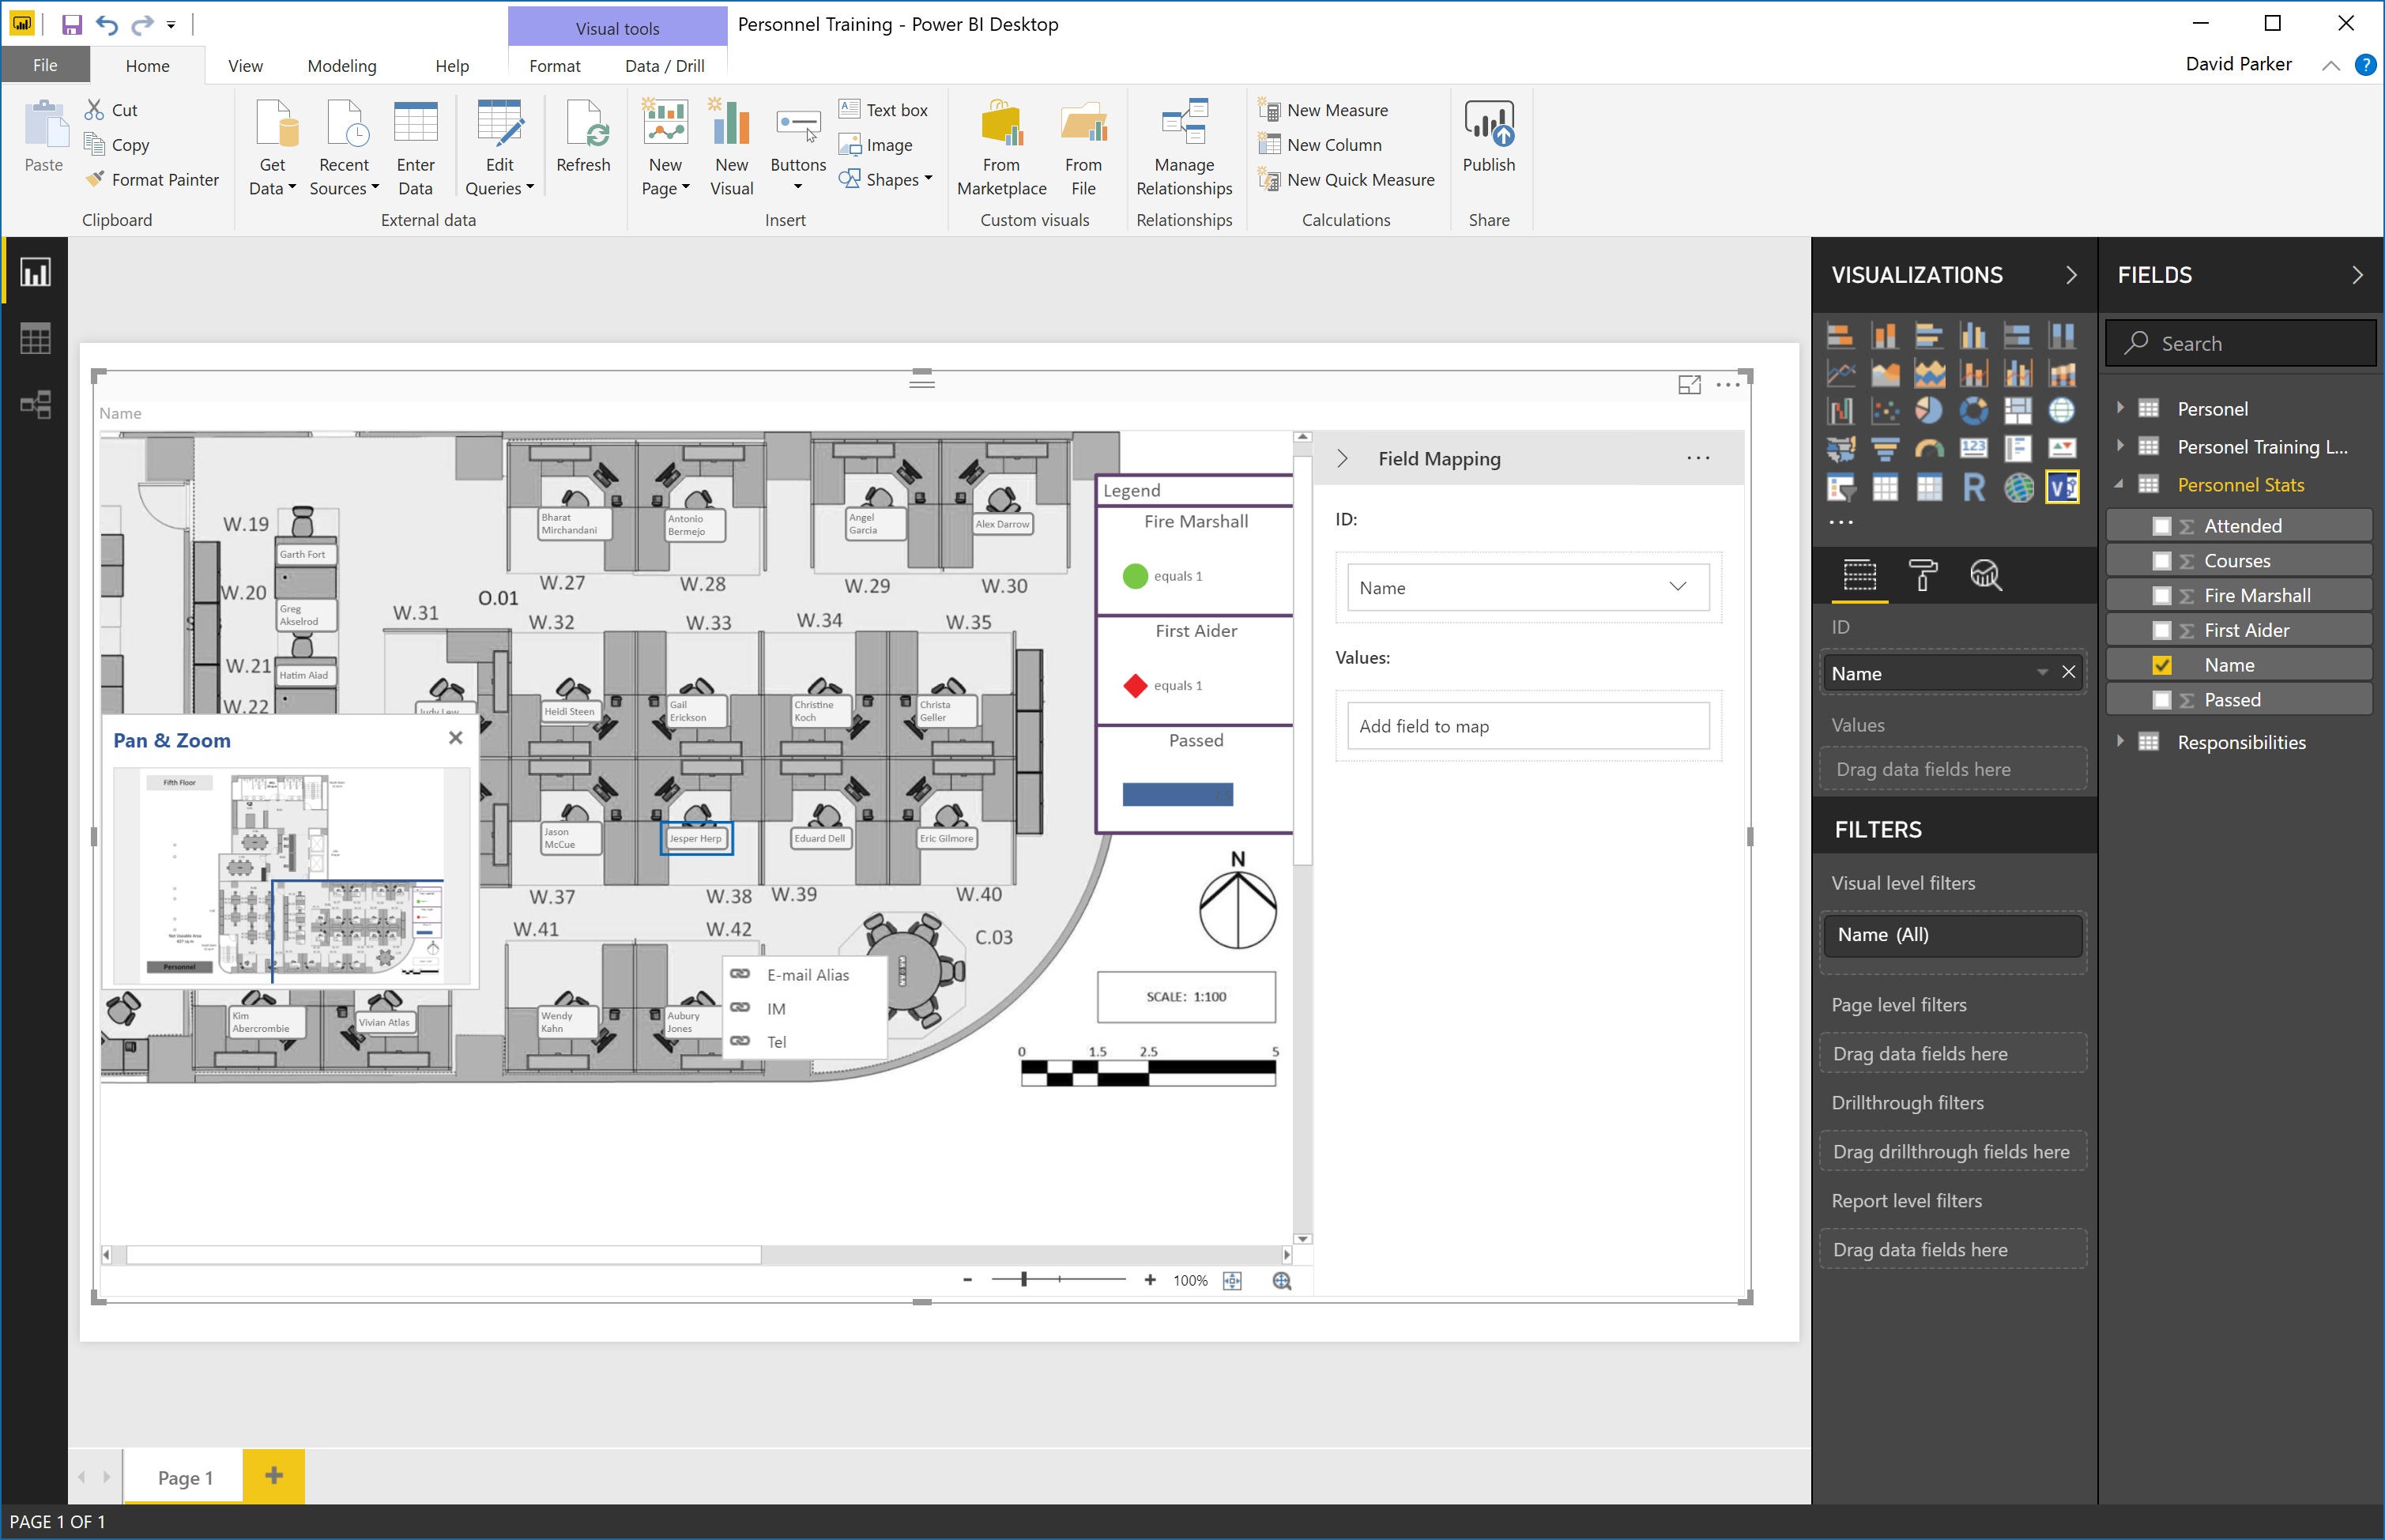
I really enjoy linking data to Visio diagrams, either directly or using the Visio custom visual in Power BI. This visual has the ability to display PowerQuery data as text or color, but not as icons or data bars. These last two features are something that can be used natively in Visio, and automatically updated in Visio Online. I have previously urged Microsoft to add these abilities to the Visio custom visual in Power BI, but there is no sign of it appearing just yet. The custom visual actually removes any Data Graphics ( Text Callouts, Icon Sets, Data Bars or Color by Value) that may already exist in a Visio diagram when it is embedded into Power BI. This reduces the number of shapes in the visual (there is currently a low limit) and, in any case, the data should be displayed from Power BI.
I want to be able to display some data as icons and data bars within the Visio diagram, so what is the alternative? Fortunately, there is a way using text symbol characters and the wonderful Power Query formulas!
Swapping Images in a Visio Shape
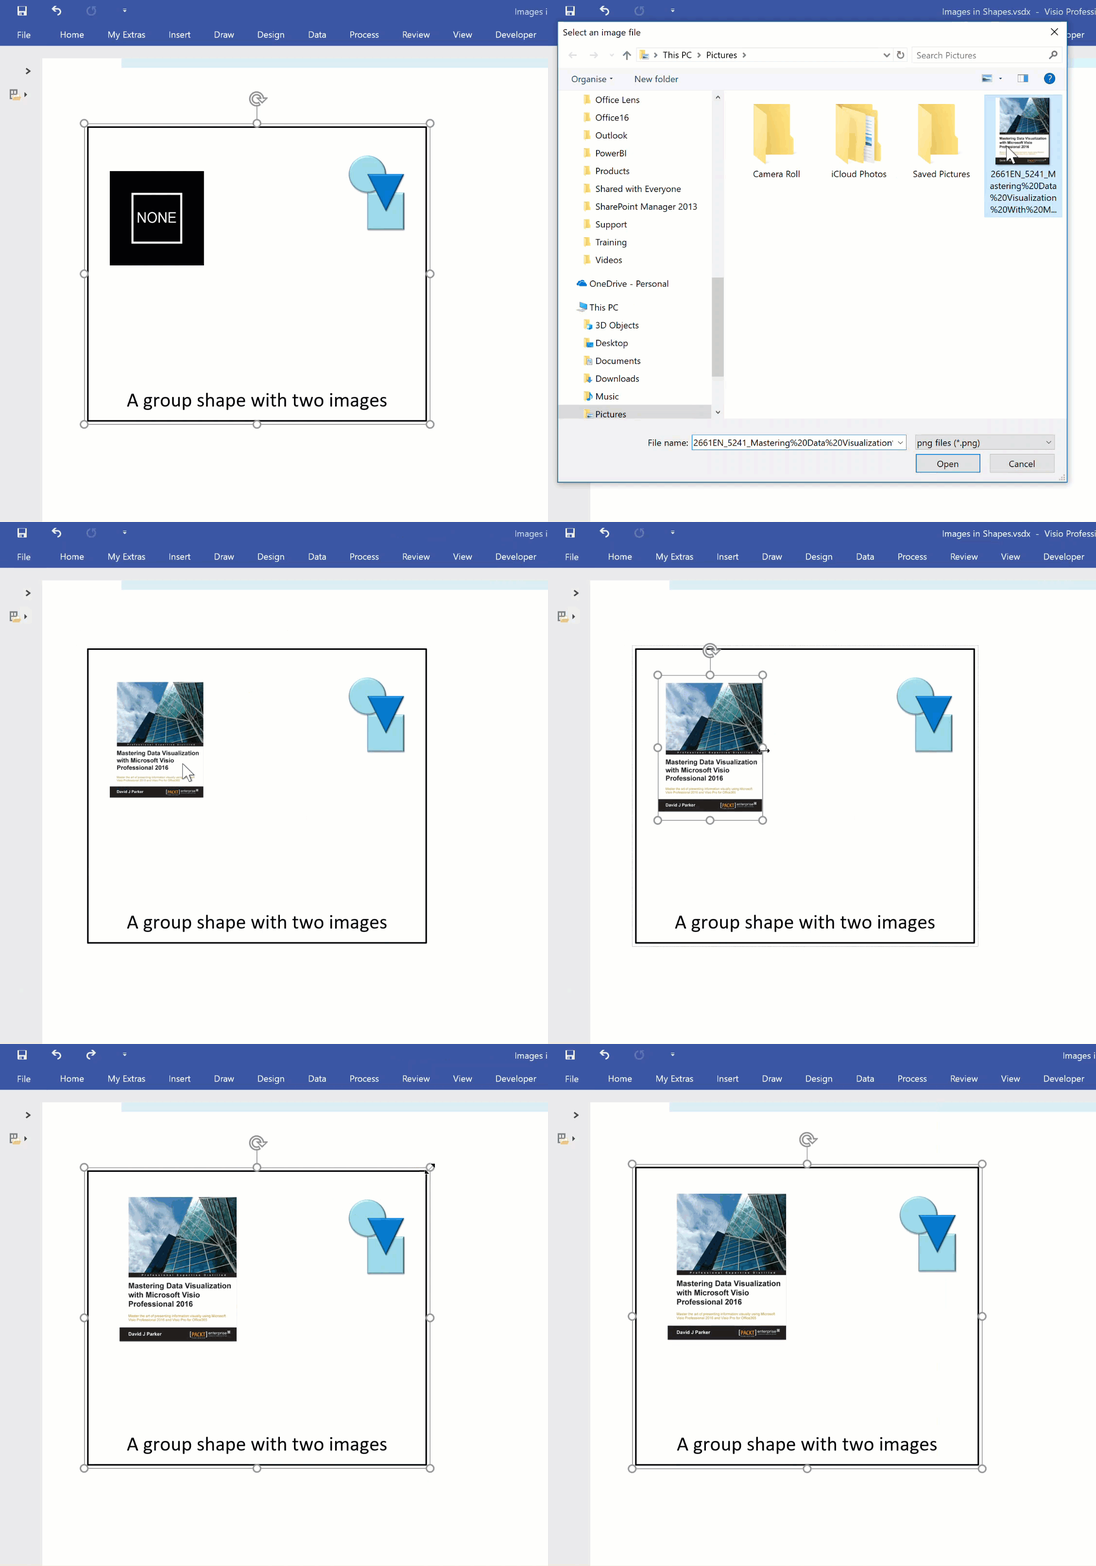
I often include images in Visio diagrams, and sometimes they are part of a group shape. There are times when I need to swap the image for another, and I want the correct width to height ratio for the new image to be applied, otherwise the image will be distorted. I recently realised that the Shape.ChangePicture() function in Visio actually returns this ratio which can then be applied to the shape cells so that the image is not distorted. Therefore I wrote some C# code (in LinqPad) to utilize this method to provide the option to change the image in a selected shape or sub-shape.
So, I wrote this function in C# to swap the image of the shape, and to apply the formulas to maintain its correct aspect ratio, even if the shape is subsequently resized.
