Microsoft recently updated the free Microsoft Visio Viewer (see http://www.microsoft.com/downloads/details.aspx?displaylang=en&FamilyID=f9ed50b0-c7df-4fb8-89f8-db2932e624f7 ). I have updated visViewer (see http://www.bvisual.net/Products/visViewer.aspx ) to use the new version of the Microsoft Visio Viewer which now enables you to view all versions of Visio documents from Visio 5 to Visio 2010 without having Visio installed.
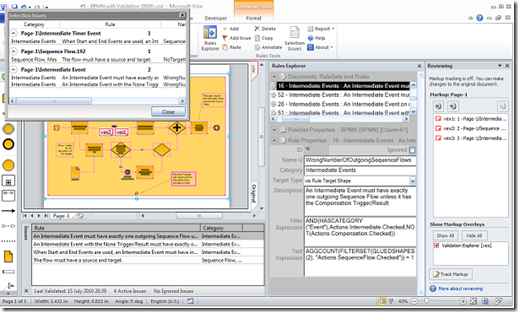
One of the cool things about the Microsoft Visio Viewer is its ability to view reviewer’s markup. Here is an example of a document in Visio with reviewer’s comments:

Here is the same document in bVisual visViewer:

Useful!