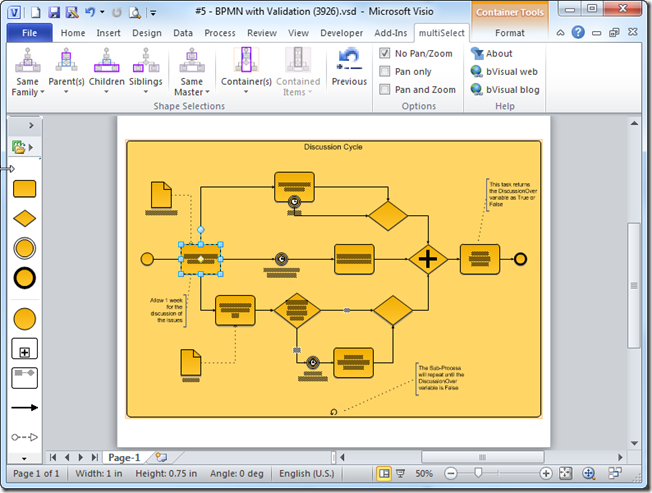
Much as I love using Visio, I have always felt that there are a few selection methods missing, and I often have to some extra buttons into solutions to make up for this. There are many types of diagrams that have shapes connected to each other, usually with a connector shape, and the user needs to be able to traverse these connections quickly and easily, so I have created a Visio 2010 add-in, multiSelect, that adds a lot of different selection methods that are accessible via an extra ribbon tab when ever a shape is selected.
[Read more…] about Multiple Selection Methods for Visio DiagramsShape Design
Selecting Nodes in Visio PivotDiagrams
Microsoft Visio 2007 introduced PivotDiagrams to Visio Professional, and continues unchanged in Visio 2010 (see http://office.microsoft.com/en-us/visio-help/create-a-pivotdiagram-HA010357089.aspx ). These diagrams are a great way to analyse and visualize data by allowing you to breakdown data in a similar manner to PivotTables and PivotCharts in Excel. Any one who has both Microsoft Project and Visio installed will have seen that all of the extra diagram reports are in fact Visio PivotDiagrams. However, I have always found that selecting the nodes you want is difficult. In this article I will explain the problem and provide a solution … a new free add-in called PdSelect.
Update : Added new features 20 Jul 2012
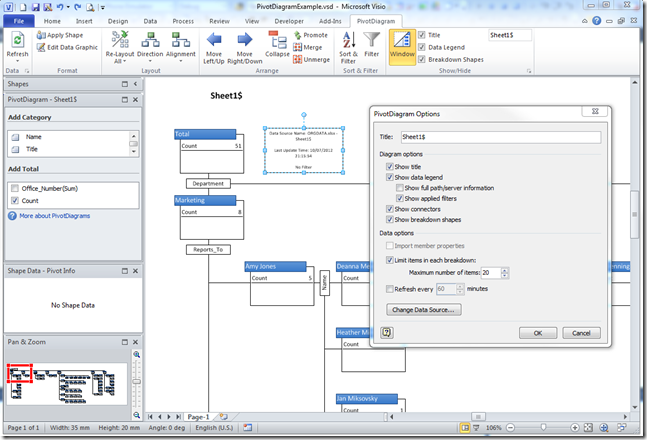
In the following example PivotDiagram, I used the built-in OrgData Excel workbook as the data source. This example workbook is normally used to demonstrate the OrgChart Wizard, but I have used it to provide an alternative breakdown by Department / Reports_To / Name.
[Read more…] about Selecting Nodes in Visio PivotDiagramsCreating a Custom Org Chart Template with Extra Properties
A Visio user recently asked how to add a salary amount for an Org Chart person automatically, based on their selected Level. I thought it was a bit long to answer in the forum, so I have written my answer below. It demonstrates how you can have your own custom template that works with the Organization Chart add-on in Visio.
My approach to creating a custom template that still uses the Organization Chart Add-On is to create a new drawing from the built-in template, and then to add extra properties to it.
First, select Show Document Stencil to view all of the local copies of the built-in master shapes. If they are not there, then simply drag and drop them from the built-in stencil on to the first page, and then delete the shapes on the page. This will not delete the local copies of the masters.
[Read more…] about Creating a Custom Org Chart Template with Extra Properties
Visio Date Format Pictures Affect Data Entry via the Calendar Popup
I have been creating roadmaps in Visio lately, and the client is only concerned with the months and years, so I thought it would be sensible to use a Date Format Picture to display only the month and year in the Shape Data window. What I did not expect is that the mere existence of this Date Format Picture would alter the actual date stored in the cell. In this blog, I layout my concerns about the Calendar popup that is provided for Date type Shape Data rows.
In the following example, I have created a shape, coloured pale orange below, and added 25 Date type Shape Data rows. I have not applied any format to Property1, but then I have applied each of the 17 suggested Date Format Patterns provided on a drop-down list in the Define Shape Data dialog. Finally, I added a further 7 patterns manually. I then selected Today as the value for every single Shape Data row:
[Read more…] about Visio Date Format Pictures Affect Data Entry via the Calendar PopupAdding the Sixth Legend Icon in Visio 2010
In my previous two articles, I described how to have 6 icons in a Data Graphic Icon Set, and provided some VBA code to make your own icons sets from existing Visio shapes or images. One thing that I overlooked was the Insert Legend command in Visio 2010, because it does not add the sixth icon automatically, so this blog describes how to add it. As a side effect, the code also enables the legend labels of icon and CBV (Color By Value) items to be edited.
When you use the Insert Legend command, it examines the Data Graphics used on the active page, to create legends for each Icon Set or Color By Value settings that it finds. Closer examination of the legend shapes, shows that an instance of the Icon Set master shape is added for each of the icons found.
Make Your Own Visio Data Graphic Icons Sets … automatically
In my last post, I showed how you can actually have up to six icons in a Visio Data Graphics Icon Set ( see http://davidjpp.wordpress.com/2012/04/11/how-to-have-six-icons-in-a-visio-data-graphic-icon-set/ ), and I finished by saying that I would now show how to create new icon sets from existing shapes … automatically. In fact, I will show you how to do it with existing SmartShapes or with images.
I was asked to make KPI icons from six weather images:
[Read more…] about Make Your Own Visio Data Graphic Icons Sets … automatically