• Skip to main content
  • Skip to primary sidebar
  • Skip to footer

bVisual

  • Home
  • Services
    • How Visio smartness can help your business
    • Visio visual in Power BI
    • Visio Consulting Services
    • Visio Bureau Services
    • Visio Training and Support Services
  • Products
    • Visio Shape Report Converter
    • SS Plus
    • LayerManager
    • visViewer
    • Metro Icons
    • Rules Tools for Visio
    • The Visio 2010 Sessions App
    • Multi-Language Text for Visio
    • Document Imager for Visio
    • multiSelect for Visio
    • pdSelect for Visio
  • Case Studies
    • Case studies overview
    • Using Visio in Education for GIS
    • Visualizing Construction Project Schedules
    • Visio Online Business Process Mapping
    • Nexans Visio Template
    • CNEE Projects, WorldCom
    • Chase Manhattan Bank
  • News
    • Recent news
    • News archive
  • Resources
    • Articles➡
      • ShapeSheet Functions A-Z
      • Comparing Visio for the Web and Desktop
      • Customising Visio Shapes for the Web App
      • Key differences between the Visio desktop and web apps
      • Using the Visio Data Visualizer in Excel
      • Using Visio in Teams
      • Creating Visio Tabs and Apps for Teams with SharePoint Framework (SPFx)
      • Designing Power Automate Flows with Microsoft Visio
      • Innovative uses of Visio Lists
    • Webcasts ➡
      • Visio in Organizations
      • My session and other Visio sessions at MSIgnite 2019
      • Power up your Visio diagrams
      • Vision up your Visio diagrams
      • The Visio 2010 MVP Sessions
    • Visio Web Learning Resources
    • Books➡
      • Visualize Complex Processes with Microsoft Visio
      • Mastering Data Visualization with Microsoft Visio
      • Microsoft Visio Business Process Diagramming and Validation
      • Visualizing Information with Microsoft Visio
  • Blog
    • Browse blog articles
    • Visio Power BI articles
    • Visio for Web articles
    • A history of messaging and encryption
  • About us
    • About bVisual
    • Testimonials
    • Bio of David Parker
    • Contact Us
    • Website Privacy Policy
    • Website terms and conditions
    • Ariba Network
You are here: Home / Excel / Data Visualizer / Optimize Visio Flowcharts: Swimlane Reordering Tips

Published on December 5, 2024 by David Parker

Optimize Visio Flowcharts: Swimlane Reordering Tips

Microsoft Visio desktop Plan 2 and Professional editions provides the ability to create and synchronize cross-functional flowcharts between the diagram and an Excel table. This is great, and widely used for many types of processes. The Excel table normally has a Function / Swimlane column that contains text that becomes labels on the swimlane containers, and a Phase / Timeline column that contains text that becomes the label of the phase or separator containers. The import provides the option to order the diagram by Function and/or Phase, but it is impossible to get them ordered by both! This article provides a solution using a free macro-enabled Visio stencil.

  • Excel table with Function and Phase columns
  • Visio Data \ Create from Data
  • Step 2 More Options to order by Phase

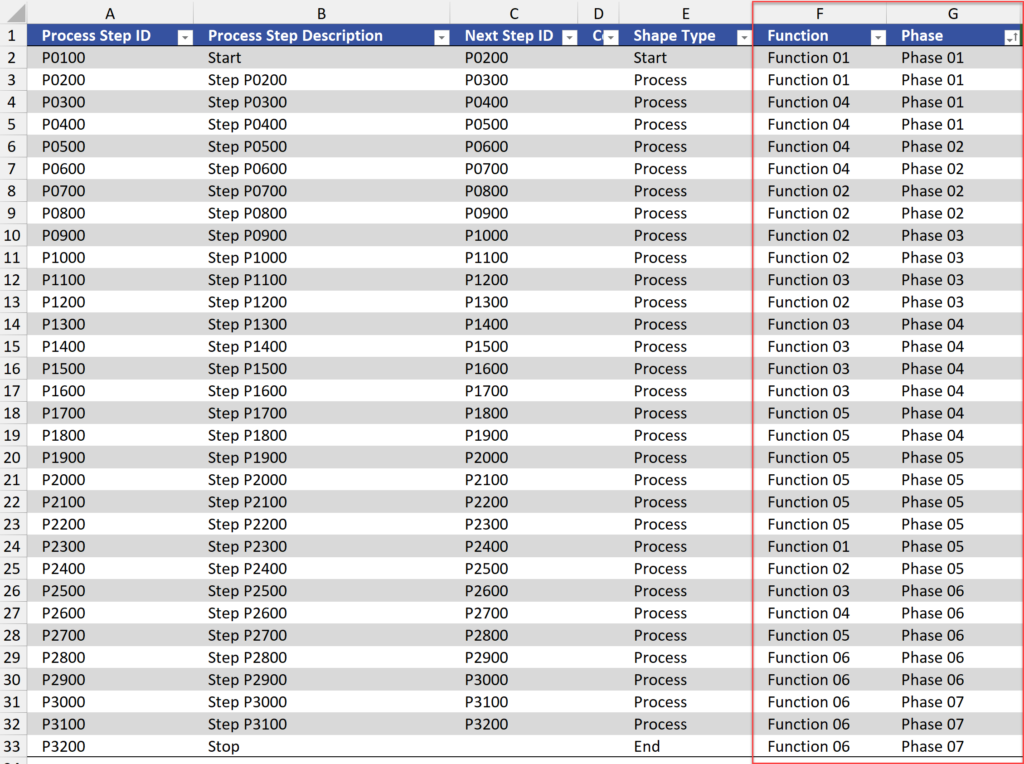
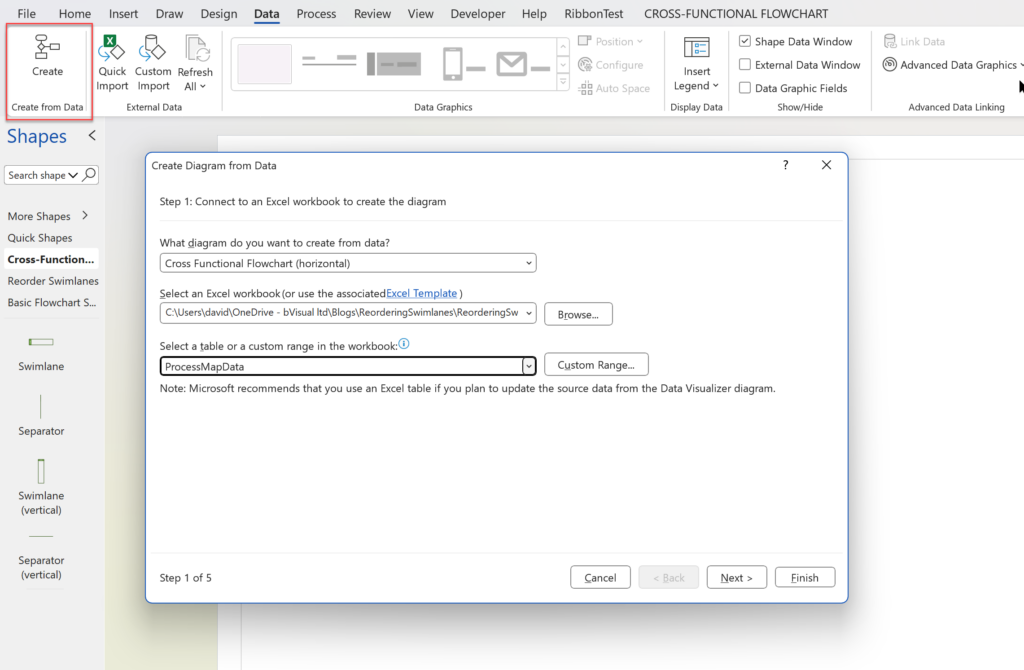
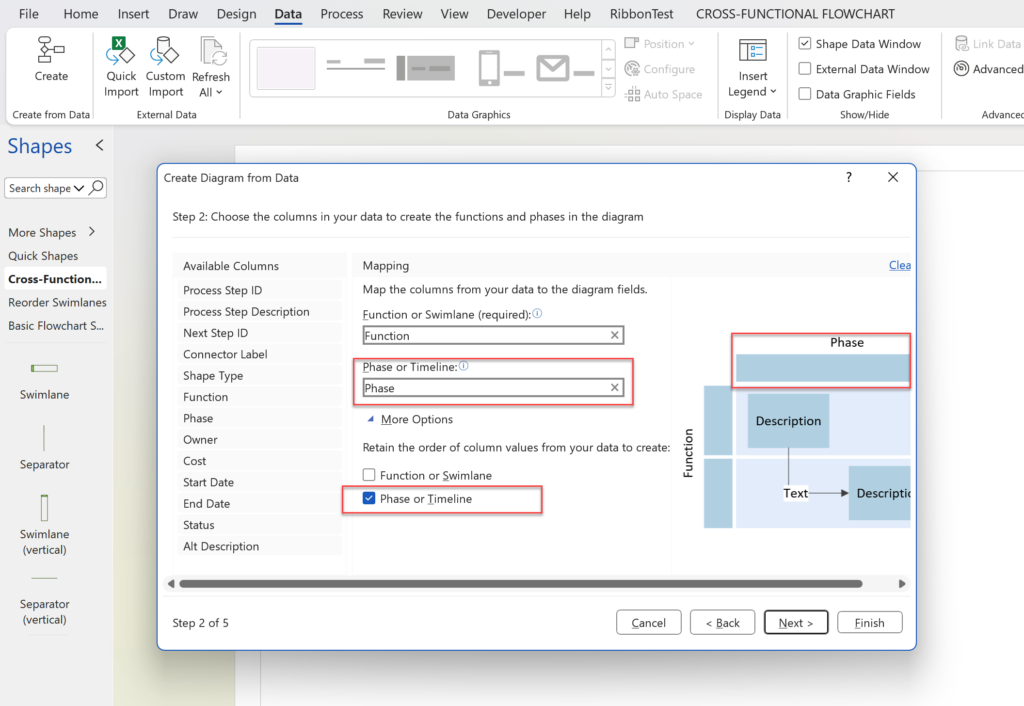
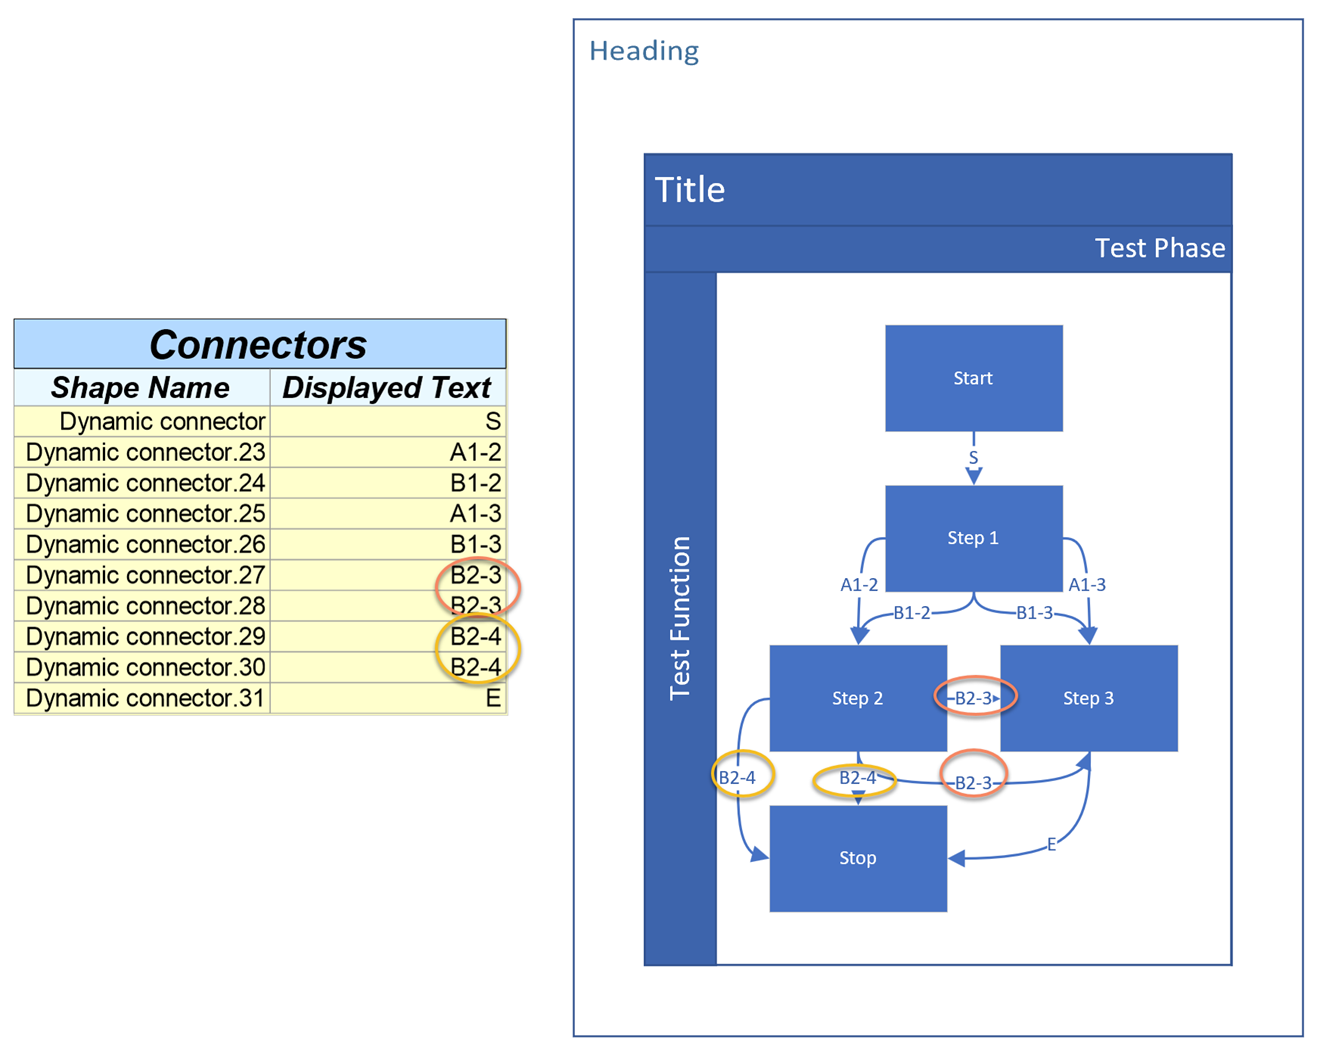
In the above example, the Excel table has been ordered by the values in the Phase column, and the option t order by this column is selected whilst importing using the Visio Data \ Create from Data \ Create button.

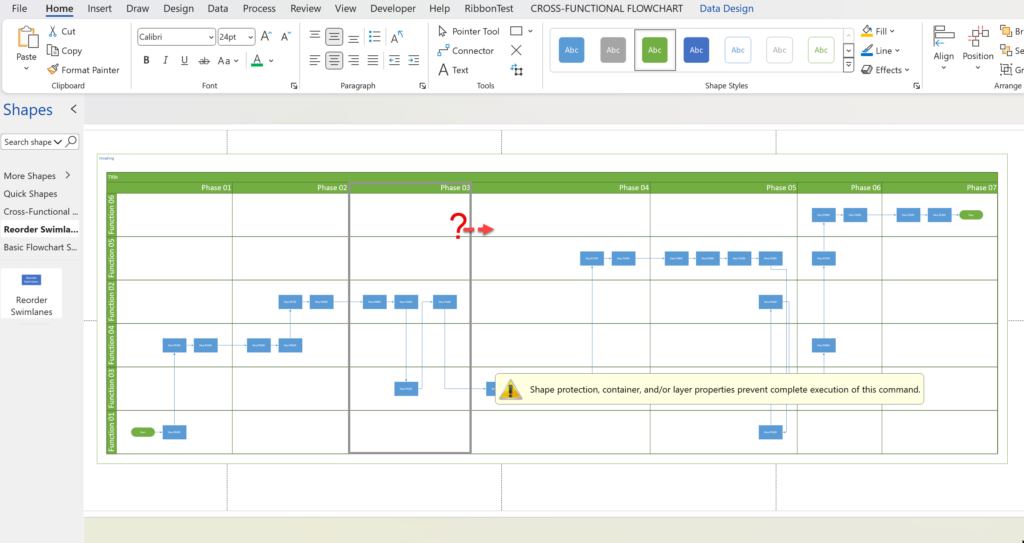
This usually leaves the swimlanes in a random order, but Visio does allow you to move the swimlnae containers manually. However, the Phase \ Separator containers cannot be moved, as shown below.

  • Cross-functional Flowchart ordered by Phase \ Timeline only
  • Function \ Swimlane containers can be moved manually
  • Phase \ Separator shapes cannot be moved manually

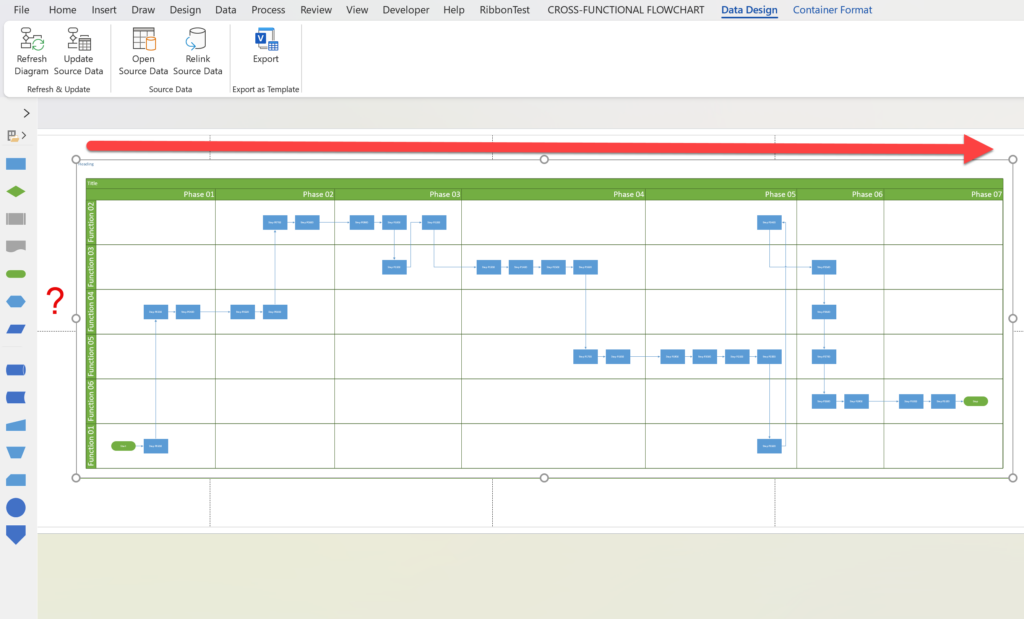
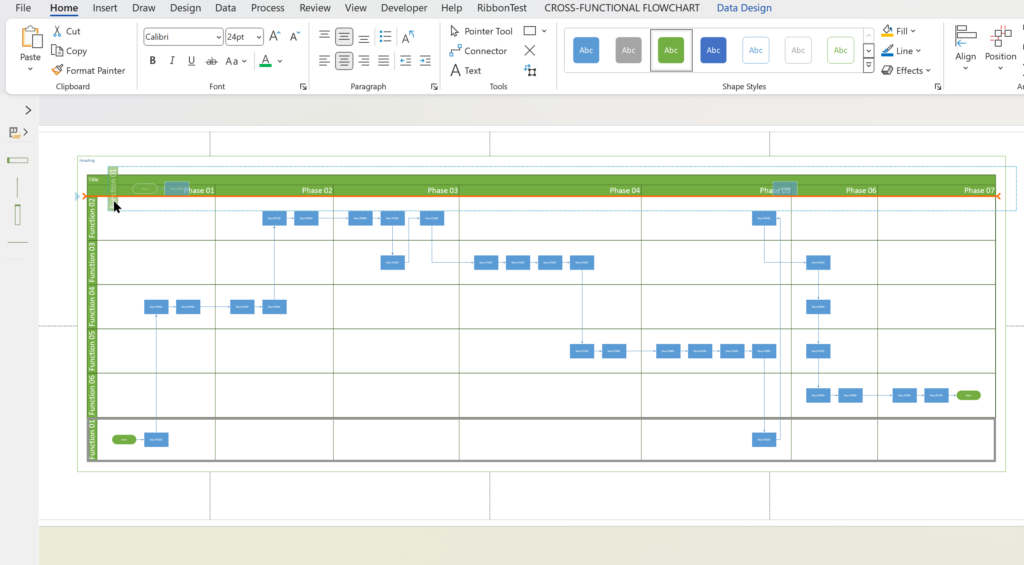
So, the recommendation is to order the imported table by the Phase column, and then re-order the Function swimlanes once the diagram has been created. However, this can be tedious, especially on larger pages where it is difficult to read the text whilst seeing the overall effect.

So, I wrote a macro to assist with the re-ordering of the swimlanes, and packaged them into a macro-enabled stencil which I have zipped up. The file at Reorder Swimlanes.zip file should be downloaded, unzipped, and the enclosed Reorder Swimlanes.vssm file placed into the My Shapes folder. It should then become available to open like a normal stencil, and if signed macros are allowed, dragging and dropping the Reorder Swimlanes shape onto a page that contains a cross-functional flowchart. The Reorder Swimlanes Lists dialog should open listing all of the swimlanes in their existing order.

  • Drag and drop Reorder Swimlanes shape onto the page
  • The Functions can then be automatically reordered by ascending values
  • … or reordered by descending values
  • … or each row can be moved

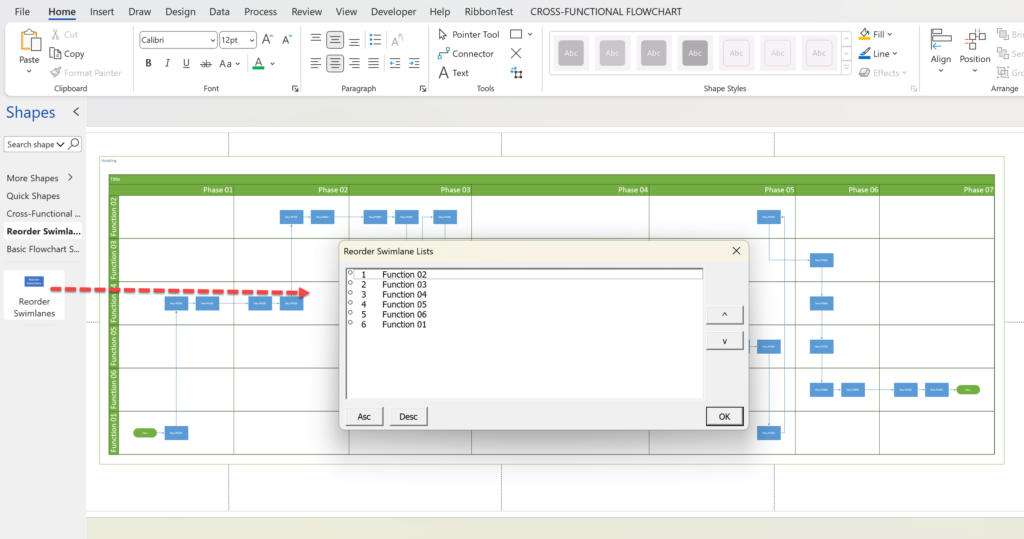
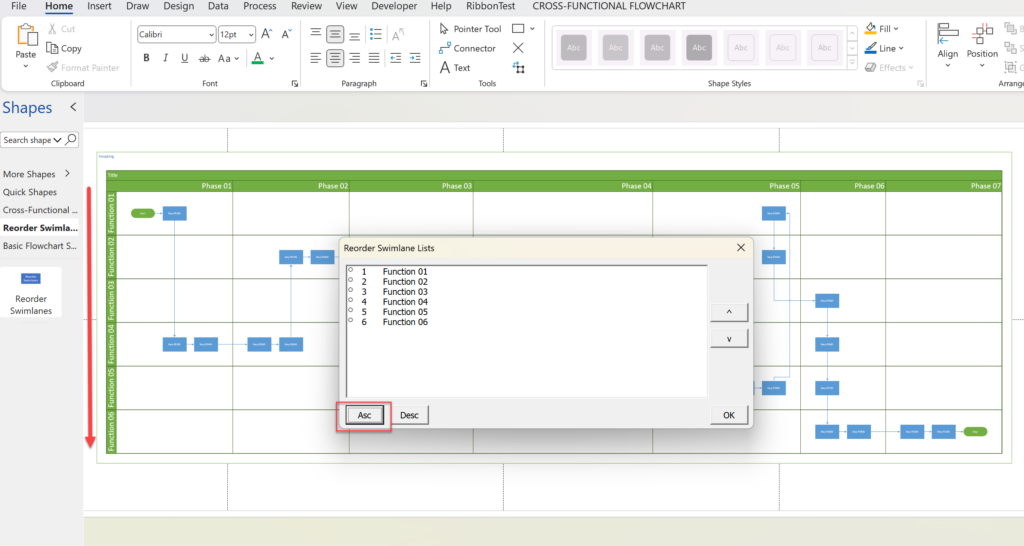
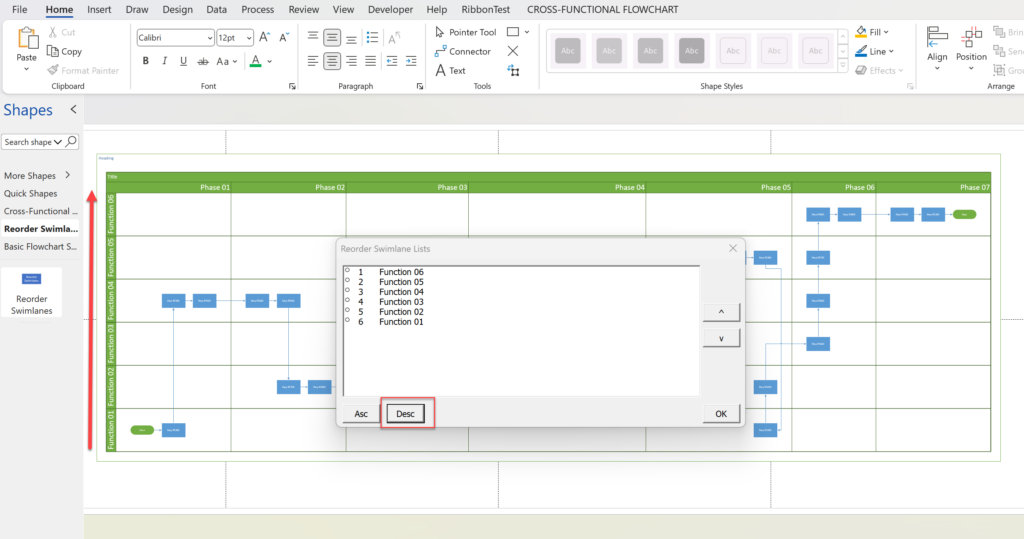
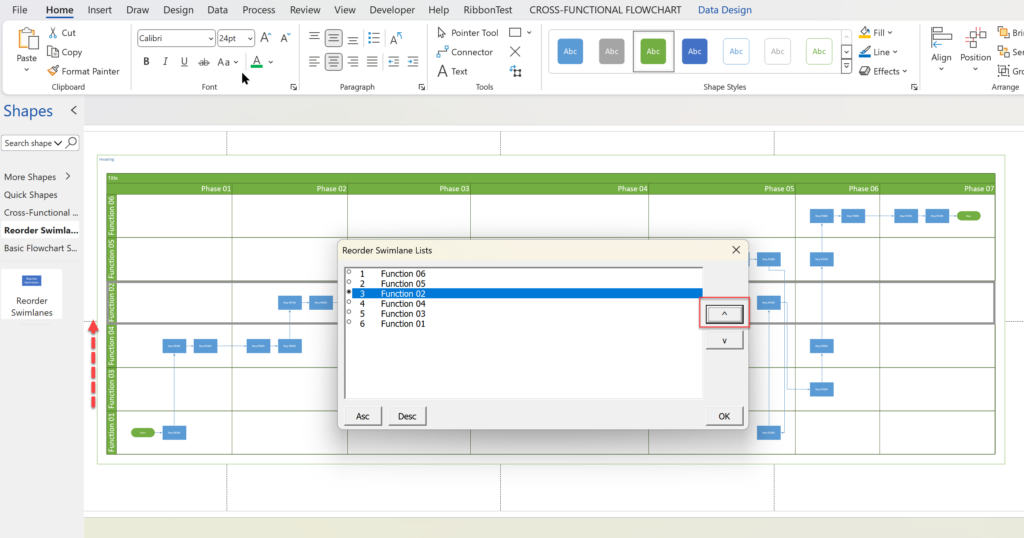
The user can then reorder the swimlanes automatically using the label text on the swimlanes, either in ascending or descending order. Alterrnatively, each row can be selected and moved up or down individually.

QED

Related articles

Linking Data to Shapes in Visio after using Data Visualizer

Data Visualizer (DV) in Visio Plan 2 (Data | Create from Data | Create ) is great because it provides a way of automatically creating a diagram from data, but it also prevents some of the other data-linking features in Visio from being used. This is because DV wants to take control of the data…

My new book on Visualizing Processes with Microsoft Visio has launched

Back in the early 1990s, there was an application called ABC Flowcharter that was the market leader for diagramming business flowcharts, but some of the brains behind Aldus PageMaker saw an opportunity to create something smarter, and left to write the Visio product, with the stated aim to overtake ABC Flowcharter within 2 years. They…

Pushing Data Visualizer in Visio beyond its limits

My last post was about some of the lessons learnt when trying to push Data Visualizer to its limits, but this one has some ways of overcoming these limitations. The main lesson learnt is that DV binds the shapes within the DV container shape, CFF Data Visualizer, and controls some of the ShapeSheet cells that…

Pushing Data Visualizer in Visio to the limits!

Regular readers of my blog will know that I like to use the Data Visualizer (DV) in Visio Plan 2, but I recently tried to help a user who really decided to push it to the limits. In this scenario, there were multiple connections, but with different labels, being created between the same flowchart shapes,…

Teams Tuesday Podcast Recording about Visio

I am delighted to share the link to my recent demonstration and conversation with fellow MVP Peter Ward about Visio in Teams. We discussed more than just Visio … and I look a bit like Max Headroom! (more…)

Binding Visio and Excel with Data Visualizer

I re-vamped some of my content about the Visio Data Visualizer add-in for Excel in my last post, so I thought I should expand a bit more on the Data Visualizer feature in Visio for Desktop (Visio Plan 2) and Excel for Desktop. I have described it in detail in previous posts, but I never…

Related

Filed Under: Data Visualizer, Excel, Process Flows, VBA, Visio for Desktop Tagged With: Data Visualizer, Excel, Processes, VBA, Visio for the desktop

About David Parker

David Parker has 25 years' experience of providing data visualization solutions to companies around the globe. He is a Microsoft MVP and Visio expert.

Reader Interactions

Leave a Reply Cancel reply

Your email address will not be published. Required fields are marked *

Primary Sidebar

  • LinkedIn
  • Twitter

Recent Posts

  • Fixing dimensions of 2D shapes
  • Merging Linked Data from Similar Tables
  • Smart Radio Buttons and Check Boxes in Visio
  • Using Button Face Ids in Visio
  • Grid Snapping Revisited

Categories

Tags

Accessibility Add-Ins Connectors Containers Data Export Data Graphics Data Import Data Visualizer Educational Excel GraphDatabase Hyperlinks Icon Sets JavaScript LayerManager Layers Legend Link Data to Shapes Lists MSIgnite MVP Office365 Org Chart PowerApps PowerBI PowerQuery Processes Setup and Deployment Shape Data Shape Design ShapeSheet ShapeSheet Functions SharePoint 2013 SQL Teams Validation VBA Video Visio Visio 2007 Visio for the Web Visio Online Visio Services Visio Viewer Webinar

Footer

bVisual Profile

The UK-based independent Visio consultancy with a worldwide reach. We have over 25 years experience of providing data visualization solutions to companies around the globe.

Learn more about bVisual

  • Amazon
  • E-mail
  • Facebook
  • LinkedIn
  • Twitter
  • YouTube

Search this website

Recent posts

  • Fixing dimensions of 2D shapes
  • Merging Linked Data from Similar Tables
  • Smart Radio Buttons and Check Boxes in Visio
  • Using Button Face Ids in Visio
  • Grid Snapping Revisited

Copyright © 2025 · Executive Pro on Genesis Framework · WordPress · Log in