There are times that I have been caught out by assuming that everyone speaks “proper” English, like what I do (sic), and forgetting that there are other languages with their own formatting conventions. I think most of the world is bemused at the USA date format where they put the month before the day and the year. So illogical to everyone else, and I can’t help thinking that it was done on purpose just to catch us Brits out, like when they decided to drive on the wrong side of the road just to make it more difficult to sell cars across the border. It seems that some parts of Visio get confused if I enter the dates in the correct “dd/mm/yyyy” format, so I now type dates in the “d mmm yyyy” format in the Shape Data window calendar control because, at least, that always works. Also Visio‘s internal units are inches, and every time I see it referred to as US Units, rather than the Imperial Units that I grew up with, makes me think “so, this is what it has come to!”.
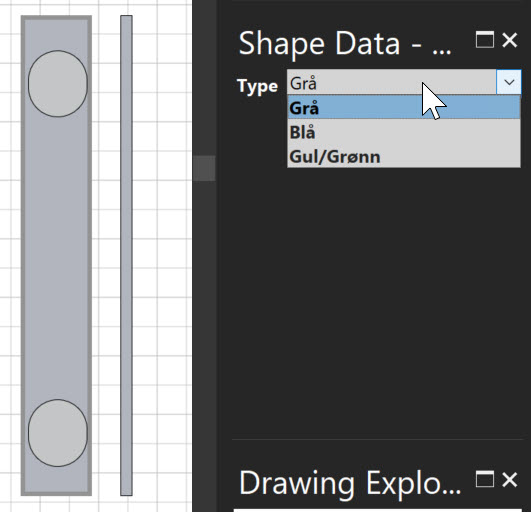
So today I was embarrassed by a Norwegian client because I forgot (again) to take extra care when using the RGB(…) function. The result was that the displayed colours were appearing black in Norwegian (and doubtless many other languages), but correctly grey (gray if you are in the USA), blue, green and yellow in English (both UK and US).
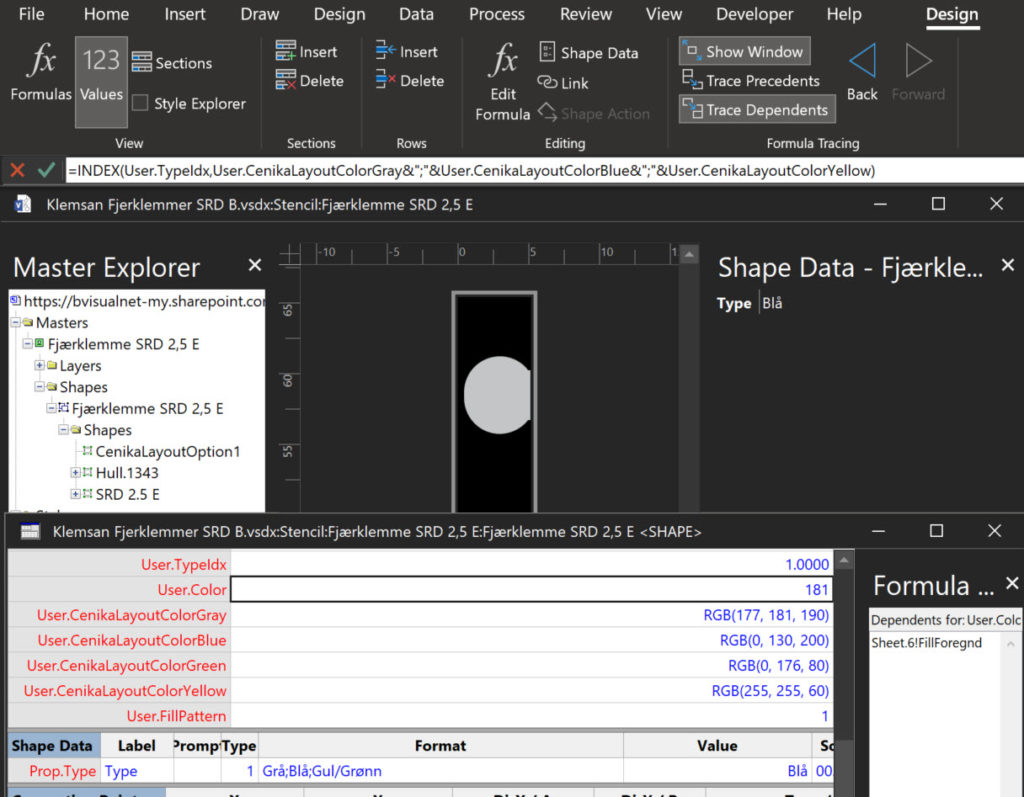
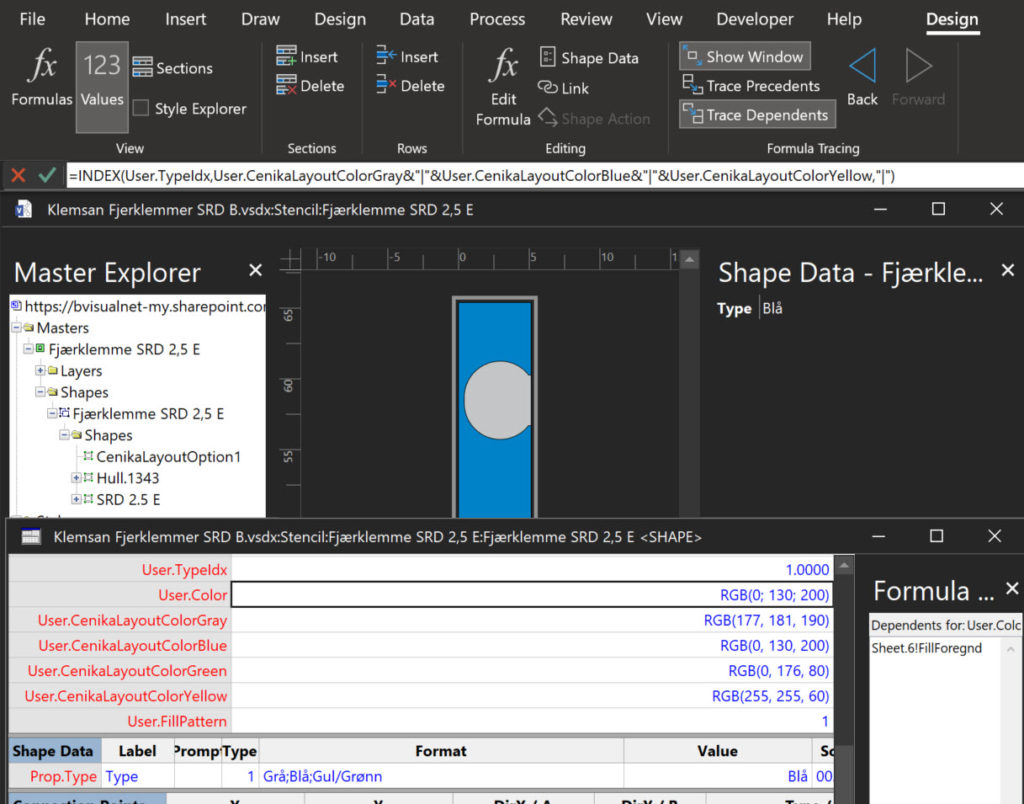
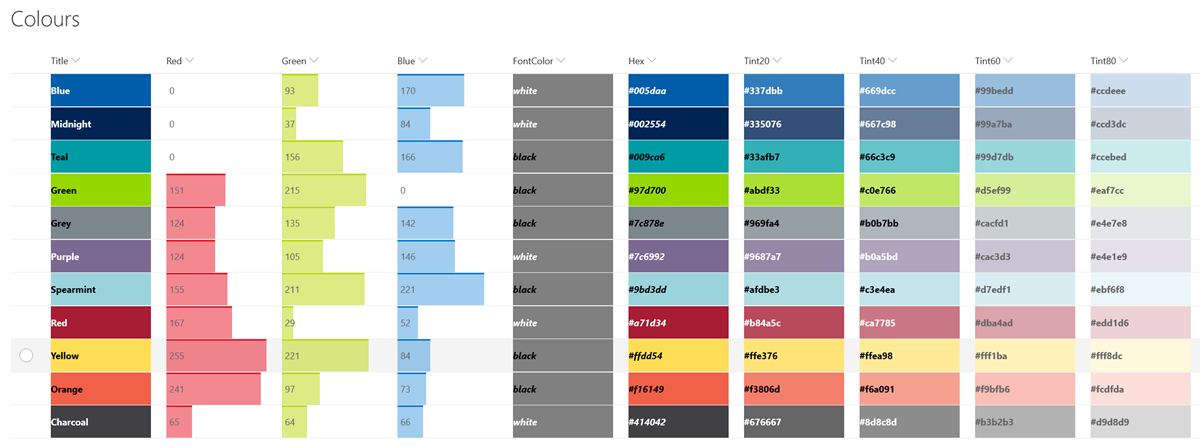
If you examine the images above, you will see that the User-defined Cells for each named colour are displaying the RGB function with the numbers separated by a comma. That much is correct, but the User.Color value is 181, which is only the second number of the User.CenikaLayoutColorGray value, RGB(177,181, 190). So, what is happening?
Firstly, the number 181 is way above any value of the index of the 24 default colours available to the FillForegnd cell, so it displays as black. Secondly, it is splitting the values on the commas, so I need to explain why.
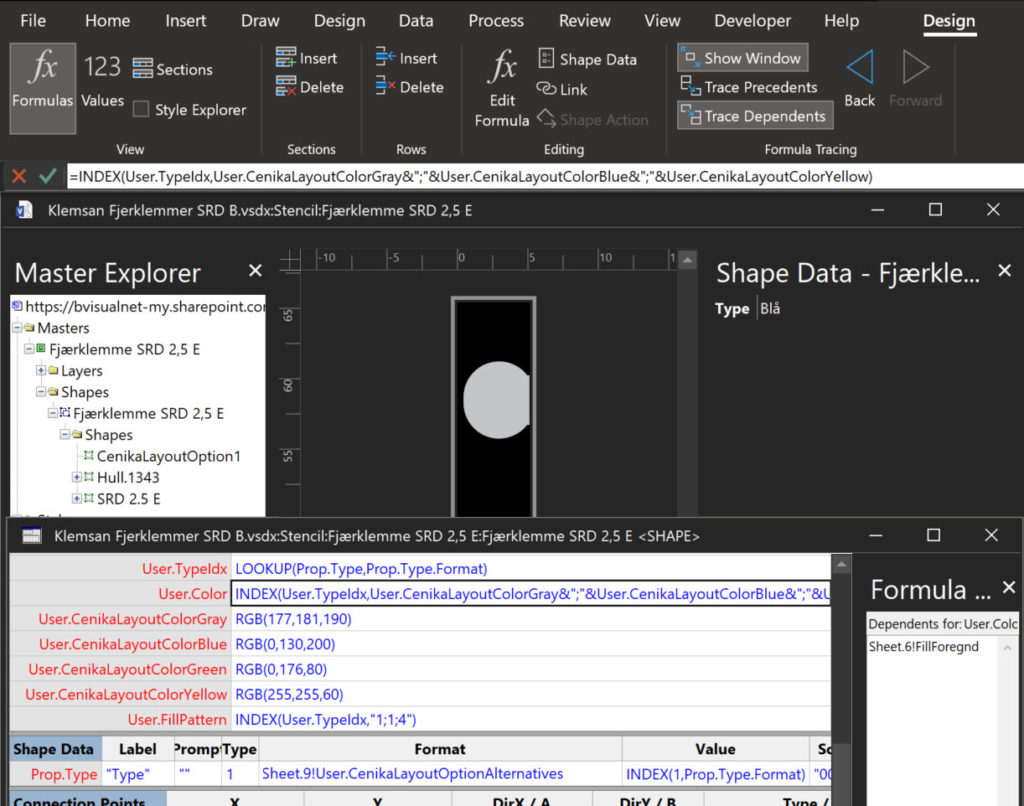
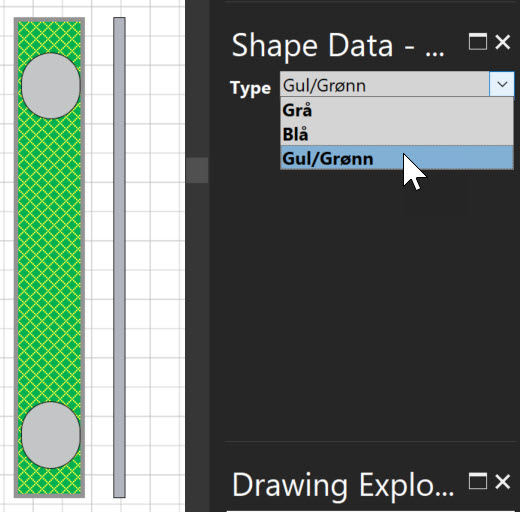
The user selects in the fixed-list Prop.Type Shape Data row. The choices are stored as semi-colon separated values in the Prop.Type.Format cell (Grey;Blue;Yellow/Green):
="Grå;Blå;Gul/Grønn"The default list separator for Visio is the semi-colon, and the default formula in the Prop.Type.Value cell updated by the selection in the drop-down is:
=INDEX(n,Prop.Type.Format)where n is inclusively between 0 and 2.
The User.TypeIdx cell has a formula:
=LOOKUP(Prop.Type,Prop.Type.Format)This correctly returns a value between 0 and 2, which is then used to get the corresponding RGB value in the User.Color cell:
=INDEX(User.TypeIdx,RGB(177,181,190)&";"&RGB(0,130,200)&";"&RGB(0,176,80))This is a construct that I do frequently, but it ignores the fact that many languages use the semi-colon as a list separator.
To test this, I only need to change the Settings / Regional Format to a suitable non-English language, like Norwegian.
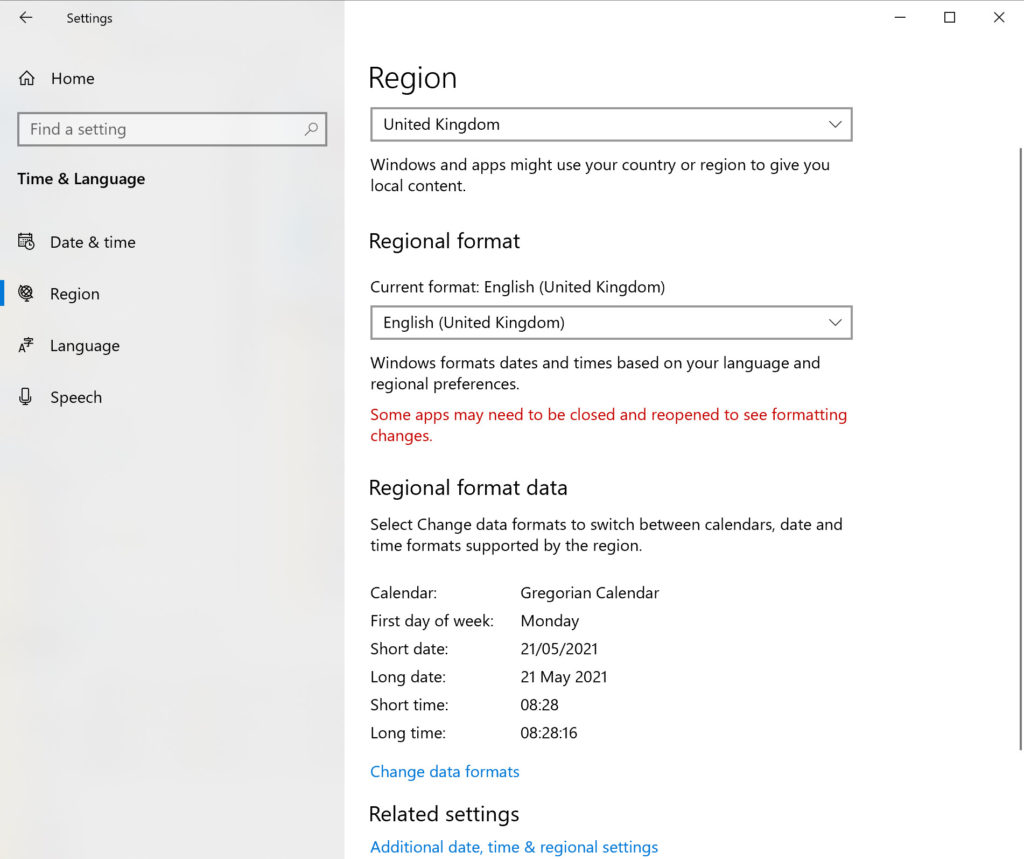
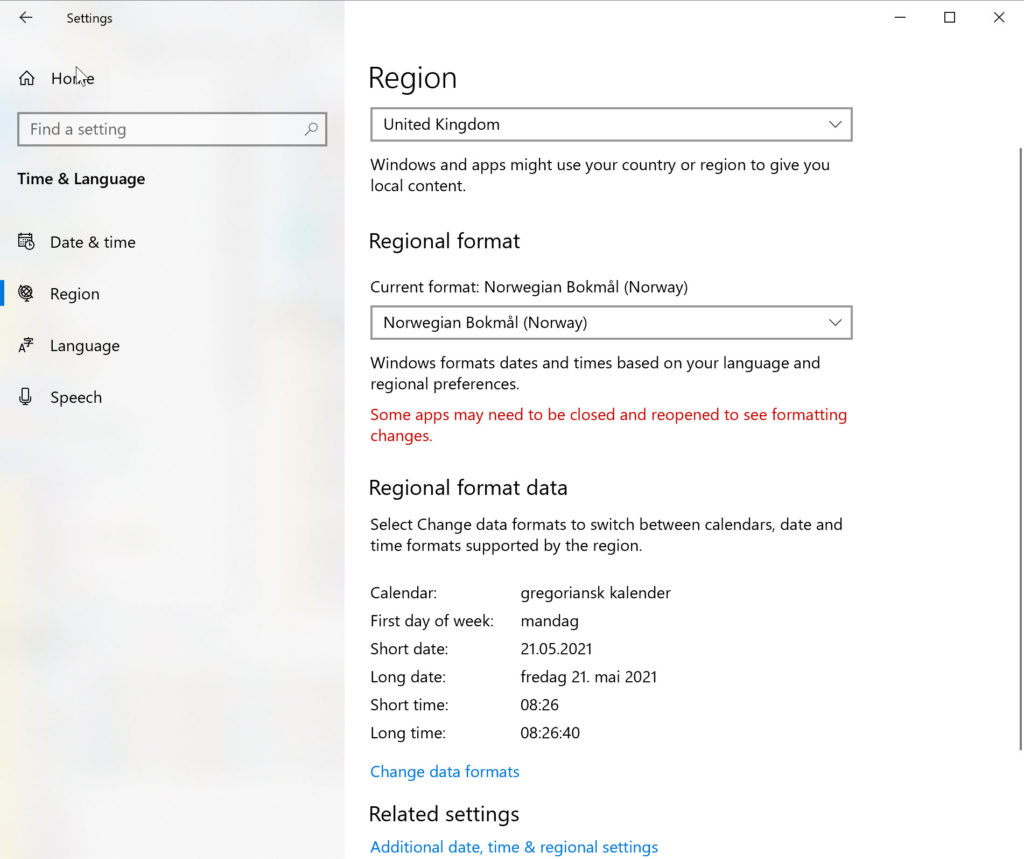
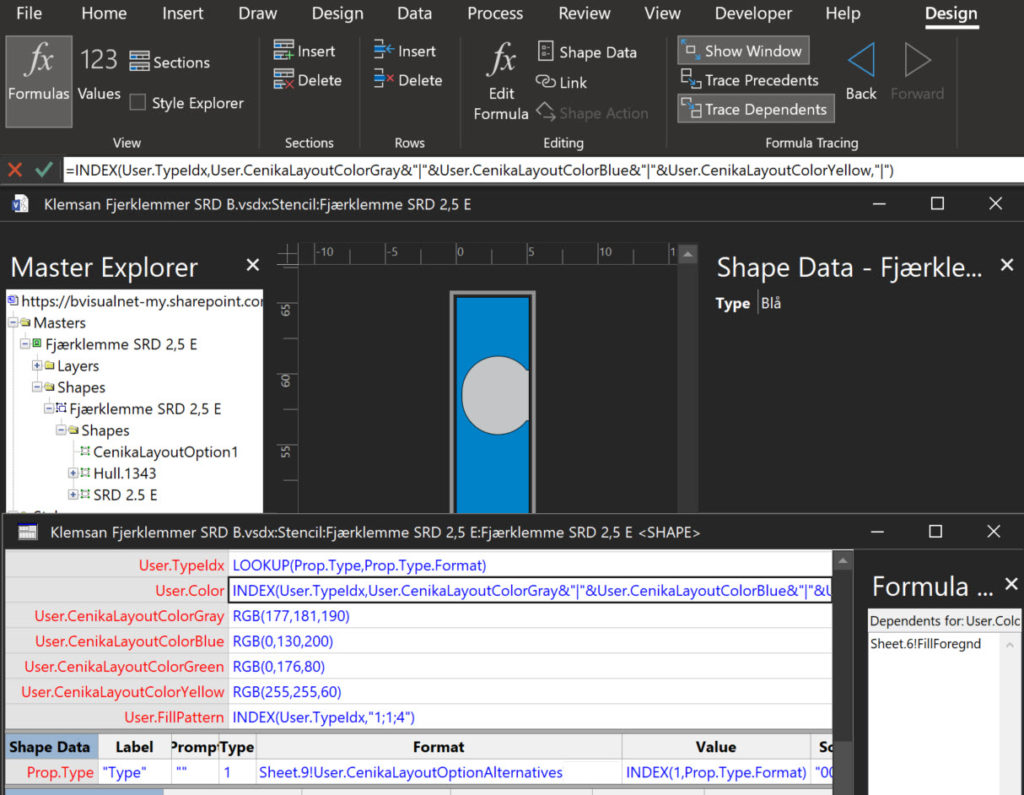
Then I can test the effect it has on this formula in Visio. The answer is to use any suitable character, such as the pipe character, to separate the individual colours in the list, and then specify that character in the optional third parameter of the INDEX(…) function:
=INDEX(User.TypeIdx,=INDEX(User.TypeIdx,User.CenikaLayoutColorGray&"|"&User.CenikaLayoutColorBlue&"|"&User.CenikaLayoutColorYellow,"|")which evaluates to:
=INDEX(User.TypeIdx,RGB(177,181,190)&"|"&RGB(0,130,200)&"|"&RGB(0,176,80),"|")So now everything looks ok, and the value of the User.Color cell displays with semi-colon separators in Norwegian, but with comma separators in English:
Notice how the values of the named color rows still display with comma separators above. This is because these rows are not string values, but the User.Color value is a string that is evaluated.
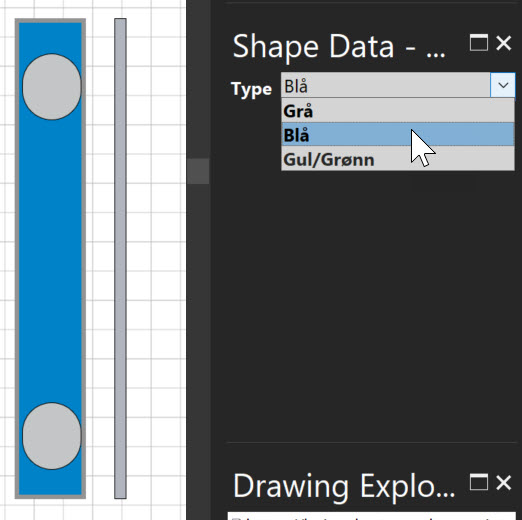
So now the user can select the colour choice in the Shape Data window, and everything displays correctly, regardless of the language.
All I need to do now is to remember this next time!
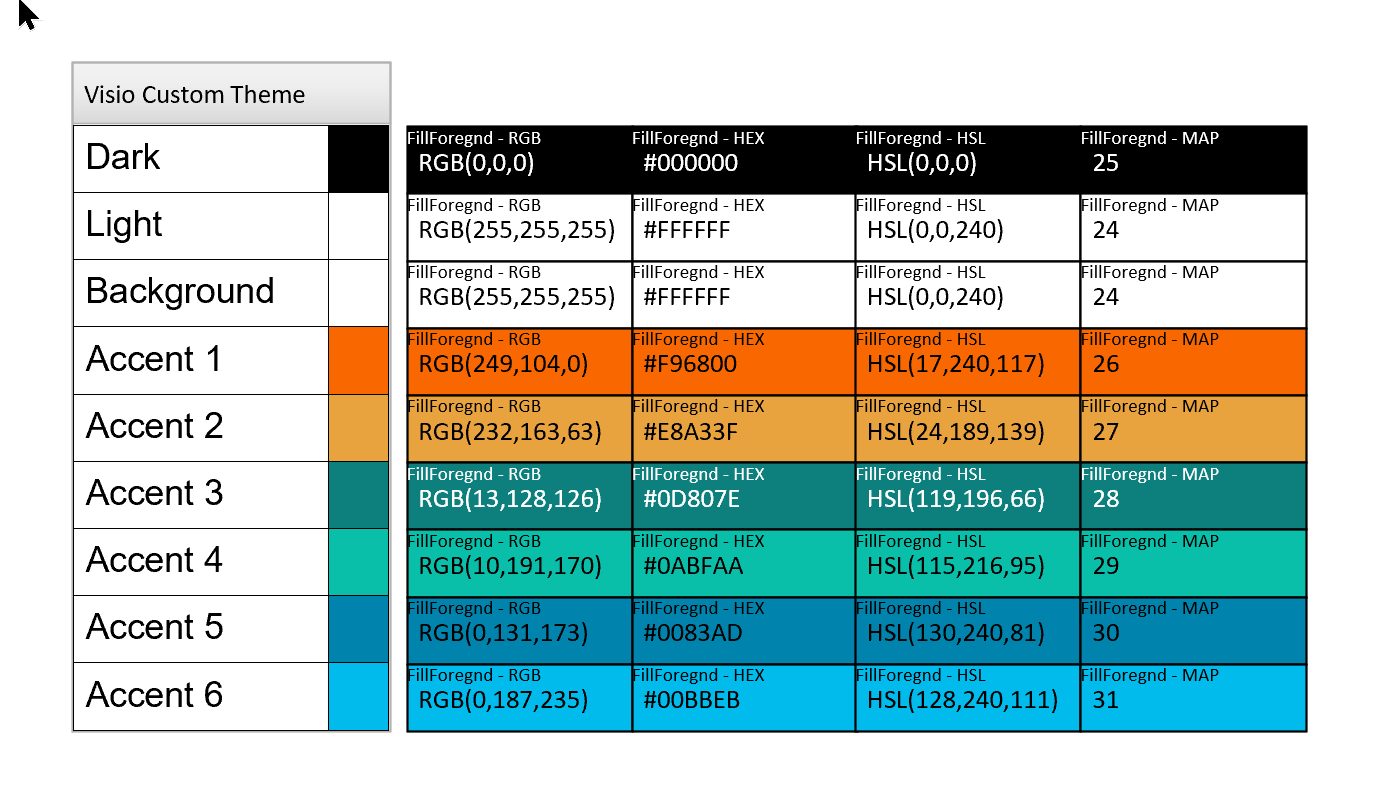
Custom Color Themes in Visio?
I was recently looking into custom color themes for corporate branding in desktop Microsoft Visio and became re-aware how different Visio still is from the rest of the Microsoft Office applications. A Visio page or document does not need to have any theme applied, but the documents of the other Office applications always have a…
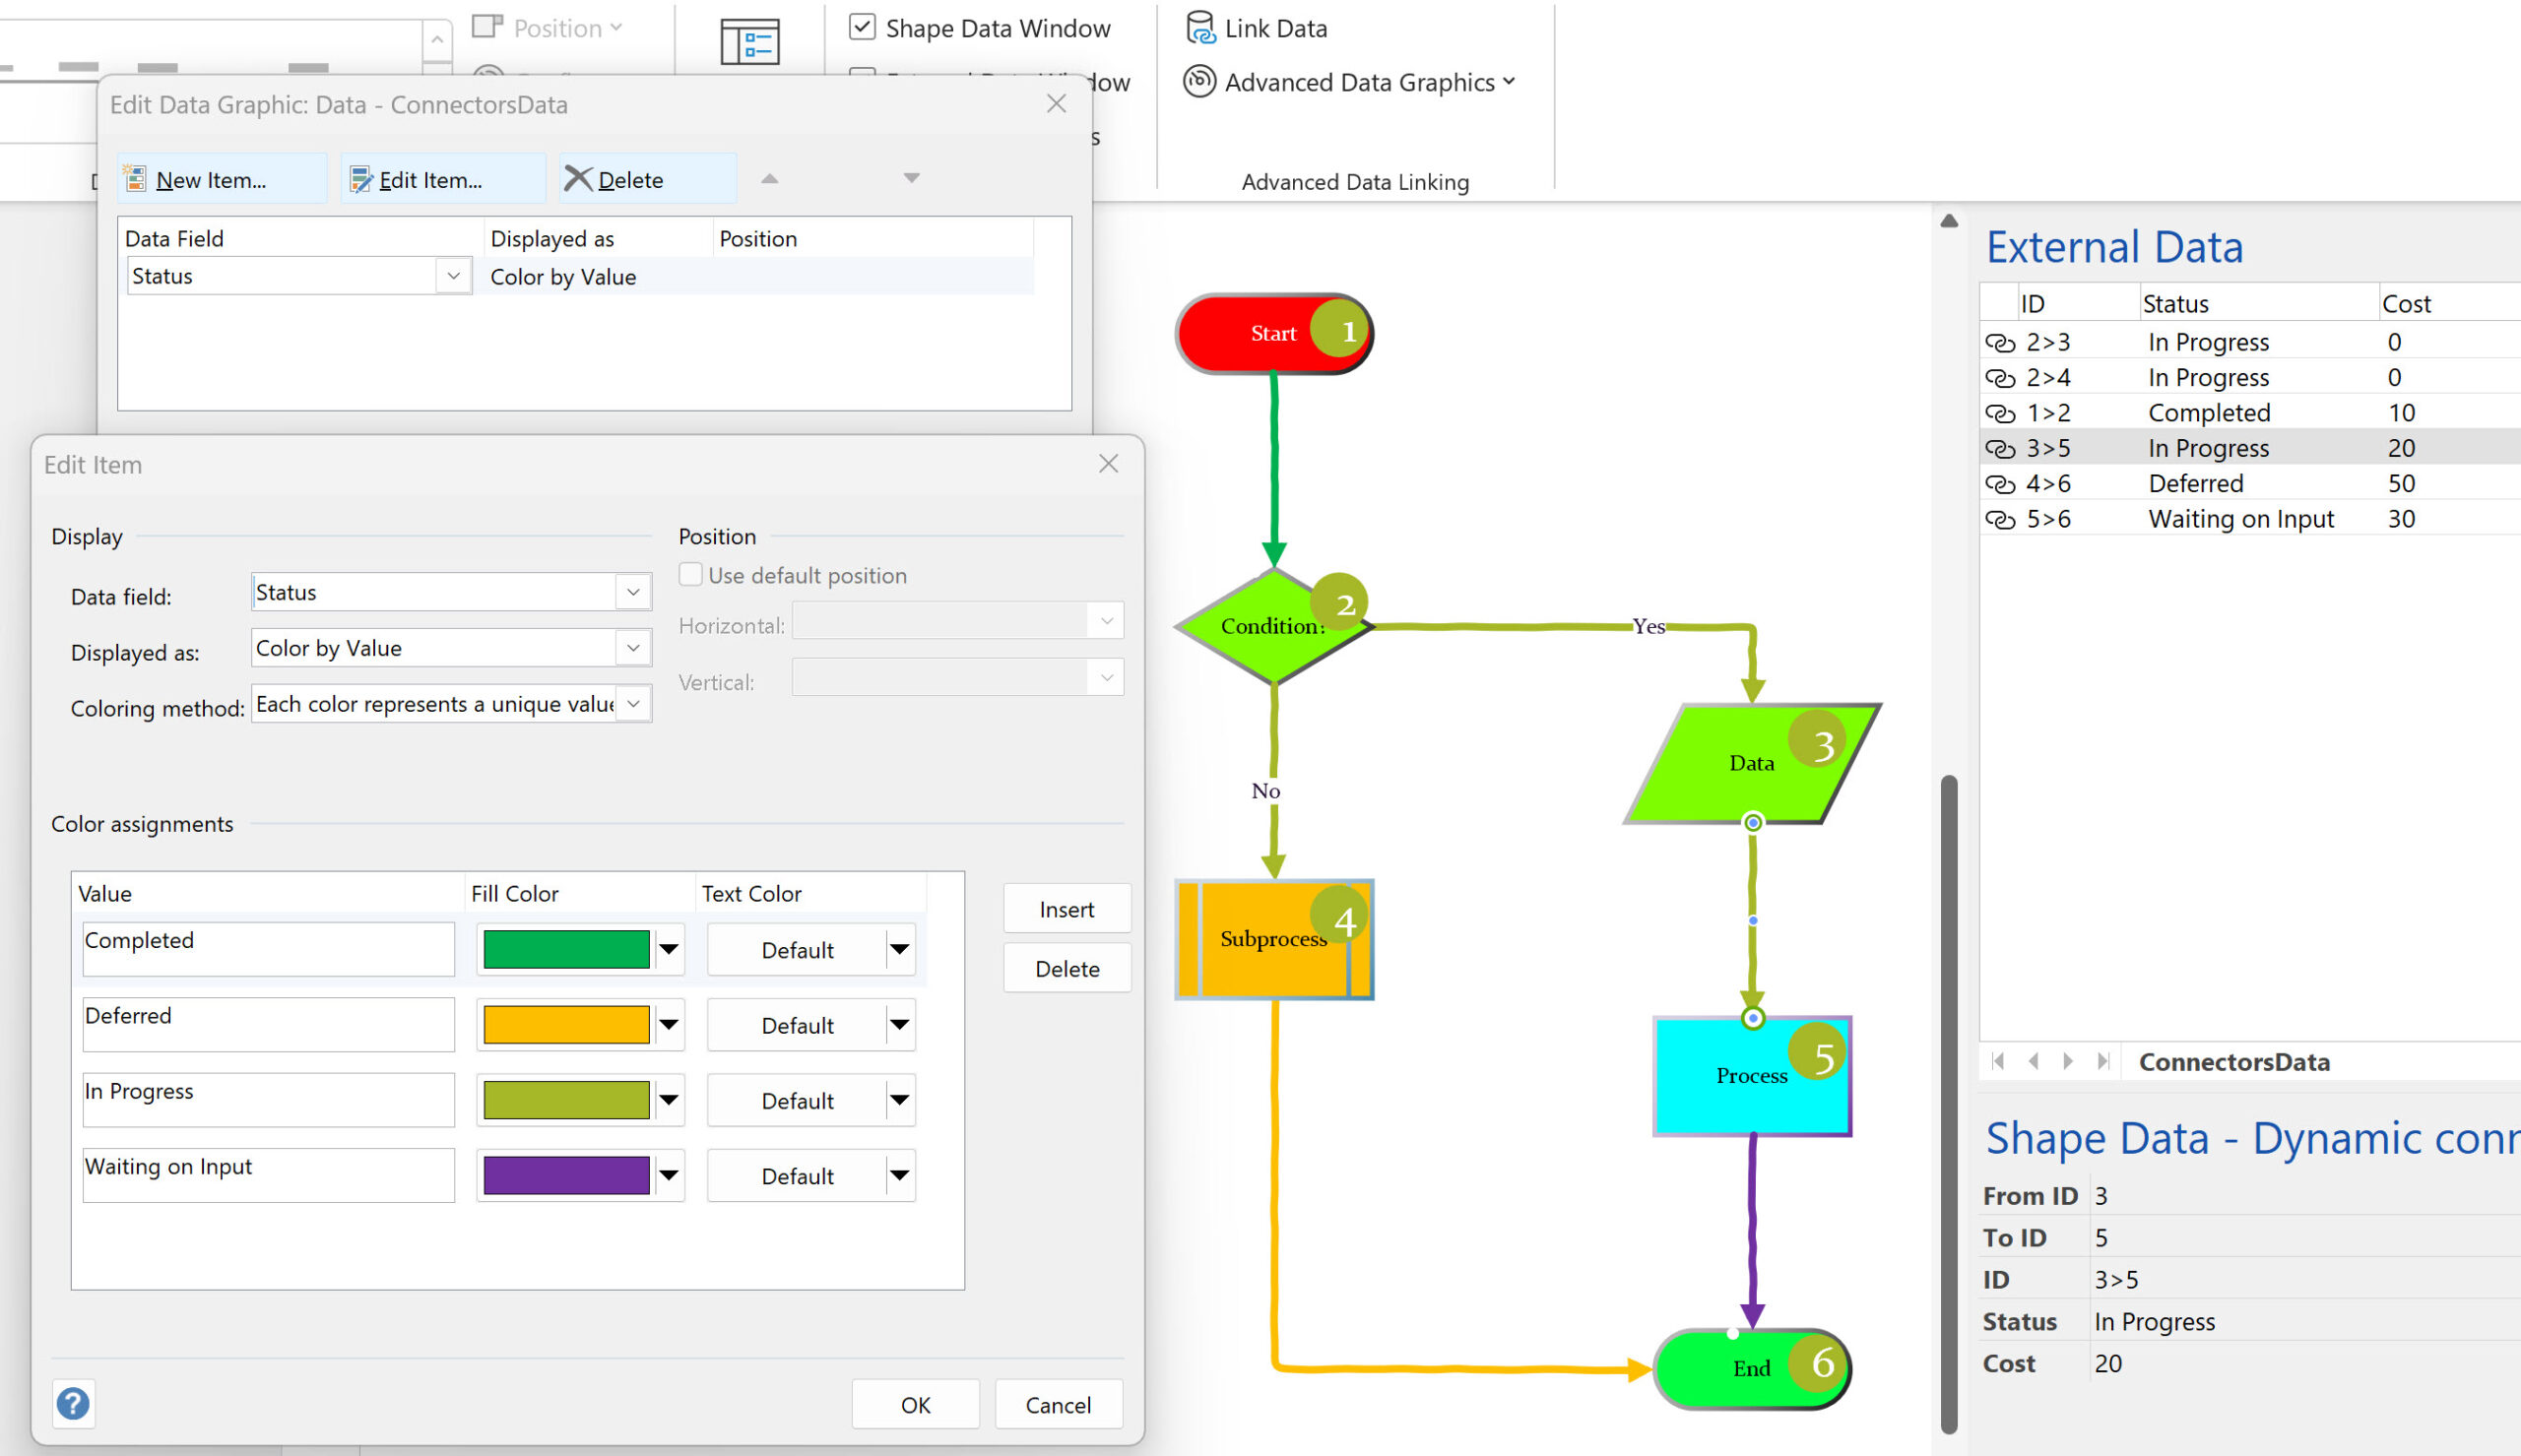
Using Visio Color by Value on Connectors
Data Graphics in Visio Plan 2 and Visio Professional is great, but it only enables us to use them with 2D shapes in Visio, i.e. not on connectors. So, what if you want to change the line colour of the connectors between the 2D shapes because of the data flowing between them? Well, it is…
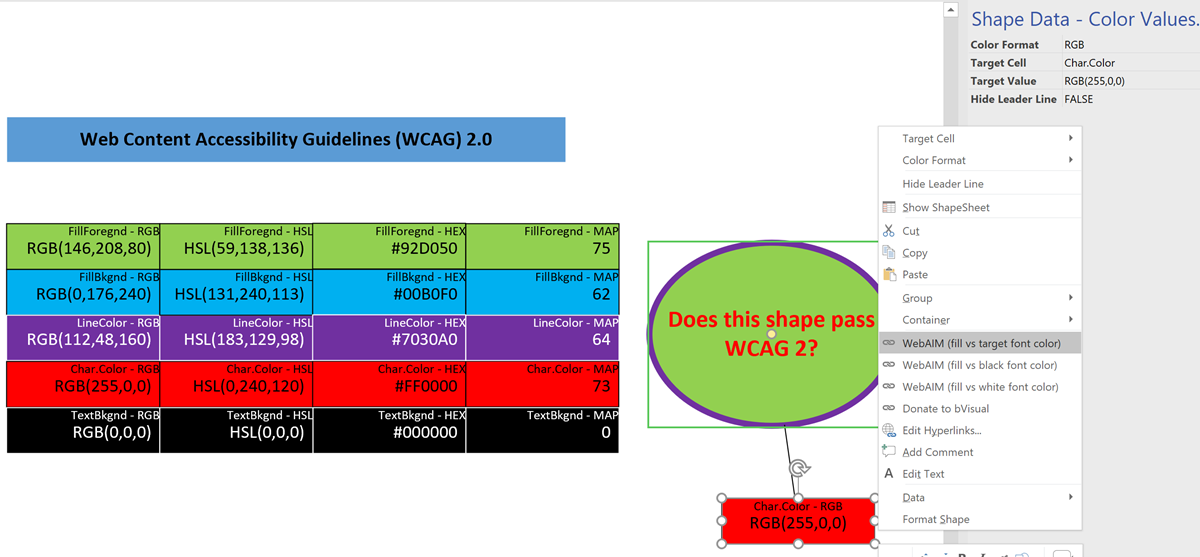
Testing Visio shape text for WCAG 2.0 pass
The Web Content Access Guidelines (WCAG) 2.0 provides the current recommendations for making web content accessible to users with vision impairment, but how do you test if your Visio shapes pass?
Formatting SharePoint Columns with RGB Color
Learn how to format SharePoint list columns with RGB values
Ensuring High Contrast Text in Visio Shapes
Learn how to write a ShapeSheet formula to ensure high contrast of text on a shape background fill for visibility accessibility
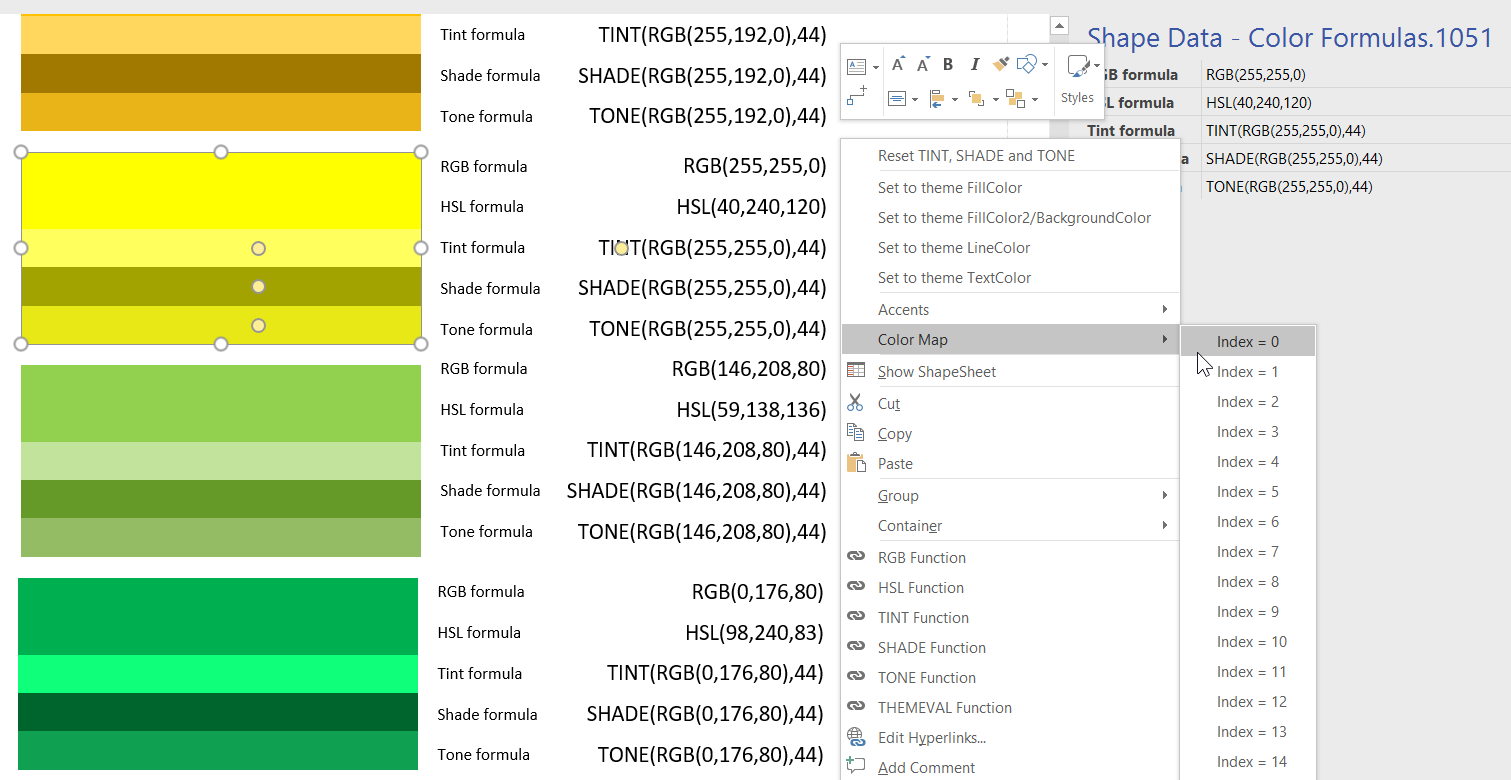
Understanding Visio’s Color Formulas
I was recently exploring the ShapeSheet formulas available in Visio that affect colors, and I decided that I needed to make a shape that I can change the fill color, tint, shade and tone of dynamically. This allows me to copy the formulas from a Shape Data row value for pasting into a ShapeSheet cell.…
Leave a Reply
You must be logged in to post a comment.