• Skip to main content
  • Skip to primary sidebar
  • Skip to footer

bVisual

  • Home
  • Services
    • How Visio smartness can help your business
    • Visio visual in Power BI
    • Visio Consulting Services
    • Visio Bureau Services
    • Visio Training and Support Services
  • Products
    • Visio Shape Report Converter
    • SS Plus
    • LayerManager
    • visViewer
    • Metro Icons
    • Rules Tools for Visio
    • The Visio 2010 Sessions App
    • Multi-Language Text for Visio
    • Document Imager for Visio
    • multiSelect for Visio
    • pdSelect for Visio
  • Case Studies
    • Case studies overview
    • Using Visio in Education for GIS
    • Visualizing Construction Project Schedules
    • Visio Online Business Process Mapping
    • Nexans Visio Template
    • CNEE Projects, WorldCom
    • Chase Manhattan Bank
  • News
    • Recent news
    • News archive
  • Resources
    • Articles➡
      • ShapeSheet Functions A-Z
      • Comparing Visio for the Web and Desktop
      • Customising Visio Shapes for the Web App
      • Key differences between the Visio desktop and web apps
      • Using the Visio Data Visualizer in Excel
      • Using Visio in Teams
      • Creating Visio Tabs and Apps for Teams with SharePoint Framework (SPFx)
      • Designing Power Automate Flows with Microsoft Visio
      • Innovative uses of Visio Lists
    • Webcasts ➡
      • Visio in Organizations
      • My session and other Visio sessions at MSIgnite 2019
      • Power up your Visio diagrams
      • Vision up your Visio diagrams
      • The Visio 2010 MVP Sessions
    • Visio Web Learning Resources
    • Books➡
      • Visualize Complex Processes with Microsoft Visio
      • Mastering Data Visualization with Microsoft Visio
      • Microsoft Visio Business Process Diagramming and Validation
      • Visualizing Information with Microsoft Visio
  • Blog
    • Browse blog articles
    • Visio Power BI articles
    • Visio for Web articles
    • A history of messaging and encryption
  • About us
    • About bVisual
    • Testimonials
    • Bio of David Parker
    • Contact Us
    • Website Privacy Policy
    • Website terms and conditions
    • Ariba Network

Data Visualizer

Published on October 15, 2020 by David Parker

Visio Data Visualizer Tips

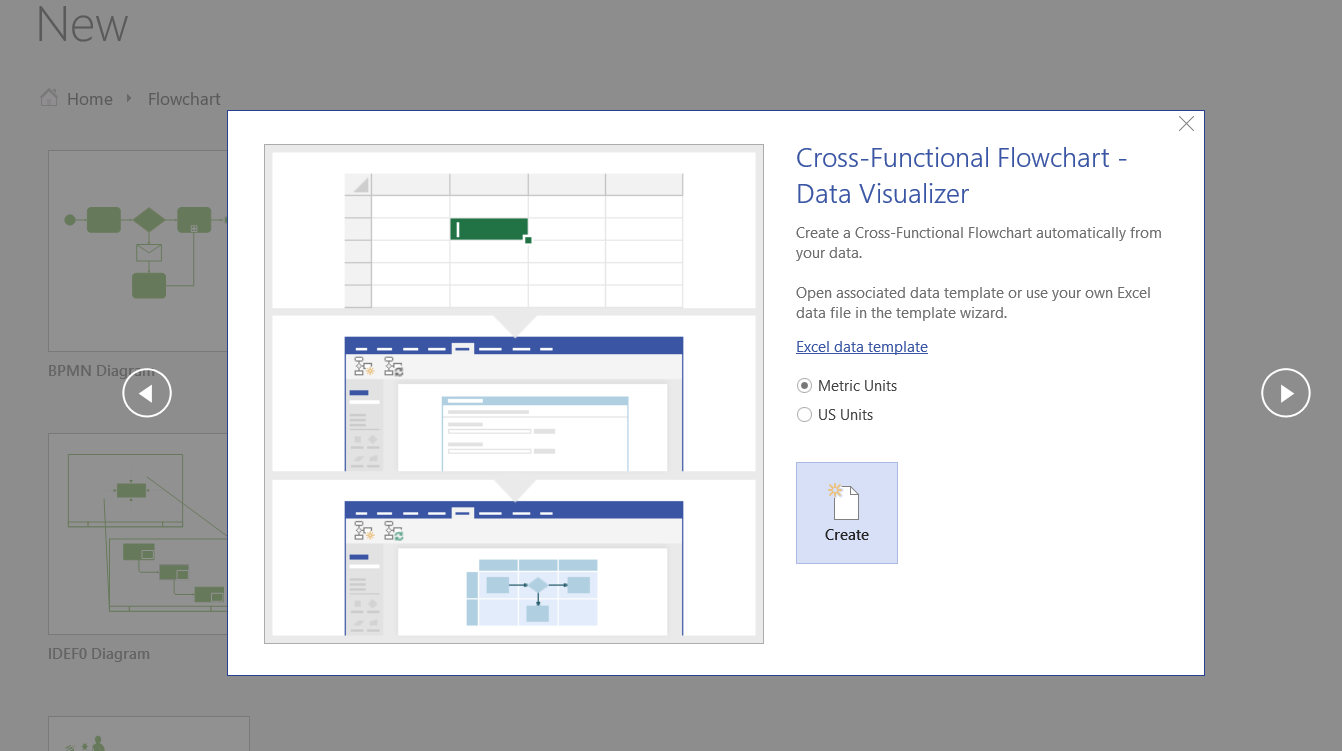
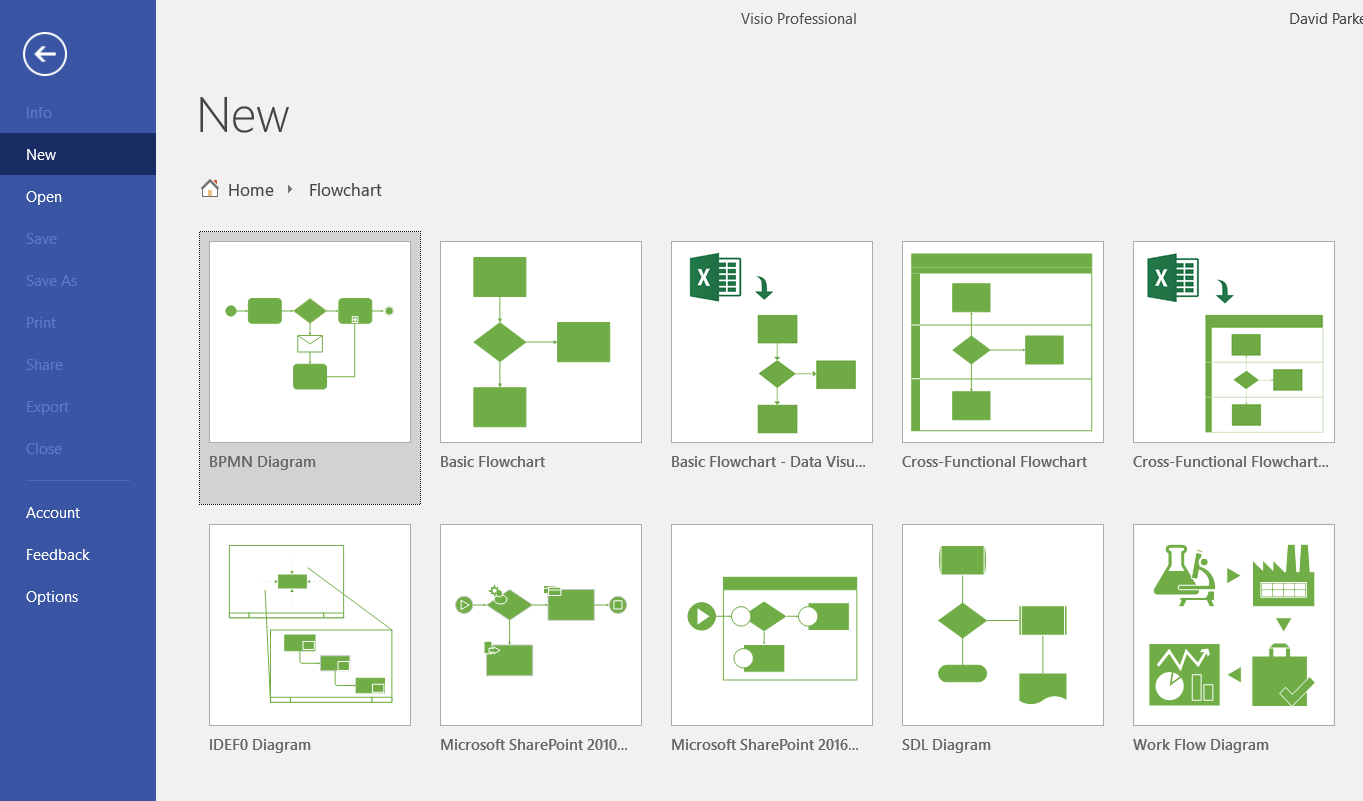
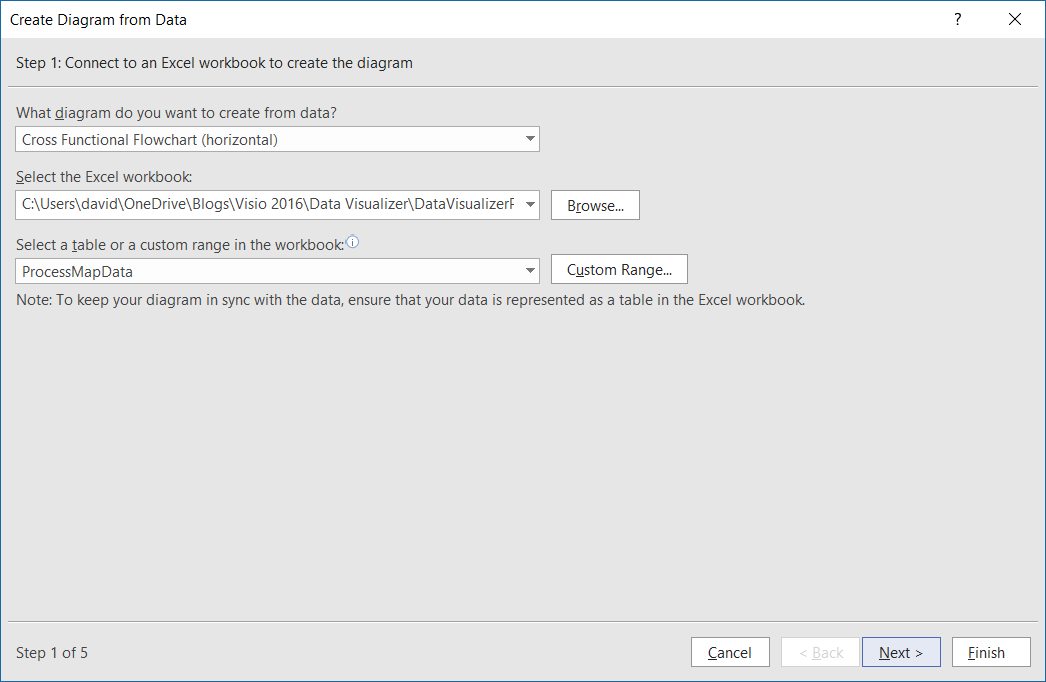
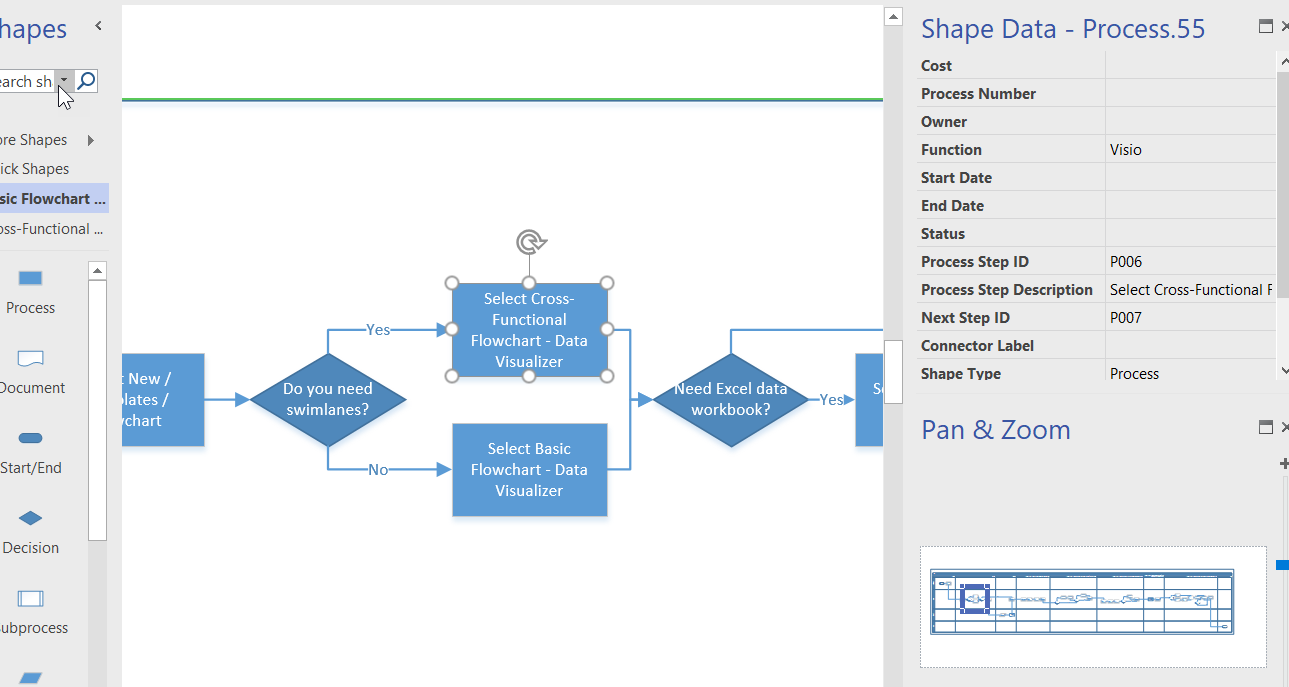
The Microsoft Visio product team have released a great video introduction to the Visio Data Visualizer, but even that does not reveal all of its power. So, here are some tips about using the Microsoft Visio Data Visualizer add-in in Excel. Firstly, the add-in currently offers three different types of diagram, and each have a number of alternative layout arrangements.

  • Basic Flowchart – 4 layouts
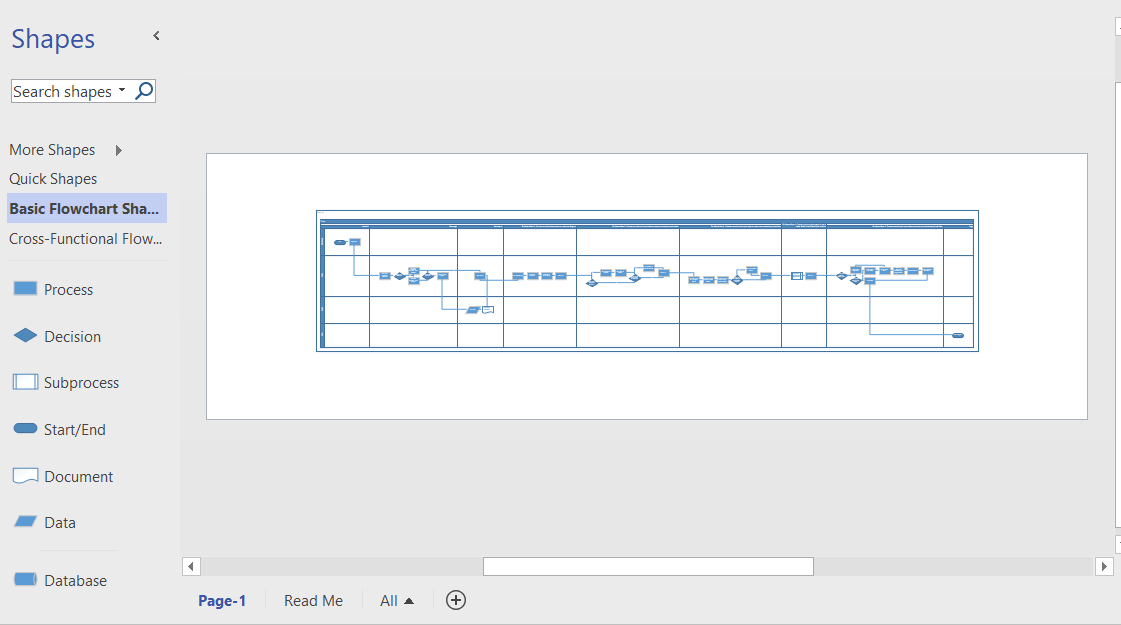
  • Cross-Functional Flowchart – 5 layouts
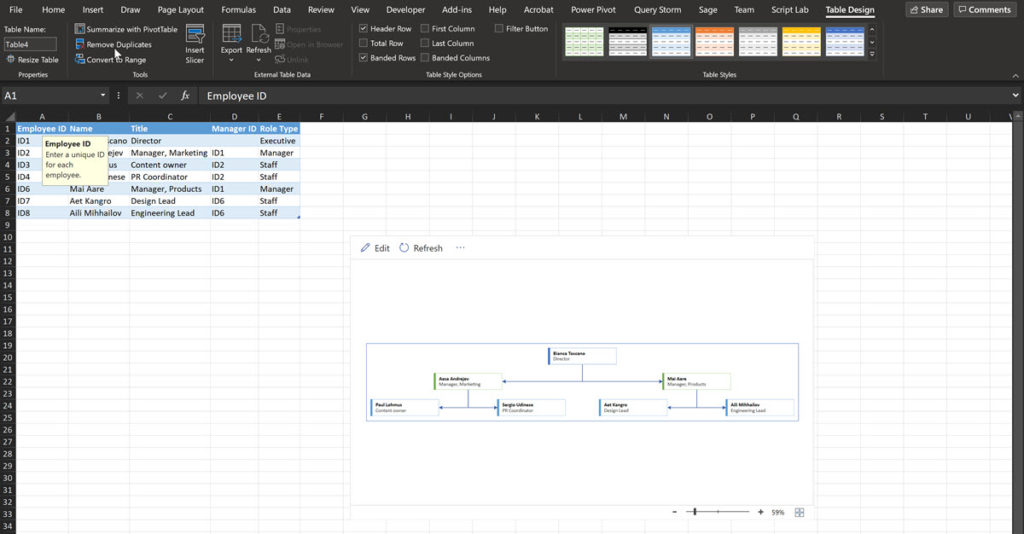
  • Organization Chart – 5 layouts

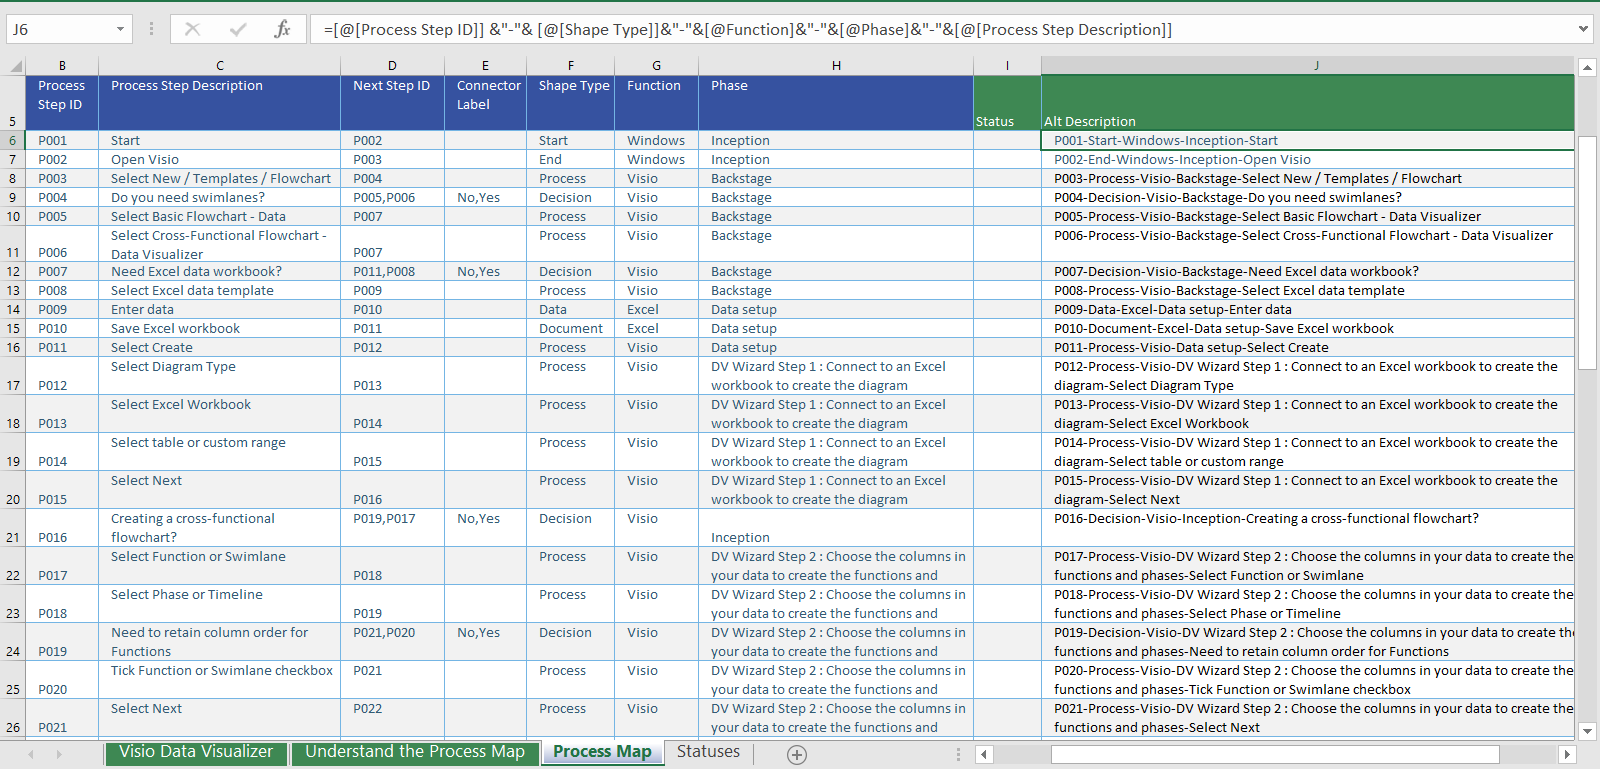
Although these are the proposed diagram types, there is no reason why other types of data, such as network devices, cannot be used with any of them.

Sample Org Chart with Visio Data Visualizer in Excel
[Read more…] about Visio Data Visualizer Tips

Filed Under: Data Visualizer, Excel, Visio Tagged With: Data Visualizer, Excel, Visio

Published on November 10, 2019 by David Parker

Visio news from MS Ignite 2019

Daniel, Scott, me and Michel at the Veeam party

Microsoft Ignite 2019 at the huge Orange County Conference Conference Center in Orlando is over for another year. 30,000 attendees over 6 days, and I have seen my first sunlight today since I arrived in Florida last Saturday! So, it is time to review just what was announced about Visio, and how much Visio is appreciated.

[Read more…] about Visio news from MS Ignite 2019

Filed Under: Data Visualizer, Floor Plans, MSFlow, MSIgnite, Org Charts, PowerBI, Process Flows, Teams, Visio, Visio for Desktop, Visio for Web Tagged With: Data Visualizer, MSIgnite, Org Chart, Processes

Published on May 18, 2017 by David Parker

Data Visualizer for Visio Pro for Office 365 – Part 2

I walked though the steps to create a Cross-Functional flowchart automatically from an Excel table in my last article ( Data Visualizer for #Visio Pro for Office 365 – Part 1 ), but I often prefer to use a relational data source, such as Access or SQL Server, to store and organise my data. Therefore, I describe how Excel‘s Get Data (nee PowerQuery) can be used to merge together the data in a relational data source as a single table suitable for Data Visualizer in Visio Pro for Office 365.

[Read more…] about Data Visualizer for Visio Pro for Office 365 – Part 2

Filed Under: Access, Data Visualizer, Office 365, SQL Server, Visio Tagged With: Data Visualizer, Excel, Office365, Visio Pro for Office365

Published on May 18, 2017 by David Parker

Data Visualizer for Visio Pro for Office 365 – Part 1

Microsoft have just released Data Visualizer for Viso Pro for Office 365! This great new feature provides you with the ability to create diagrams from an Excel table automatically. It currently comes with two new templates for creating Basic or Cross-Functional flowcharts, but the feature can be used for many other different types of diagrams.

[Read more…] about Data Visualizer for Visio Pro for Office 365 – Part 1

Filed Under: Data Visualizer, Office 365, Visio Tagged With: Data Visualizer, Excel, Office365, Visio Pro for Office365

  • « Go to Previous Page
  • Page 1
  • Page 2

Primary Sidebar

  • LinkedIn
  • Twitter

Recent Posts

  • Fixing dimensions of 2D shapes
  • Merging Linked Data from Similar Tables
  • Smart Radio Buttons and Check Boxes in Visio
  • Using Button Face Ids in Visio
  • Grid Snapping Revisited

Categories

Tags

Accessibility Add-Ins Connectors Containers Data Export Data Graphics Data Import Data Visualizer Educational Excel GraphDatabase Hyperlinks Icon Sets JavaScript LayerManager Layers Legend Link Data to Shapes Lists MSIgnite MVP Office365 Org Chart PowerApps PowerBI PowerQuery Processes Setup and Deployment Shape Data Shape Design ShapeSheet ShapeSheet Functions SharePoint 2013 SQL Teams Validation VBA Video Visio Visio 2007 Visio for the Web Visio Online Visio Services Visio Viewer Webinar

Footer

bVisual Profile

The UK-based independent Visio consultancy with a worldwide reach. We have over 25 years experience of providing data visualization solutions to companies around the globe.

Learn more about bVisual

  • Amazon
  • E-mail
  • Facebook
  • LinkedIn
  • Twitter
  • YouTube

Search this website

Recent posts

  • Fixing dimensions of 2D shapes
  • Merging Linked Data from Similar Tables
  • Smart Radio Buttons and Check Boxes in Visio
  • Using Button Face Ids in Visio
  • Grid Snapping Revisited

Copyright © 2025 · Executive Pro on Genesis Framework · WordPress · Log in