• Skip to main content
  • Skip to primary sidebar
  • Skip to footer

bVisual

  • Home
  • Services
    • How Visio smartness can help your business
    • Visio visual in Power BI
    • Visio Consulting Services
    • Visio Bureau Services
    • Visio Training and Support Services
  • Products
    • Visio Shape Report Converter
    • SS Plus
    • LayerManager
    • visViewer
    • Metro Icons
    • Rules Tools for Visio
    • The Visio 2010 Sessions App
    • Multi-Language Text for Visio
    • Document Imager for Visio
    • multiSelect for Visio
    • pdSelect for Visio
  • Case Studies
    • Case studies overview
    • Visualizing Construction Project Schedules
    • Visio Online Business Process Mapping
    • Nexans Visio Template
    • CNEE Projects, WorldCom
    • Chase Manhattan Bank
  • News
    • Recent news
    • News archive
  • Resources
    • Articles➡
      • ShapeSheet Functions A-Z
      • Comparing Visio for the Web and Desktop
      • Customising Visio Shapes for the Web App
      • Key differences between the Visio desktop and web apps
      • Using the Visio Data Visualizer in Excel
      • Using Visio in Teams
      • Creating Visio Tabs and Apps for Teams with SharePoint Framework (SPFx)
      • Designing Power Automate Flows with Microsoft Visio
      • Innovative uses of Visio Lists
    • Webcasts ➡
      • Visio in Organizations
      • My session and other Visio sessions at MSIgnite 2019
      • Power up your Visio diagrams
      • Vision up your Visio diagrams
      • The Visio 2010 MVP Sessions
    • Visio Web Learning Resources
    • Books➡
      • Mastering Data Visualization with Microsoft Visio
      • Microsoft Visio Business Process Diagramming and Validation
      • Visualizing Information with Microsoft Visio
  • Blog
    • Browse blog articles
    • Visio Power BI articles
    • Visio for Web articles
    • A history of messaging and encryption
  • About us
    • About bVisual
    • Testimonials
    • Bio of David Parker
    • Contact Us
    • Website Privacy Policy
    • Website terms and conditions
    • Ariba Network
You are here: Home / Visio / Data Visualizer for Visio Pro for Office 365 – Part 1

Published on May 18, 2017 by David Parker

Data Visualizer for Visio Pro for Office 365 – Part 1

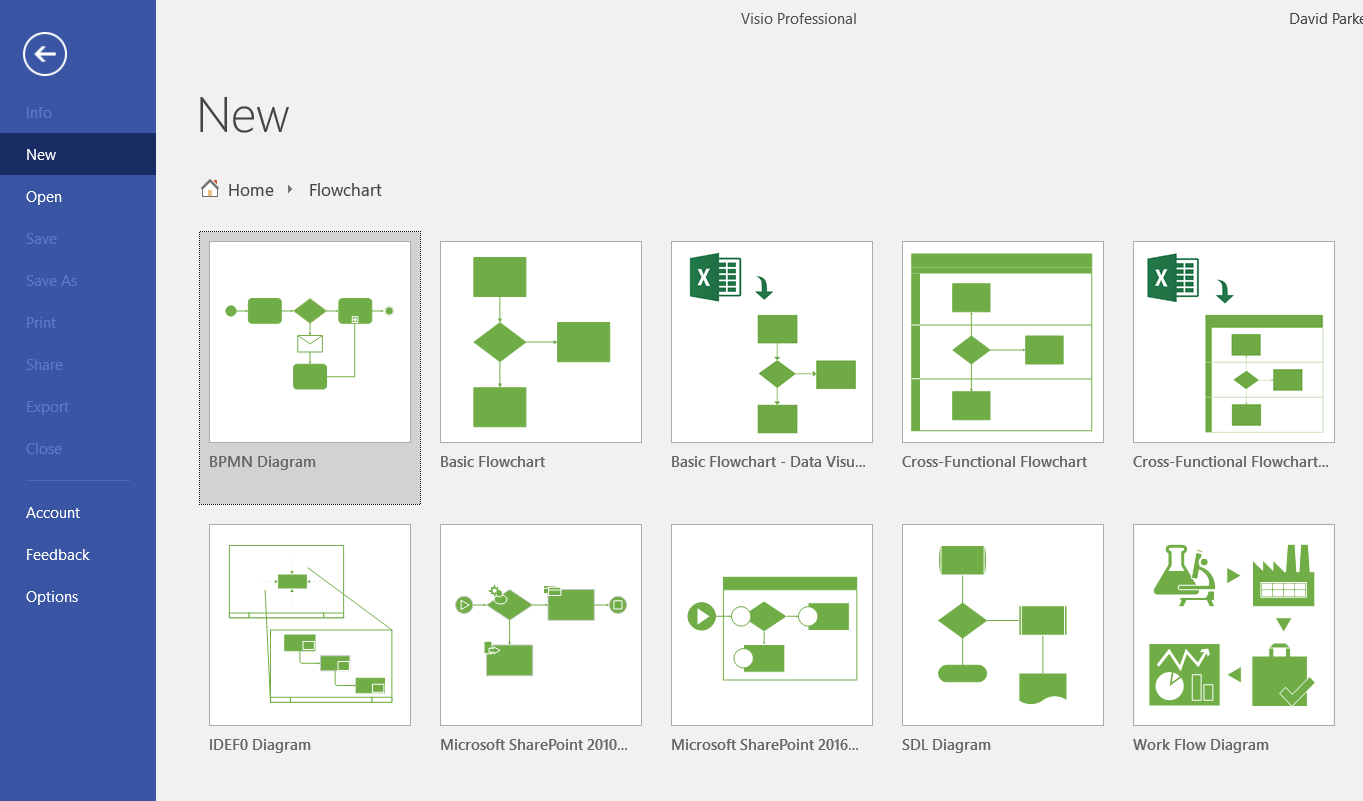
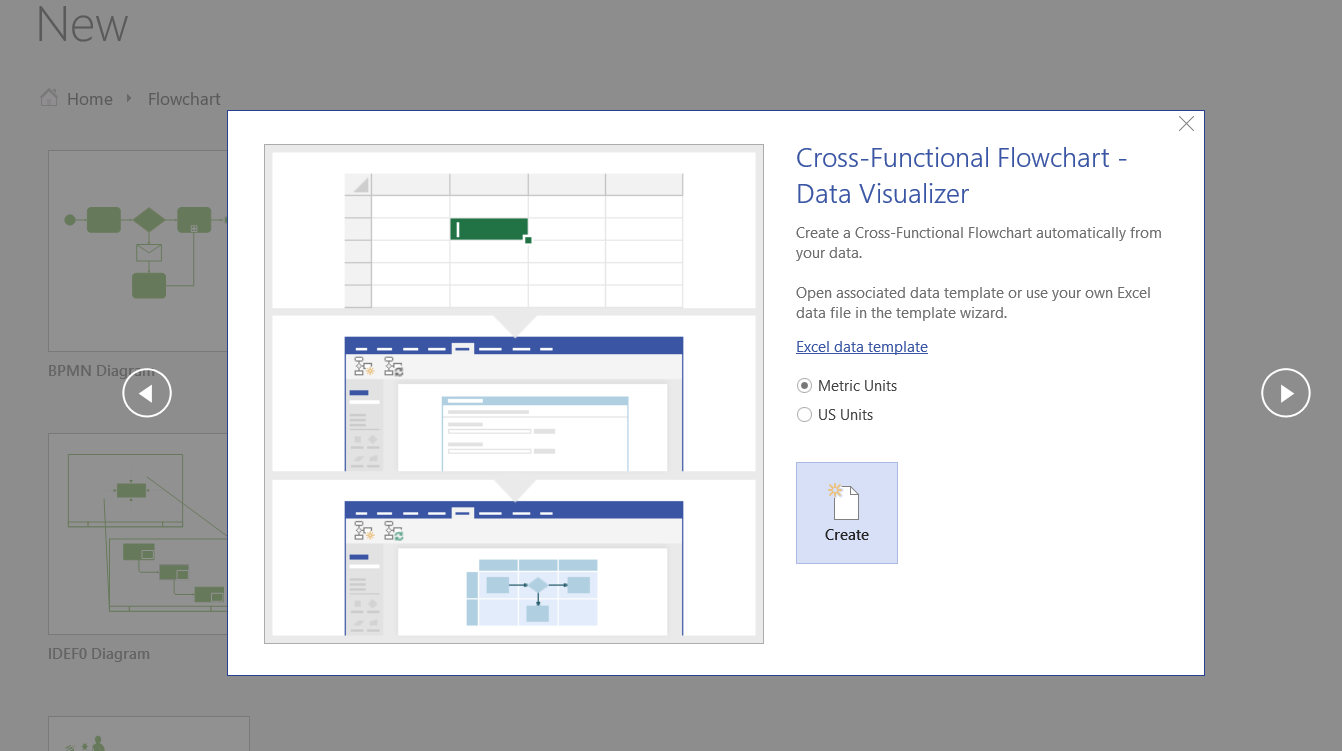
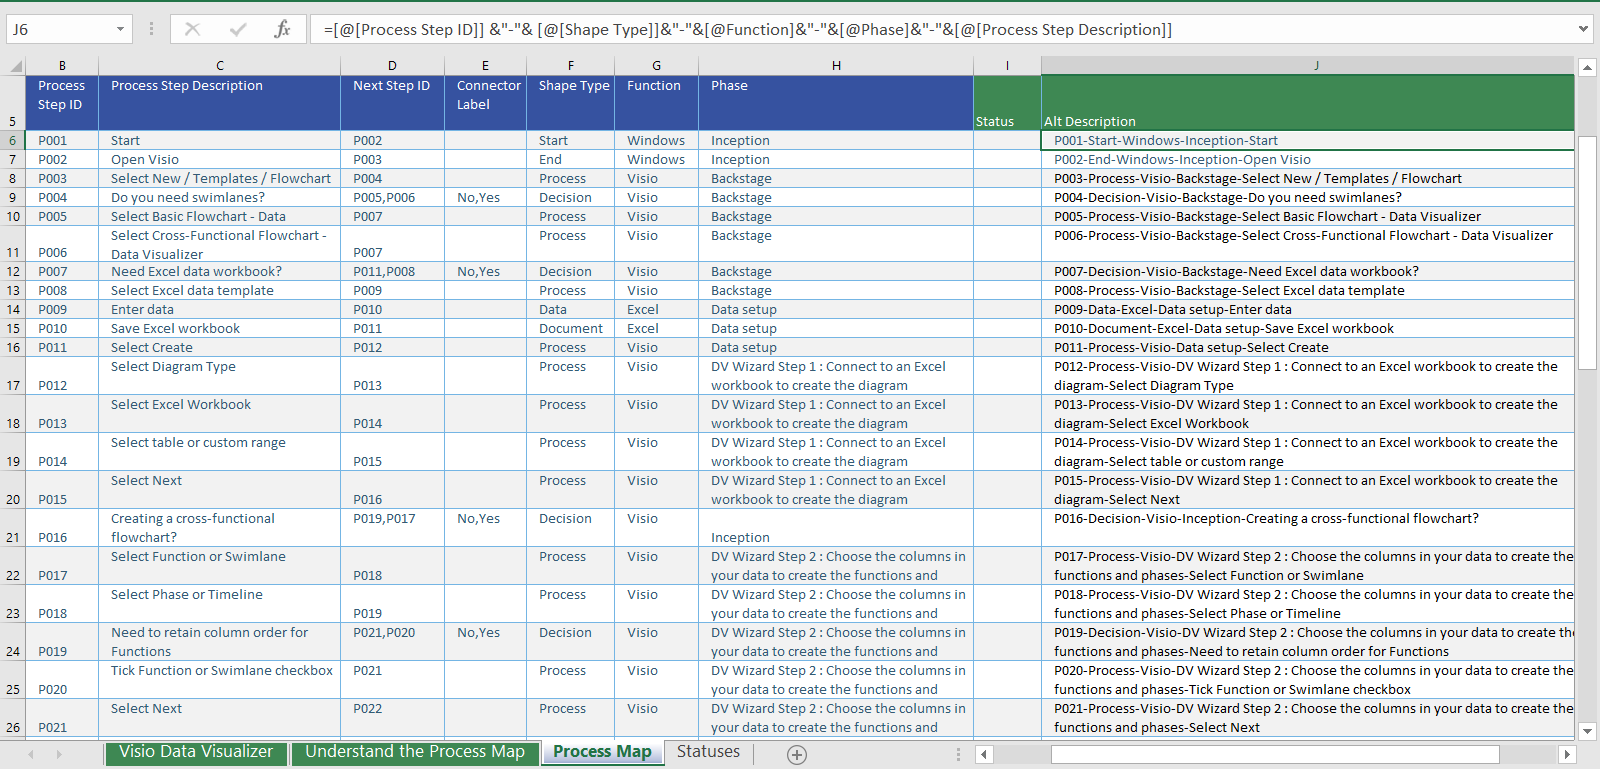
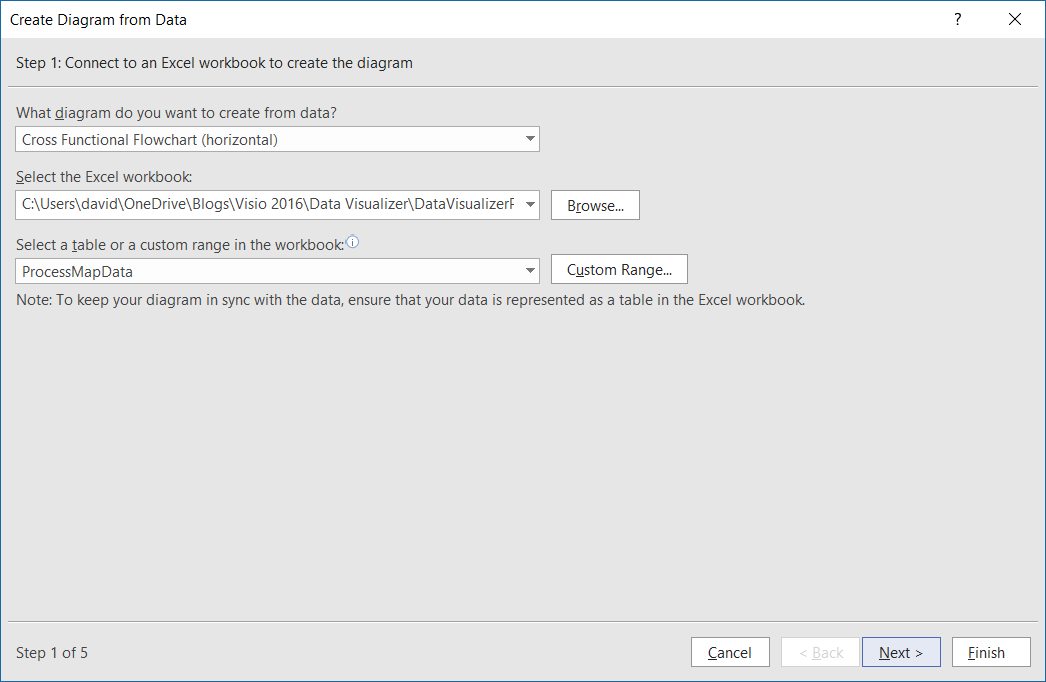
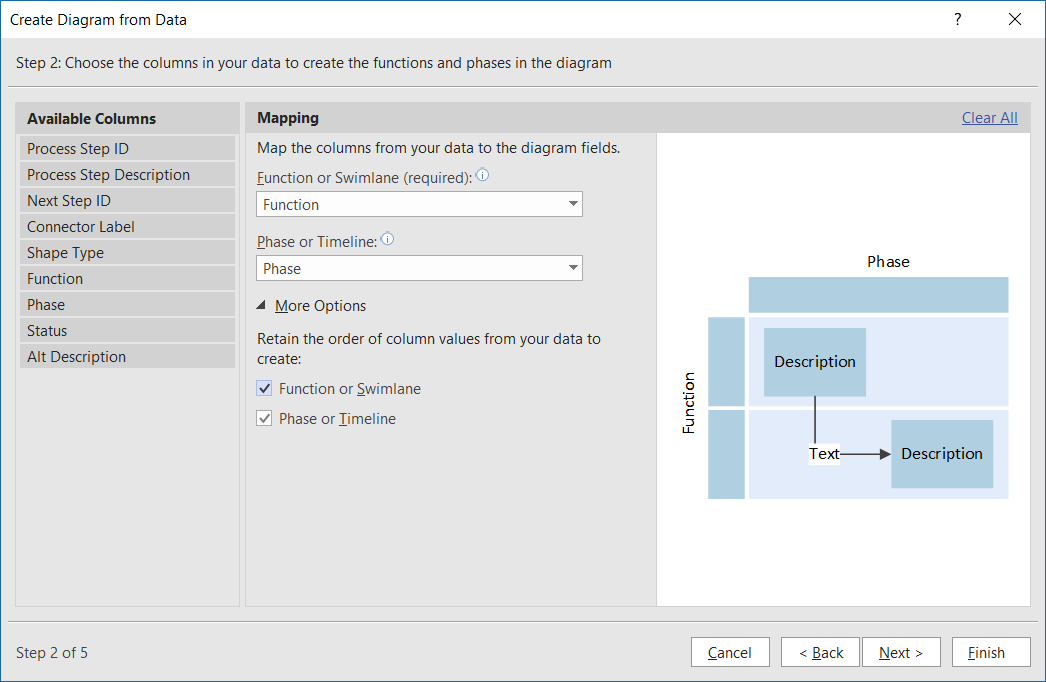
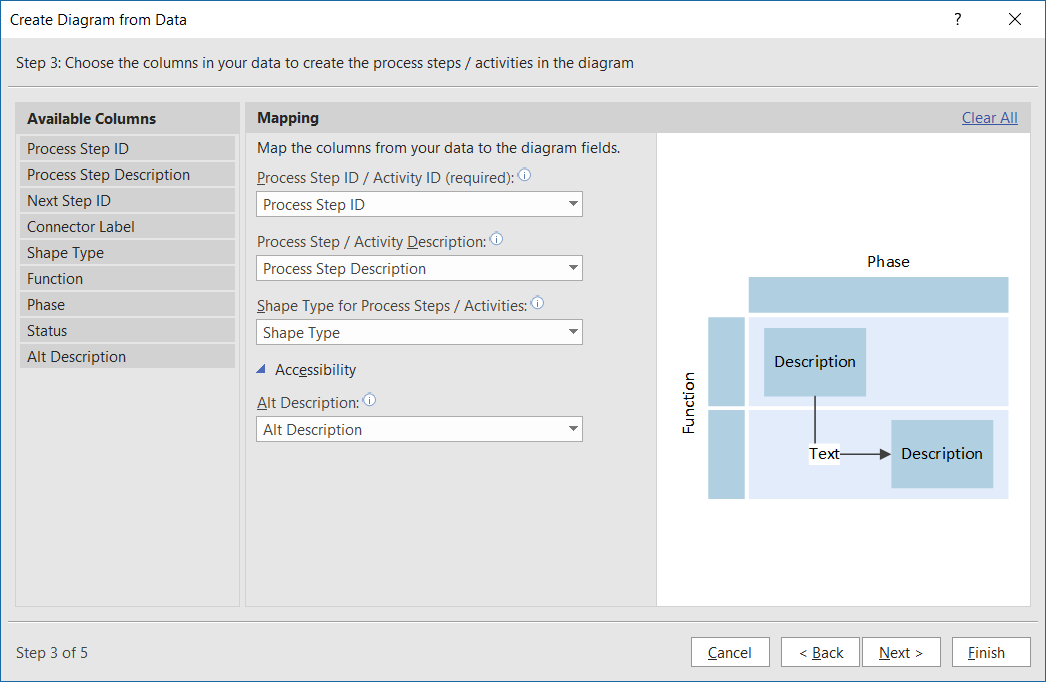
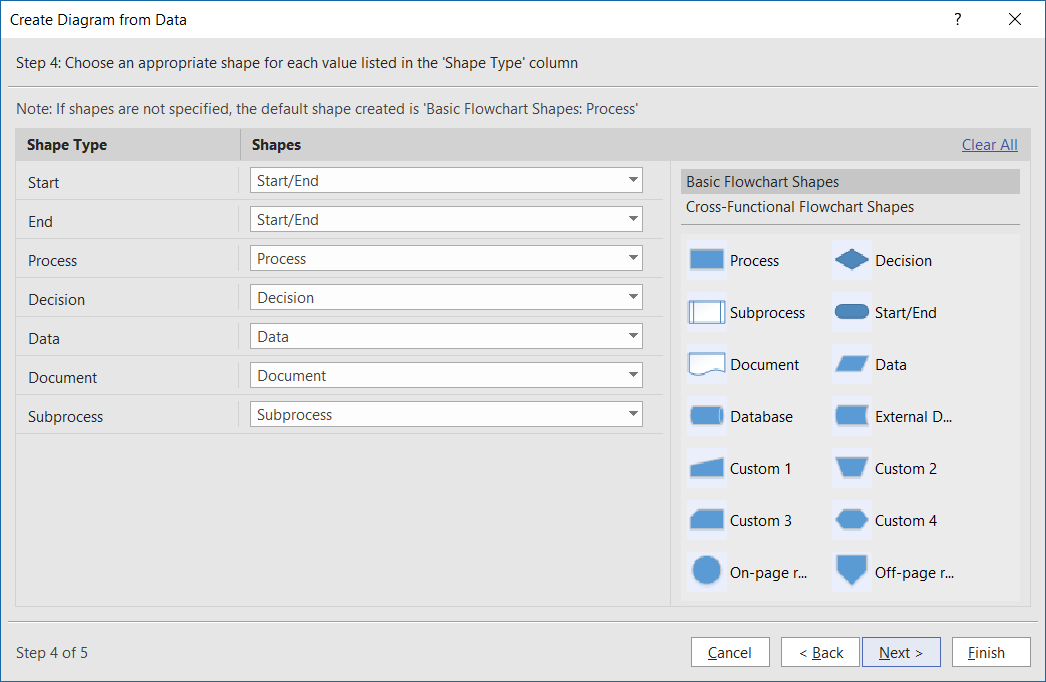
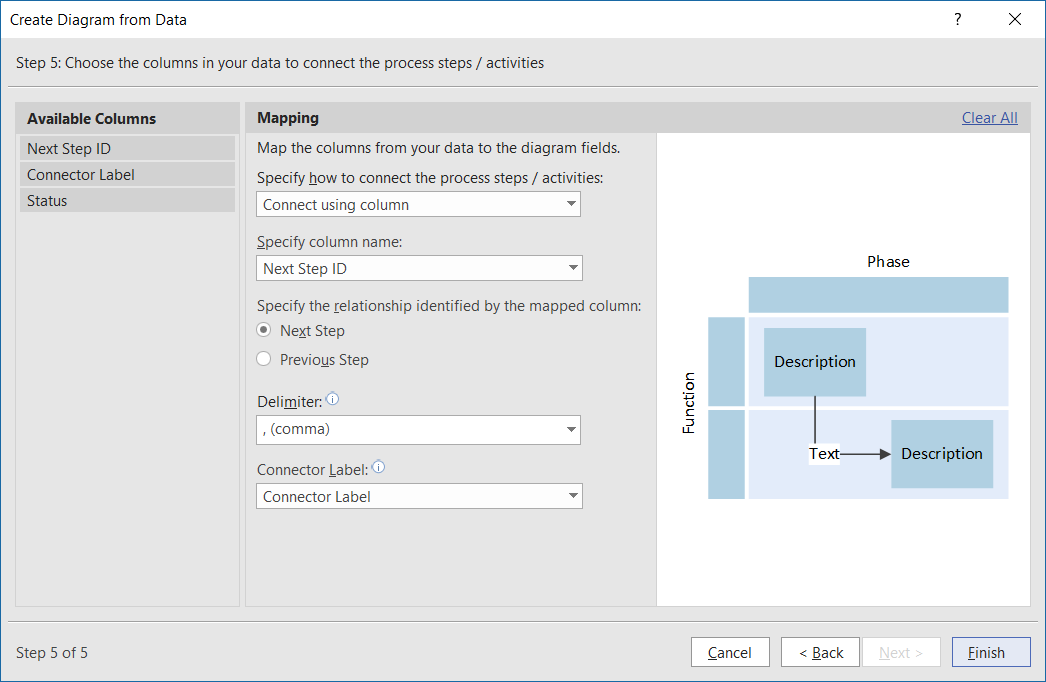
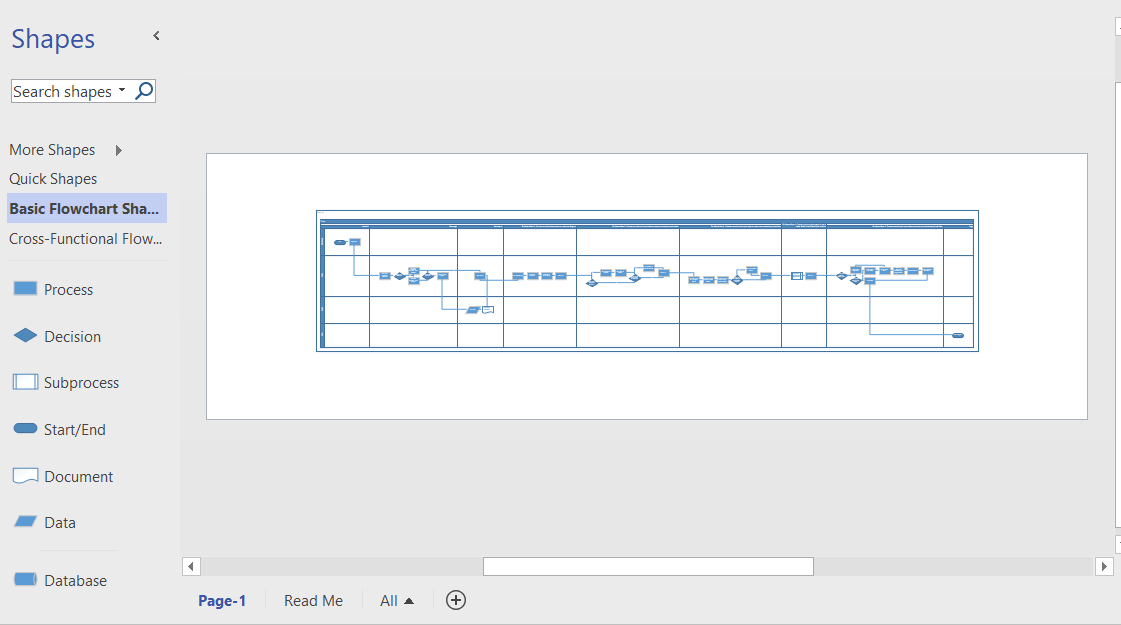
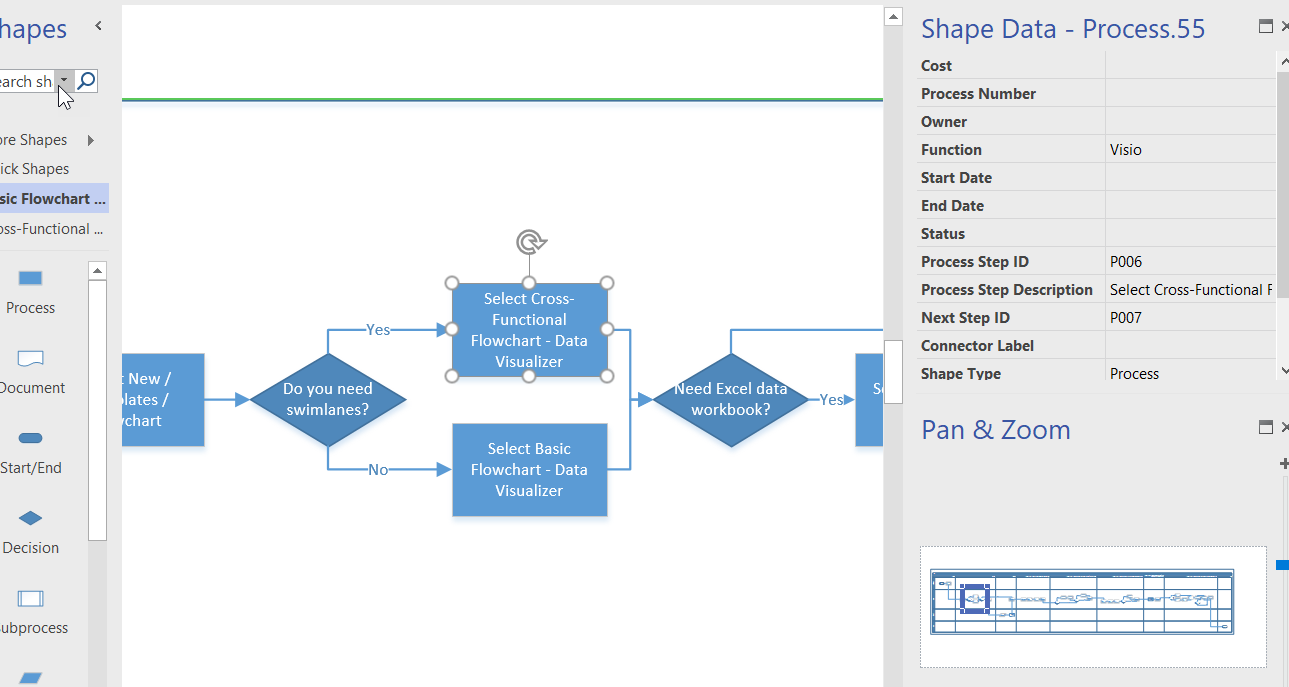
Microsoft have just released Data Visualizer for Viso Pro for Office 365! This great new feature provides you with the ability to create diagrams from an Excel table automatically. It currently comes with two new templates for creating Basic or Cross-Functional flowcharts, but the feature can be used for many other different types of diagrams.


I have create a demo video that walks though the process of creating a diagram from Excel using Data Visualizer for Viso Pro for Office 365:

I will explore this new feature some more, but this is a very welcome capability.
Many years ago, there used to a a Flow Chart Wizard in Visio, but it got removed by Microsoft sometime in the early 00’s. This new tool is even better because it provides a framework for different diagram types AND the diagrams can be automatically updated if the data changes!

Microsoft links

Automatically create process diagrams in Visio from Excel data
Create a Data Visualizer diagram
Export and install a Data Visualizer template package
Insiders: Data Visualizer for process diagrams in Visio Pro for O365
 
Next Part : Data Visualizer for #Visio Pro for Office 365 – Part 2


Related

Filed Under: Data Visualizer, Office 365, Visio Tagged With: Data Visualizer, Excel, Office365, Visio Pro for Office365

About David Parker

David Parker has 25 years' experience of providing data visualization solutions to companies around the globe. He is a Microsoft MVP and Visio expert.

Reader Interactions

Comments

  1. Sally Brown says

    June 6, 2017 at 9:35 am

    This is a great feature. However, I have just installed Visio PRO for Office 365 and it certainly does not go through the steps that you have shown in the video.
    1. The Data Visualization templates are listed under Excel and not shown as yours are
    2. The wizard automatically opens excel and leaves Visio with no template open for creating new one etc. Do I then select normal Process Flowchart or what??
    3. There is no way of connecting the data to the Visio flowchart at all with connecting the shapes etc.
    Everything I have tried has resulted in a blank Visio Flowchart, blank process steps when I can get it to connect to the excel spreadsheet etc.
    So what is going wrong? I want to do a simple Excel table connected to Visio to automatically create the flowchart.

    Reply
    • davidjpp says

      June 6, 2017 at 9:40 am

      This feature is currently on a world-wide roll-out. What version number is yours currently? Have you updated recently?

      Reply
  2. Scott E says

    July 21, 2017 at 9:35 pm

    i had the exact same problem you’re describing above. i had clicked “Update” within Office 365 and it said i was on the “latest version,” so i didn’t think that was the issue, but turns out that you have to join the Windows Insider Slow Ring to get this “advanced/preview” feature. From different sources, i’ve read the following as minimum requirements:
    #1 NOTE: In order to use this feature, you must have an Office 365 SUBSCRIPTION.
    #2 Data Visualizer feature enhancements are available in app version 16.0.8067.2115 (or above)
    #3 To preview the Data Visualizer feature you will need to be on the Office Insider SLOW LEVEL, Version 1703 (Build 7967.2073) and have Excel installed on your machine.
    i joined the Insider Slow Ring and updated everything today. Now my Visio version shows as: “Version 1707 (Build 8326.2048 Click-to-Run) First Release for Current Channel (Office Insider Slow)”
    I’m not sure if Excel version is critical or not. i was previously using 2013. i updated to 2016 (16.0.8326.2048) 64-bit today.
    Now Data Visualizer works as described in numerous online guides. If you don’t see “TEMPLATES” next to “FEATURED” when you choose File > New, then as far as i can tell, you’re not going to see the “Data Visualizer” templates, and it’s not going to work…

    Reply

Trackbacks

  1. Data Visualizer for #Visio Pro for Office 365 – Part 2 | bVisual - for people interested in Microsoft Visio says:
    May 18, 2017 at 4:37 pm

    […] to create a Cross-Functional flowchart automatically from an Excel table in my last article ( Data Visualizer for #Visio Pro for Office 365 – Part 1 ), but I often prefer to use a relational data source, such as Access or SQL Server, to store and […]

    Reply
  2. Dynamic Updating Org Charts in Visio! – Visio Guy says:
    March 23, 2020 at 10:38 pm

    […] Data Visualizer for Visio Pro for Office 365 – Part 1 […]

    Reply

Leave a Reply Cancel reply

Your email address will not be published. Required fields are marked *

Primary Sidebar

  • LinkedIn
  • Twitter

Recent Posts

  • Update to LayerManager add-in for non-English users
  • Pushing Data Visualizer in Visio beyond its limits
  • Pushing Data Visualizer in Visio to the limits!
  • Teams Tuesday Podcast Recording about Visio
  • Linking Data to Visio Shapes in Code

Categories

Tags

Accessibility Add-Ins Connectors Containers Data Export Data Graphics Data Import Data Visualizer Educational Excel GraphDatabase Hyperlinks Icon Sets JavaScript Layers Legend Link Data to Shapes Lists MSIgnite MVP Office365 Org Chart PowerApps PowerBI PowerQuery Processes Shape Data Shape Design ShapeSheet ShapeSheet Functions SharePoint 2013 SQL Teams Themes Validation VBA Video Visio Visio 2007 Visio 2013 Visio for the Web Visio Online Visio Services Visio Viewer Webinar

Footer

bVisual Profile

The UK-based independent Visio consultancy with a worldwide reach. We have over 25 years experience of providing data visualization solutions to companies around the globe.

Learn more about bVisual

  • LinkedIn
  • Twitter

Search this website

Recent posts

  • Update to LayerManager add-in for non-English users
  • Pushing Data Visualizer in Visio beyond its limits
  • Pushing Data Visualizer in Visio to the limits!
  • Teams Tuesday Podcast Recording about Visio
  • Linking Data to Visio Shapes in Code

Copyright © 2023 · Executive Pro on Genesis Framework · WordPress · Log in