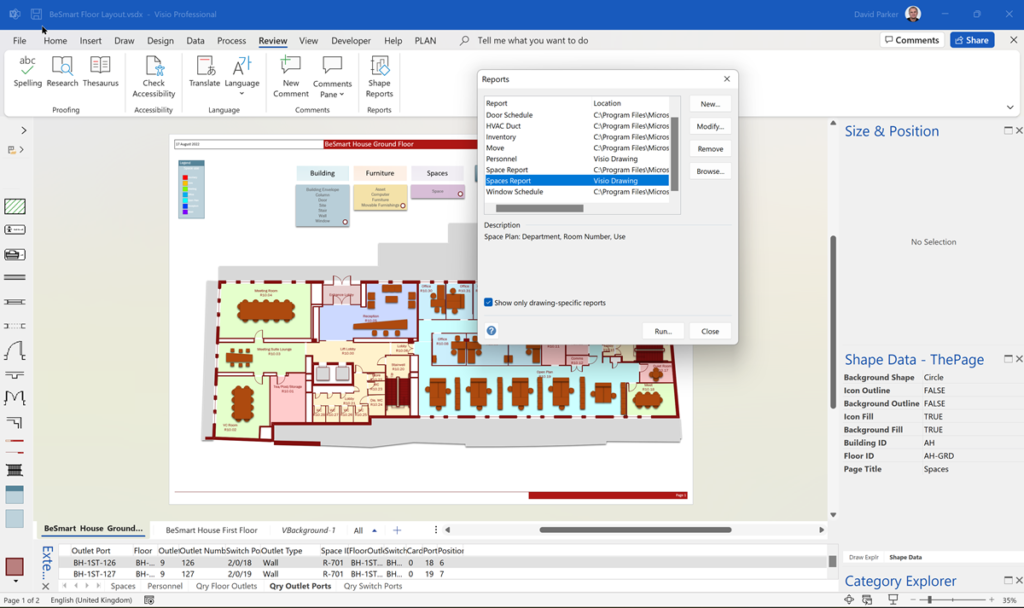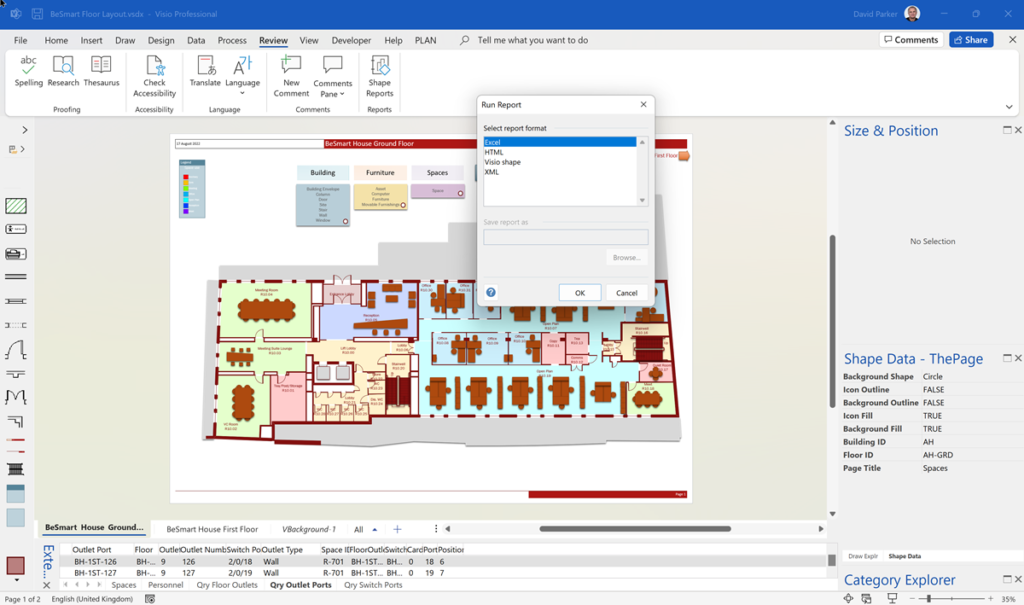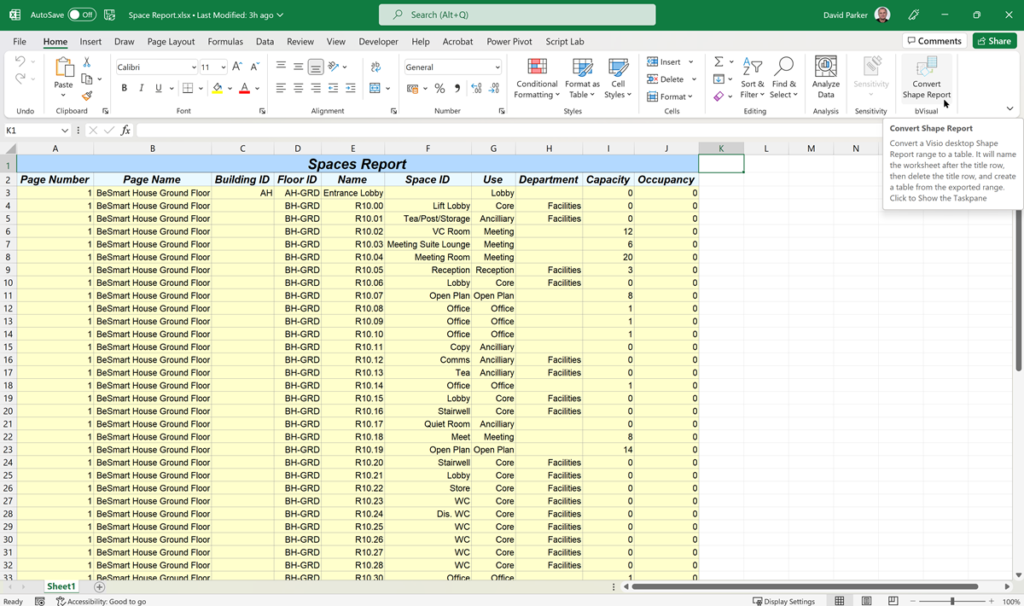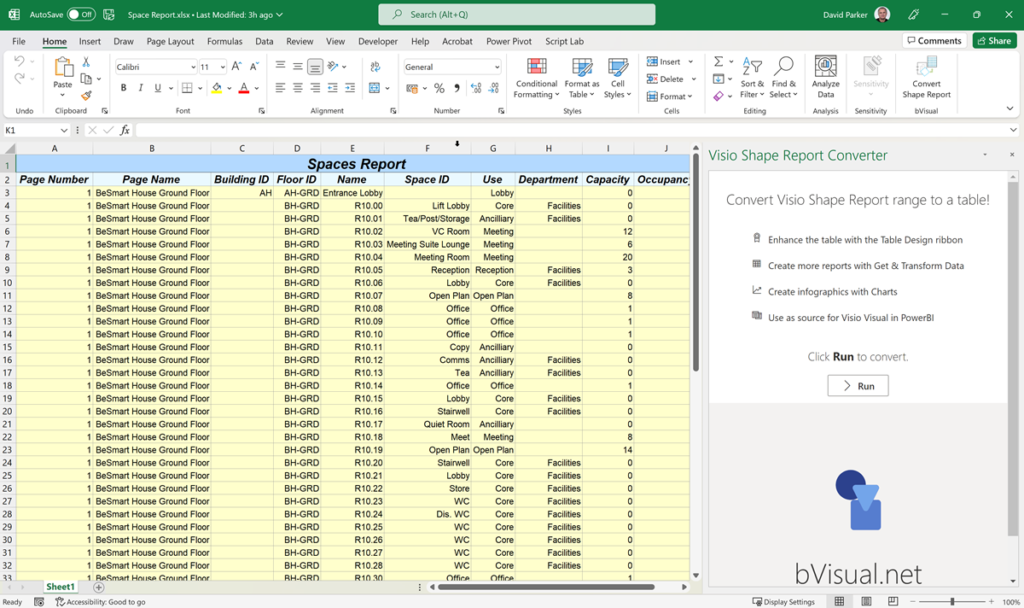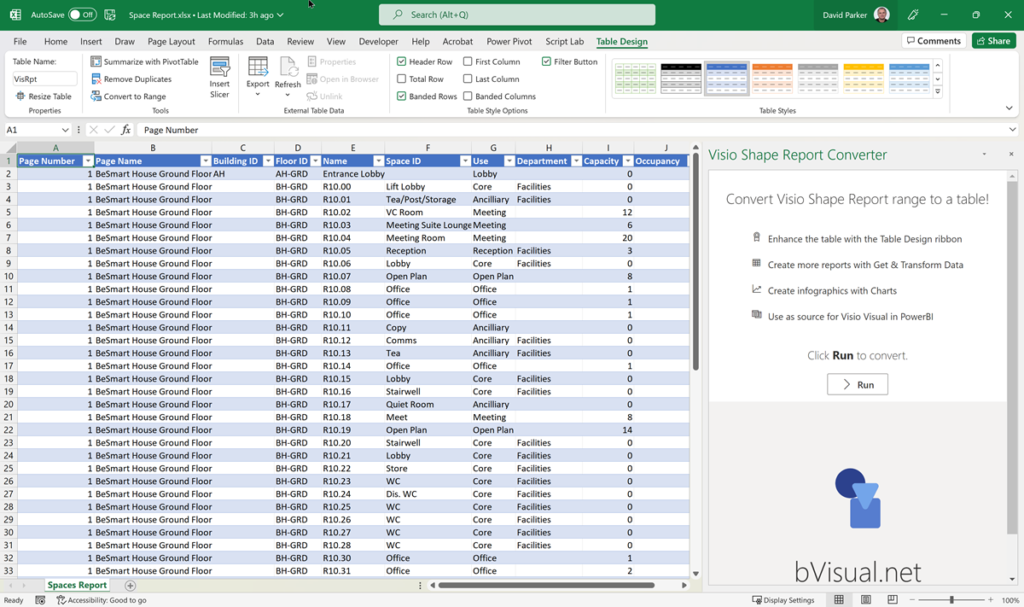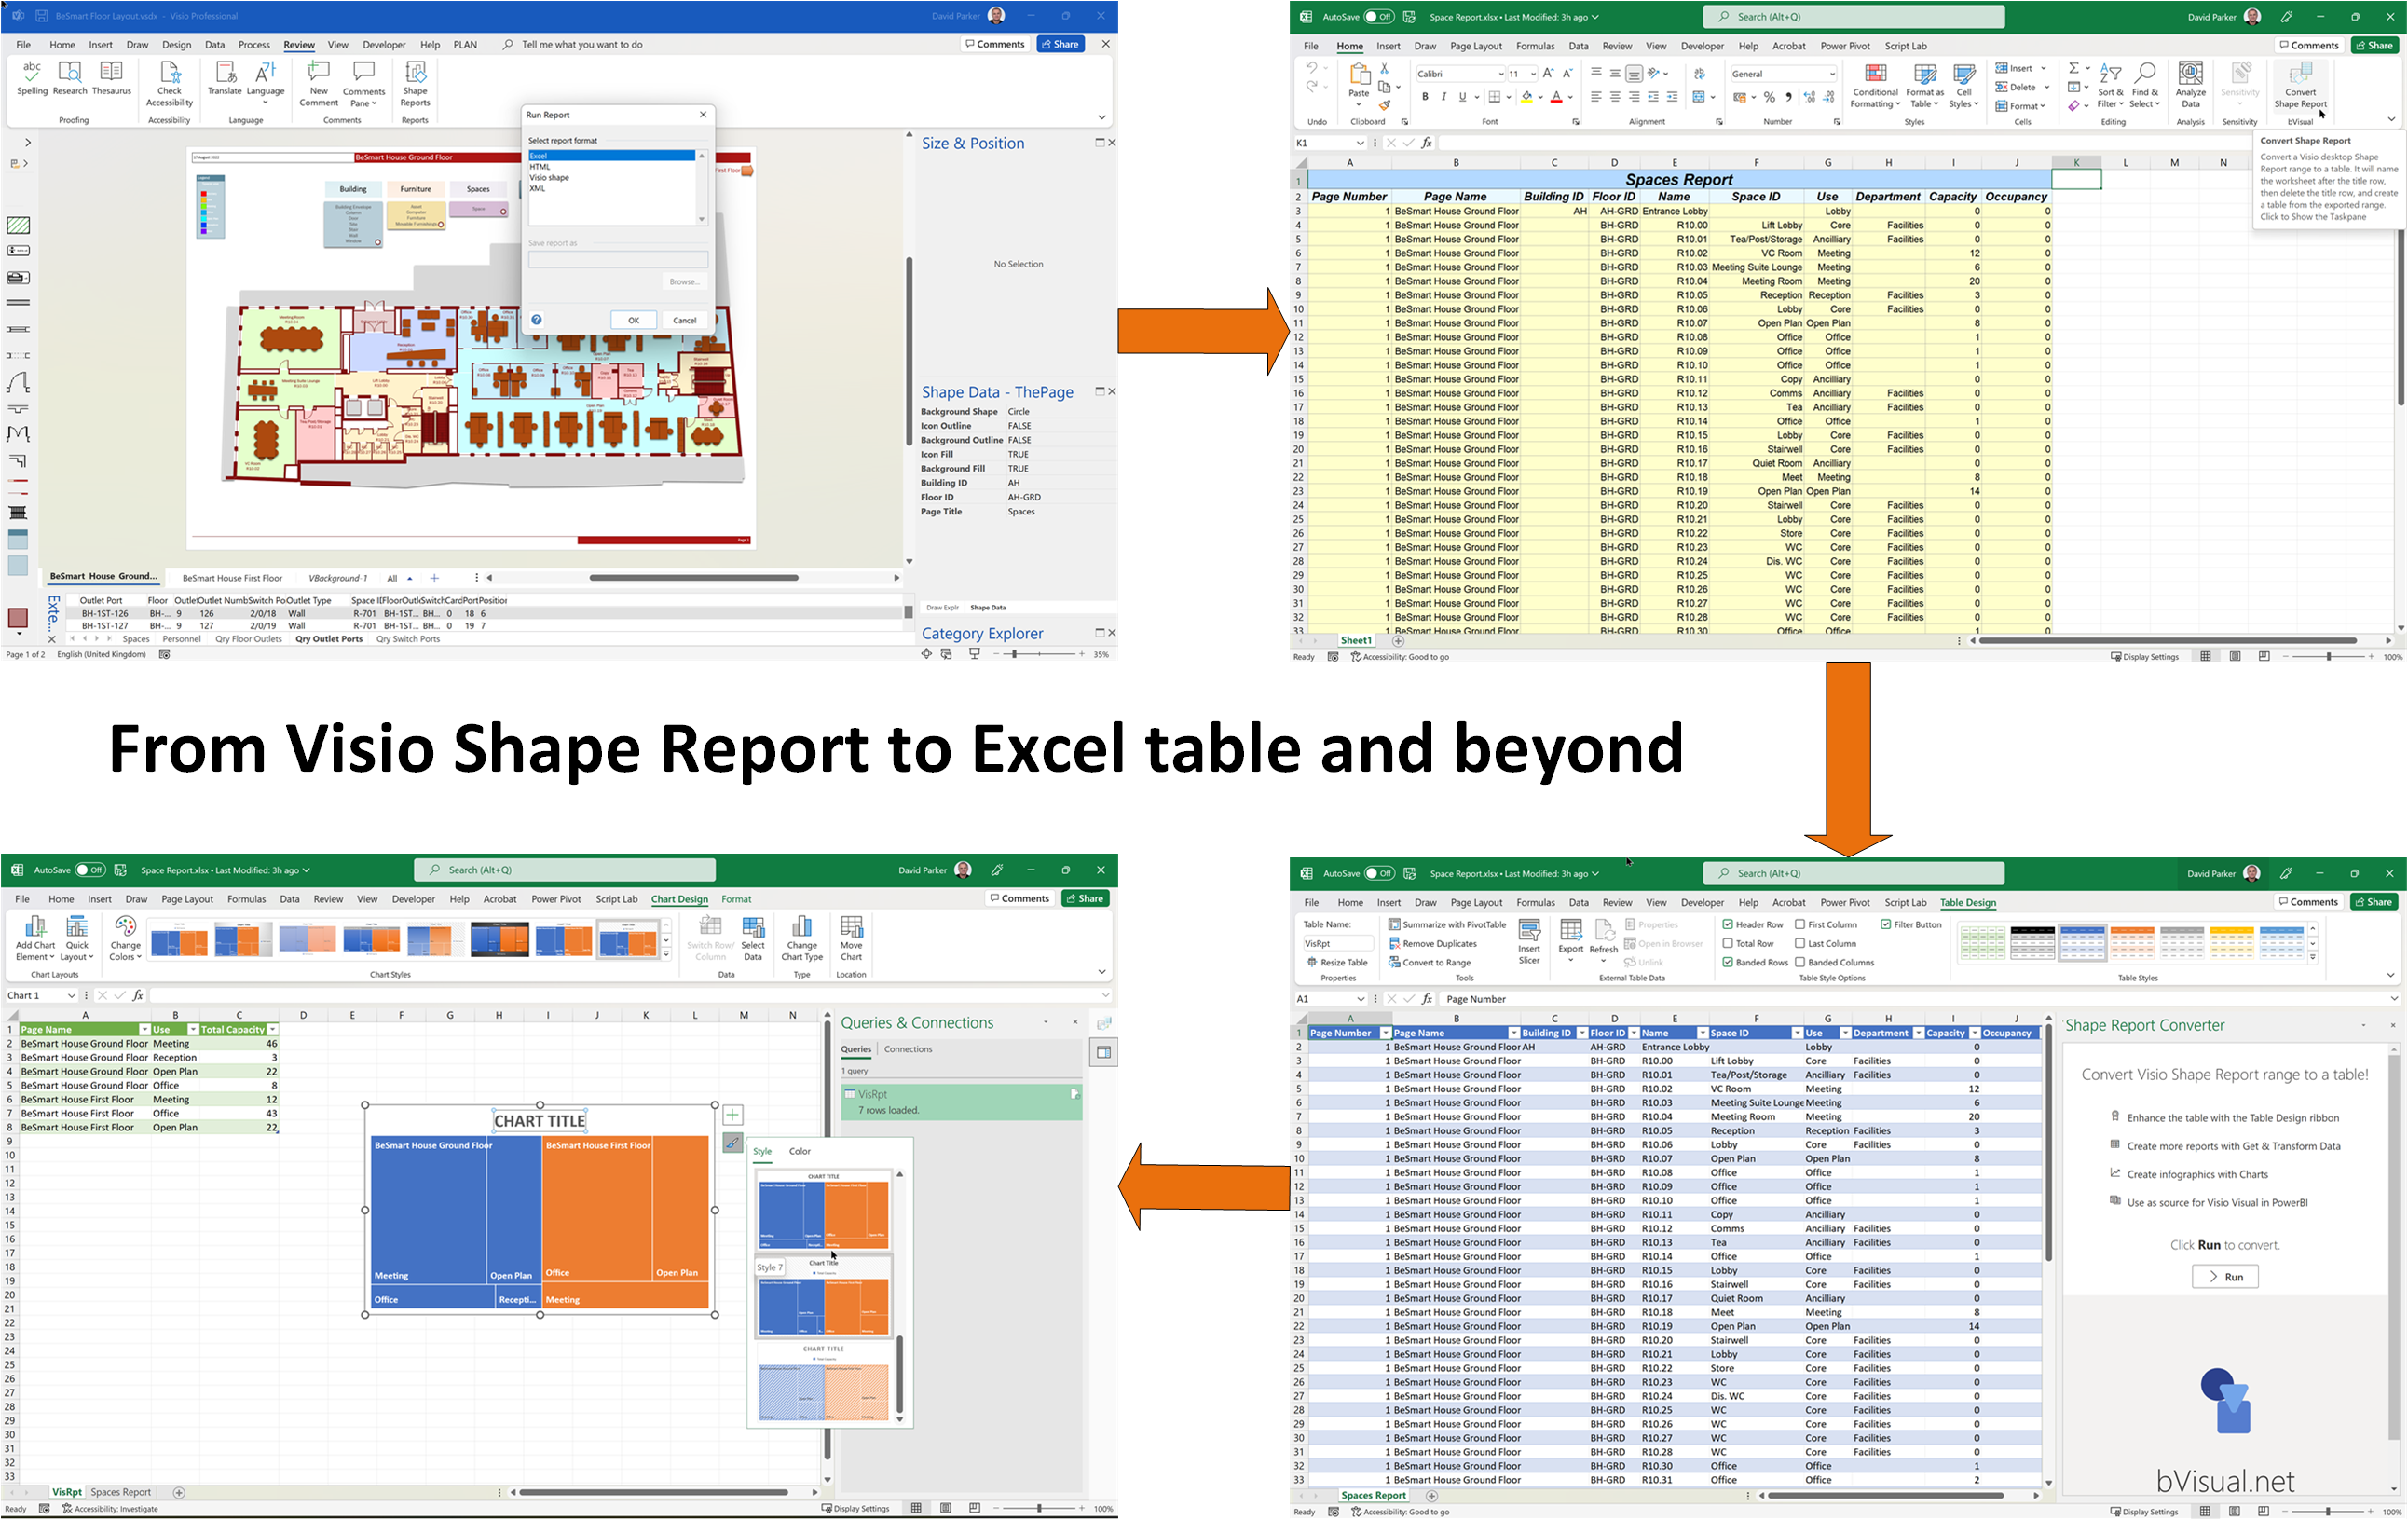
Now available! Shape Report Converter is an add-in for Excel that converts an exported Visio Shape Report to a table.
Once a Shape Report range has been converted to a table, then you can:
- Enhance the table with the Table Design ribbon
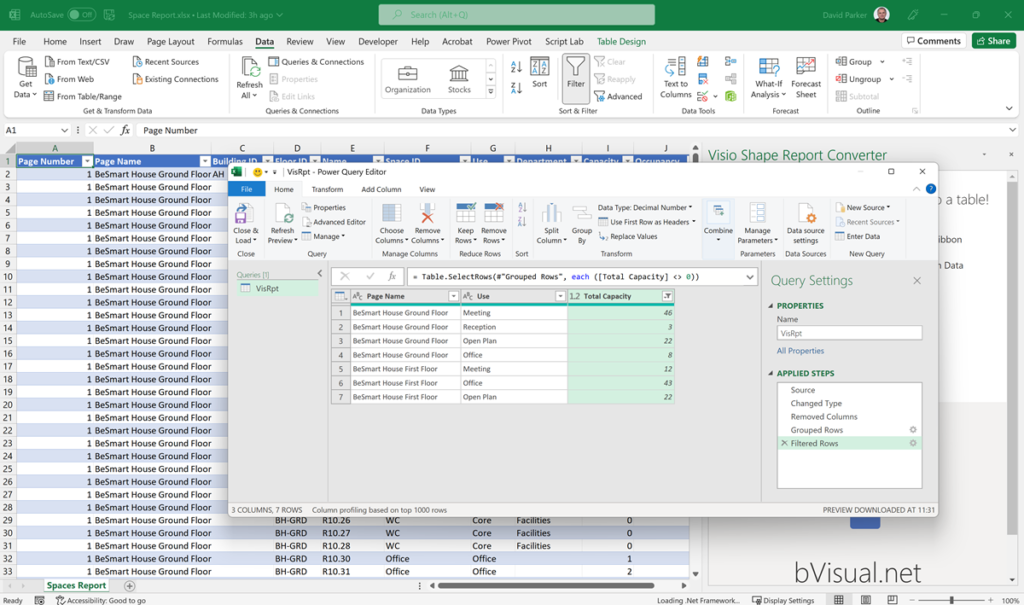
- Create more reports with Get & Transform Data
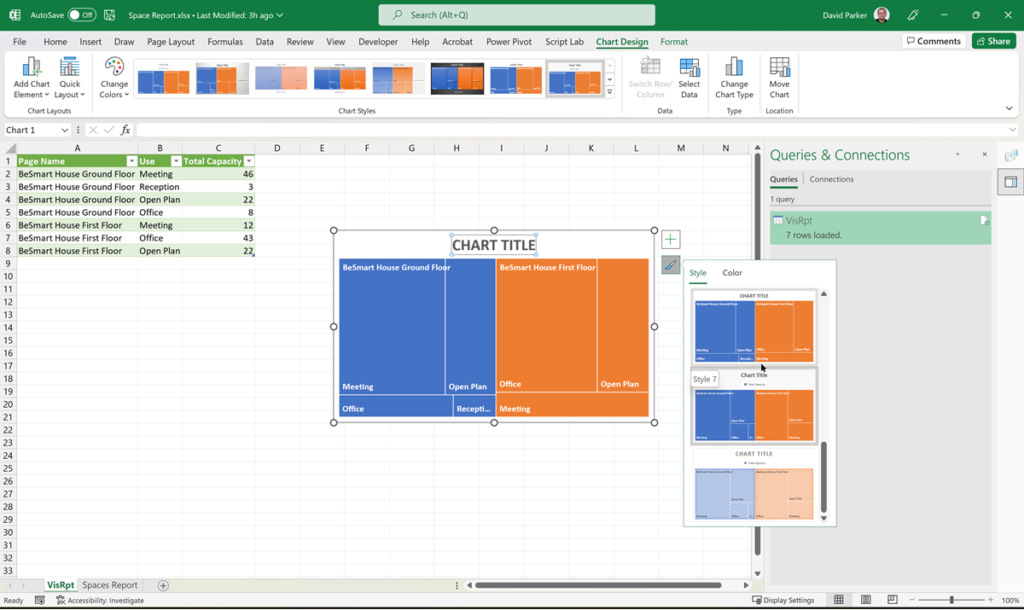
- Create infographics with Charts
- Use as a source for Visio Visual in PowerBI
View in Microsoft AppSource
Microsoft Visio for Desktop has always had the ability to create reports from the shapes on each page. However, it has limited formatting and grouping capabilities. Therefore, it is much better to use Excel to reshape the data, but the built-in Shape Reports tool only exports to an Excel named range, and with an additional title row above the column headers.
This add-in will convert the range to a modern table, and name the worksheet with the title. That’s all it does … one click and it is transformed!
Once converted, the data is much more useful!
Here is a video demonstrating how easy it is to export data from Visio to Excel, then converting the range to a table:
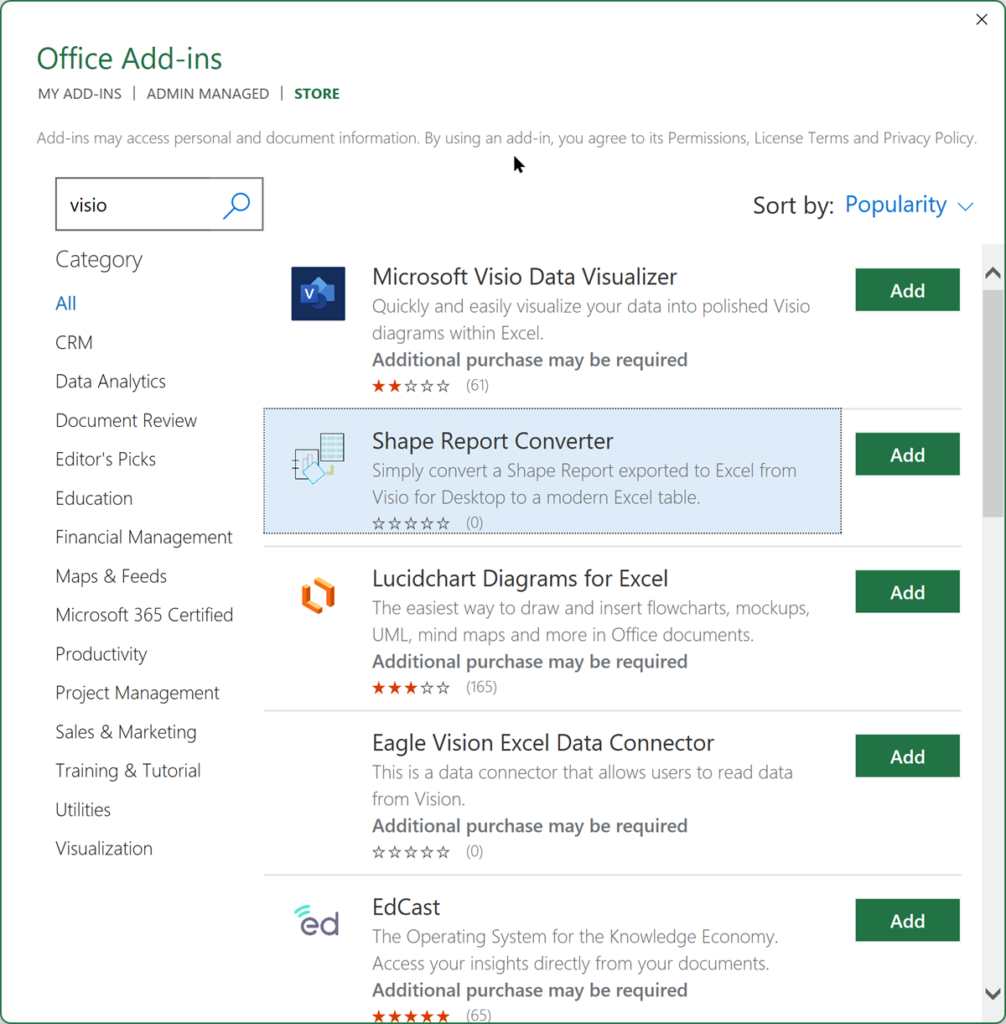
In Excel, Insert / Add-ins / Get Add-ins, and search for Visio or Shape or Converter
Pushing Data Visualizer in Visio beyond its limits
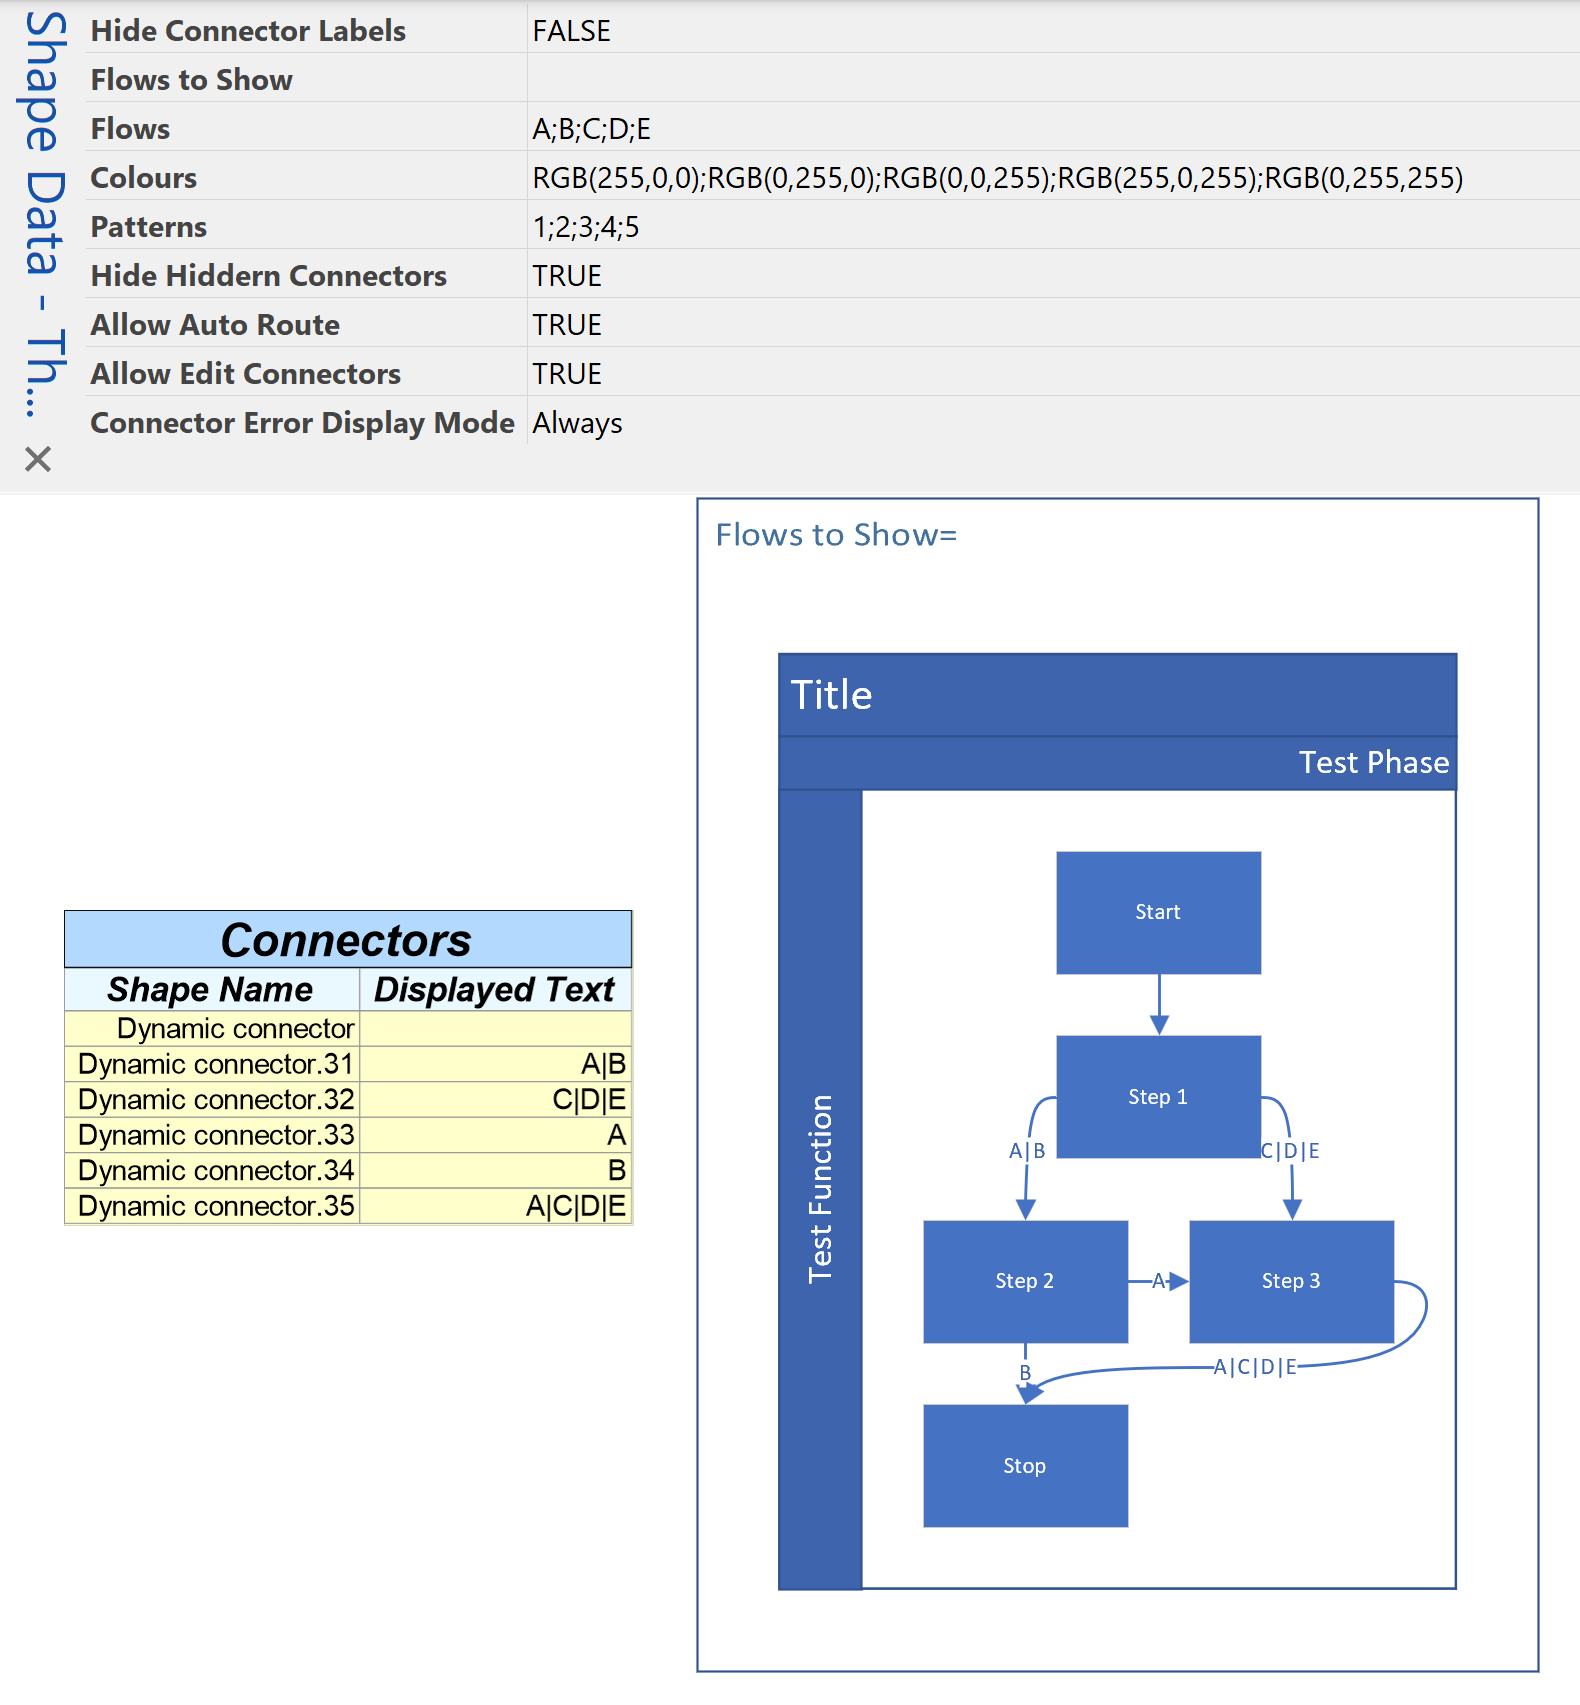
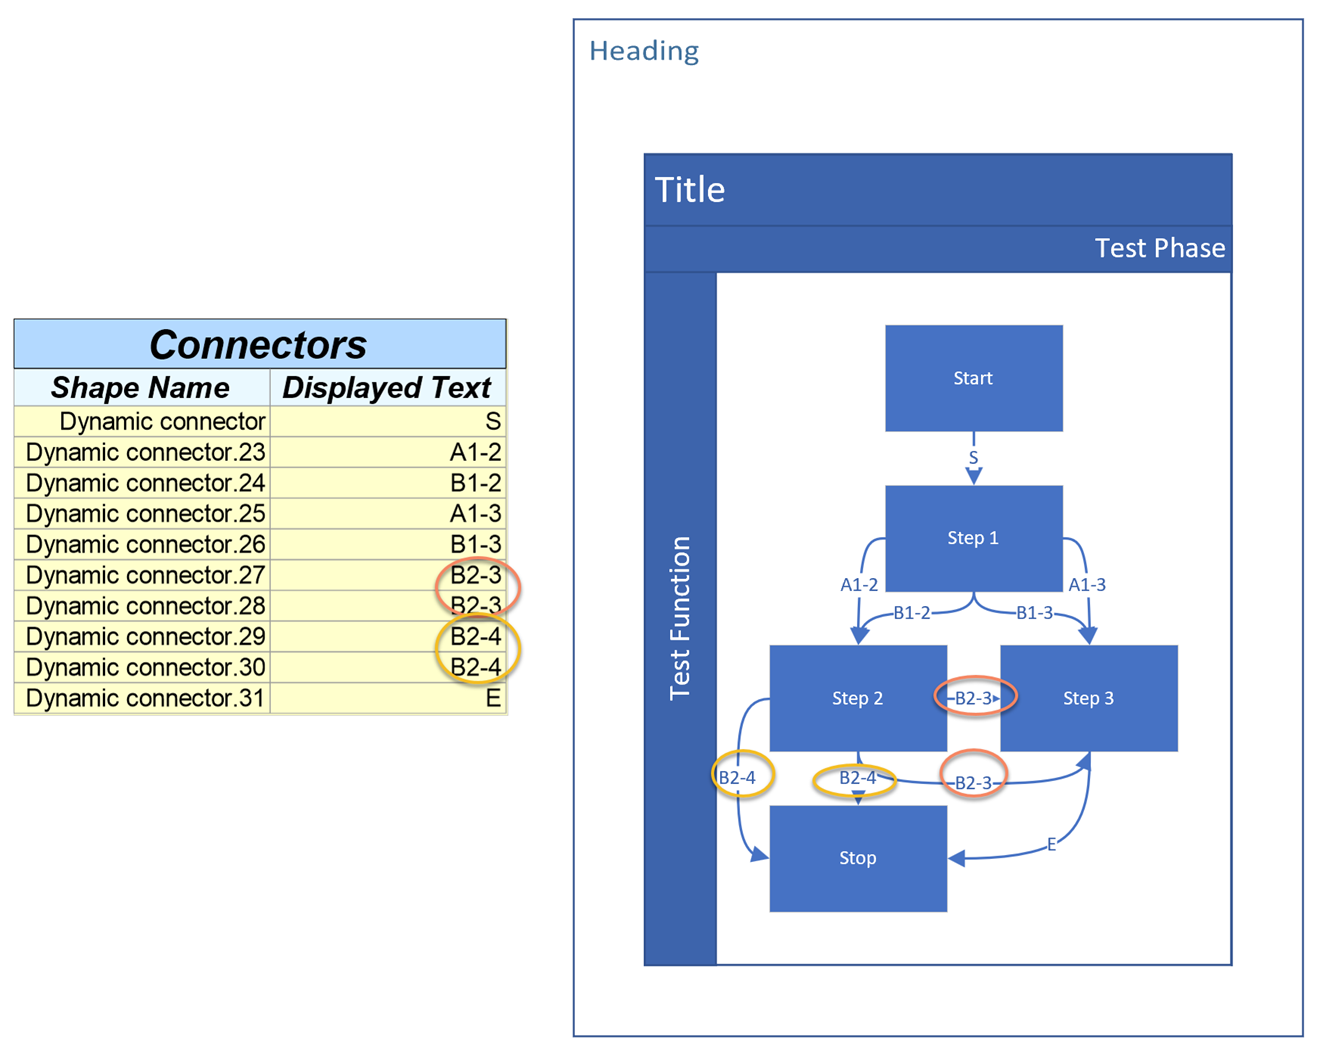
My last post was about some of the lessons learnt when trying to push Data Visualizer to its limits, but this one has some ways of overcoming these limitations. The main lesson learnt is that DV binds the shapes within the DV container shape, CFF Data Visualizer, and controls some of the ShapeSheet cells that…
Pushing Data Visualizer in Visio to the limits!
Regular readers of my blog will know that I like to use the Data Visualizer (DV) in Visio Plan 2, but I recently tried to help a user who really decided to push it to the limits. In this scenario, there were multiple connections, but with different labels, being created between the same flowchart shapes,…
Visio Shape Report Converter Excel add-in available
I am delighted to announce that I have just had my first Excel add-in accepted in the Office Add-ins Store! It is called Shape Report Converter because all it does is convert a Shape Report converted from Visio for Desktop to a modern Excel table with one click! It isn’t a complicated add-in, and it…
A Visio List Shape is also a Container
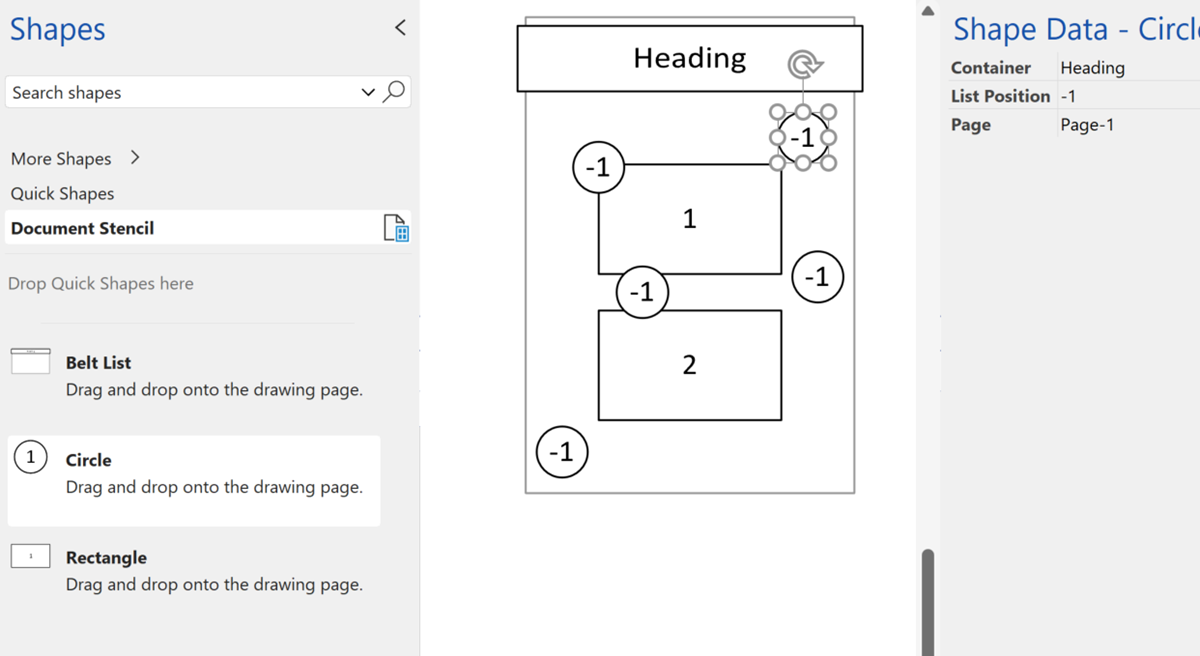
Structured diagrams have been around in Microsoft Visio since 2010 and I have always known that list shapes are a specialized container shape, however it still came as a surprise to me recently that a list shape can simultaneously act as a container shape! There are a few examples of both container and list shapes…
Automatic Line and Segment Lengths in Visio
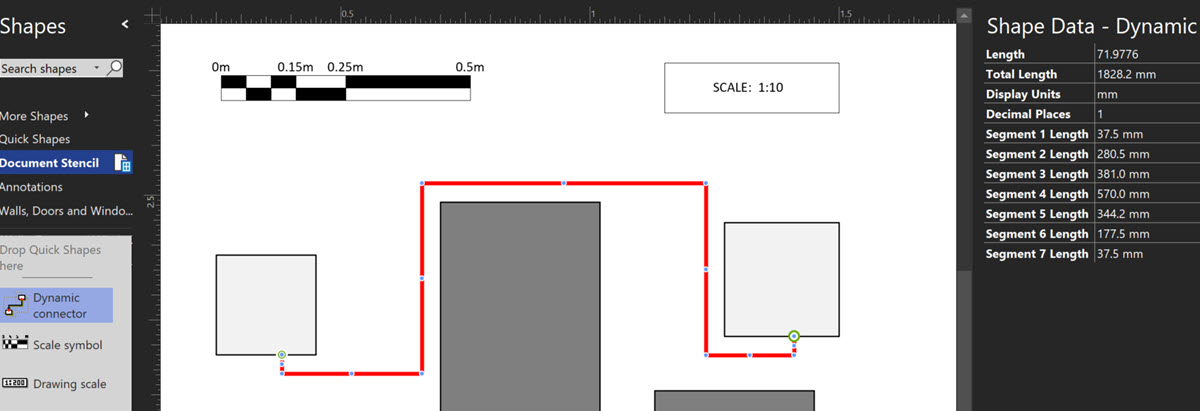
Many years ago, I wrote some VBA code to calculate the length of a multi-segment line in Visio, see Automating Area and Perimeter Length Shape Data , but Microsoft have since provided a handy ShapeSheet function, PATHLENGTH(…), to do the same without any VBA. The function is described on one of the pages in Visio…
Visio 2010 MVP Session videos reprise
Back in 2012, my fellow Visio MVPs, Scott Helmers and Chris Roth, and I recorded a series of 24 videos about Visio 2010. They were first hosted on Microsoft’s web site, then they put them up on YouTube, they they got deleted :-(. Well, we have managed to retrieve them, and put them back up…
