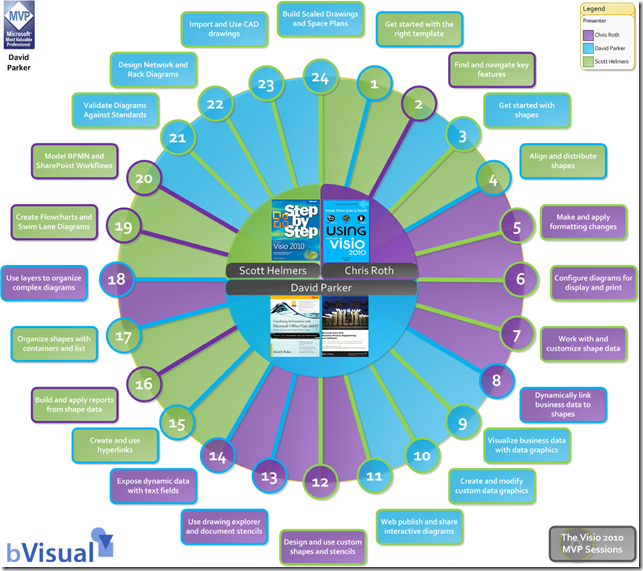
I wasn’t sure whether to call it a wheel or a clock-face, but since there are 24 MVP Visio 2010 sessions (see http://visio.microsoft.com/mvpsessions ) I decided on a wheel … so in this blog I present my alternative interface into these sessions, created in Visio of course!
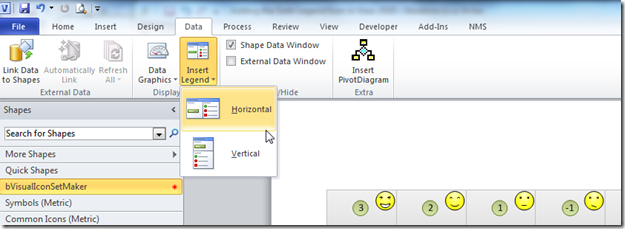
I created an Excel workbook in which I listed all of the sessions, their descriptions, and links to the video and any supporting files. I then created the wheel diagram, and used Link Data to Shapes to automatically add Shape Data rows and hyperlinks to each shape, and Data Graphics to automatically colour each shape.
Finally, I saved the Visio page as web pages (VML, XAML and SVG format output), and as pdf.
Open the VML web output : http://www.bvisual.net/resources/mvpsessionsIE.htm
Open the SVG web output : http://www.bvisual.net/resources/mvpsessions.htm
Open the XAML web output : http://www.bvisual.net/resources/mvpsessionsX.htm
Open the Visio file : http://sdrv.ms/NYHH8V
Open the Excel file : http://sdrv.ms/OI3EKU
Open the pdf : http://sdrv.ms/OI2i2I
UPDATE : see http://blog.bvisual.net/2013/07/08/mvp-sessions-for-getting-started-with-visio-2010/


