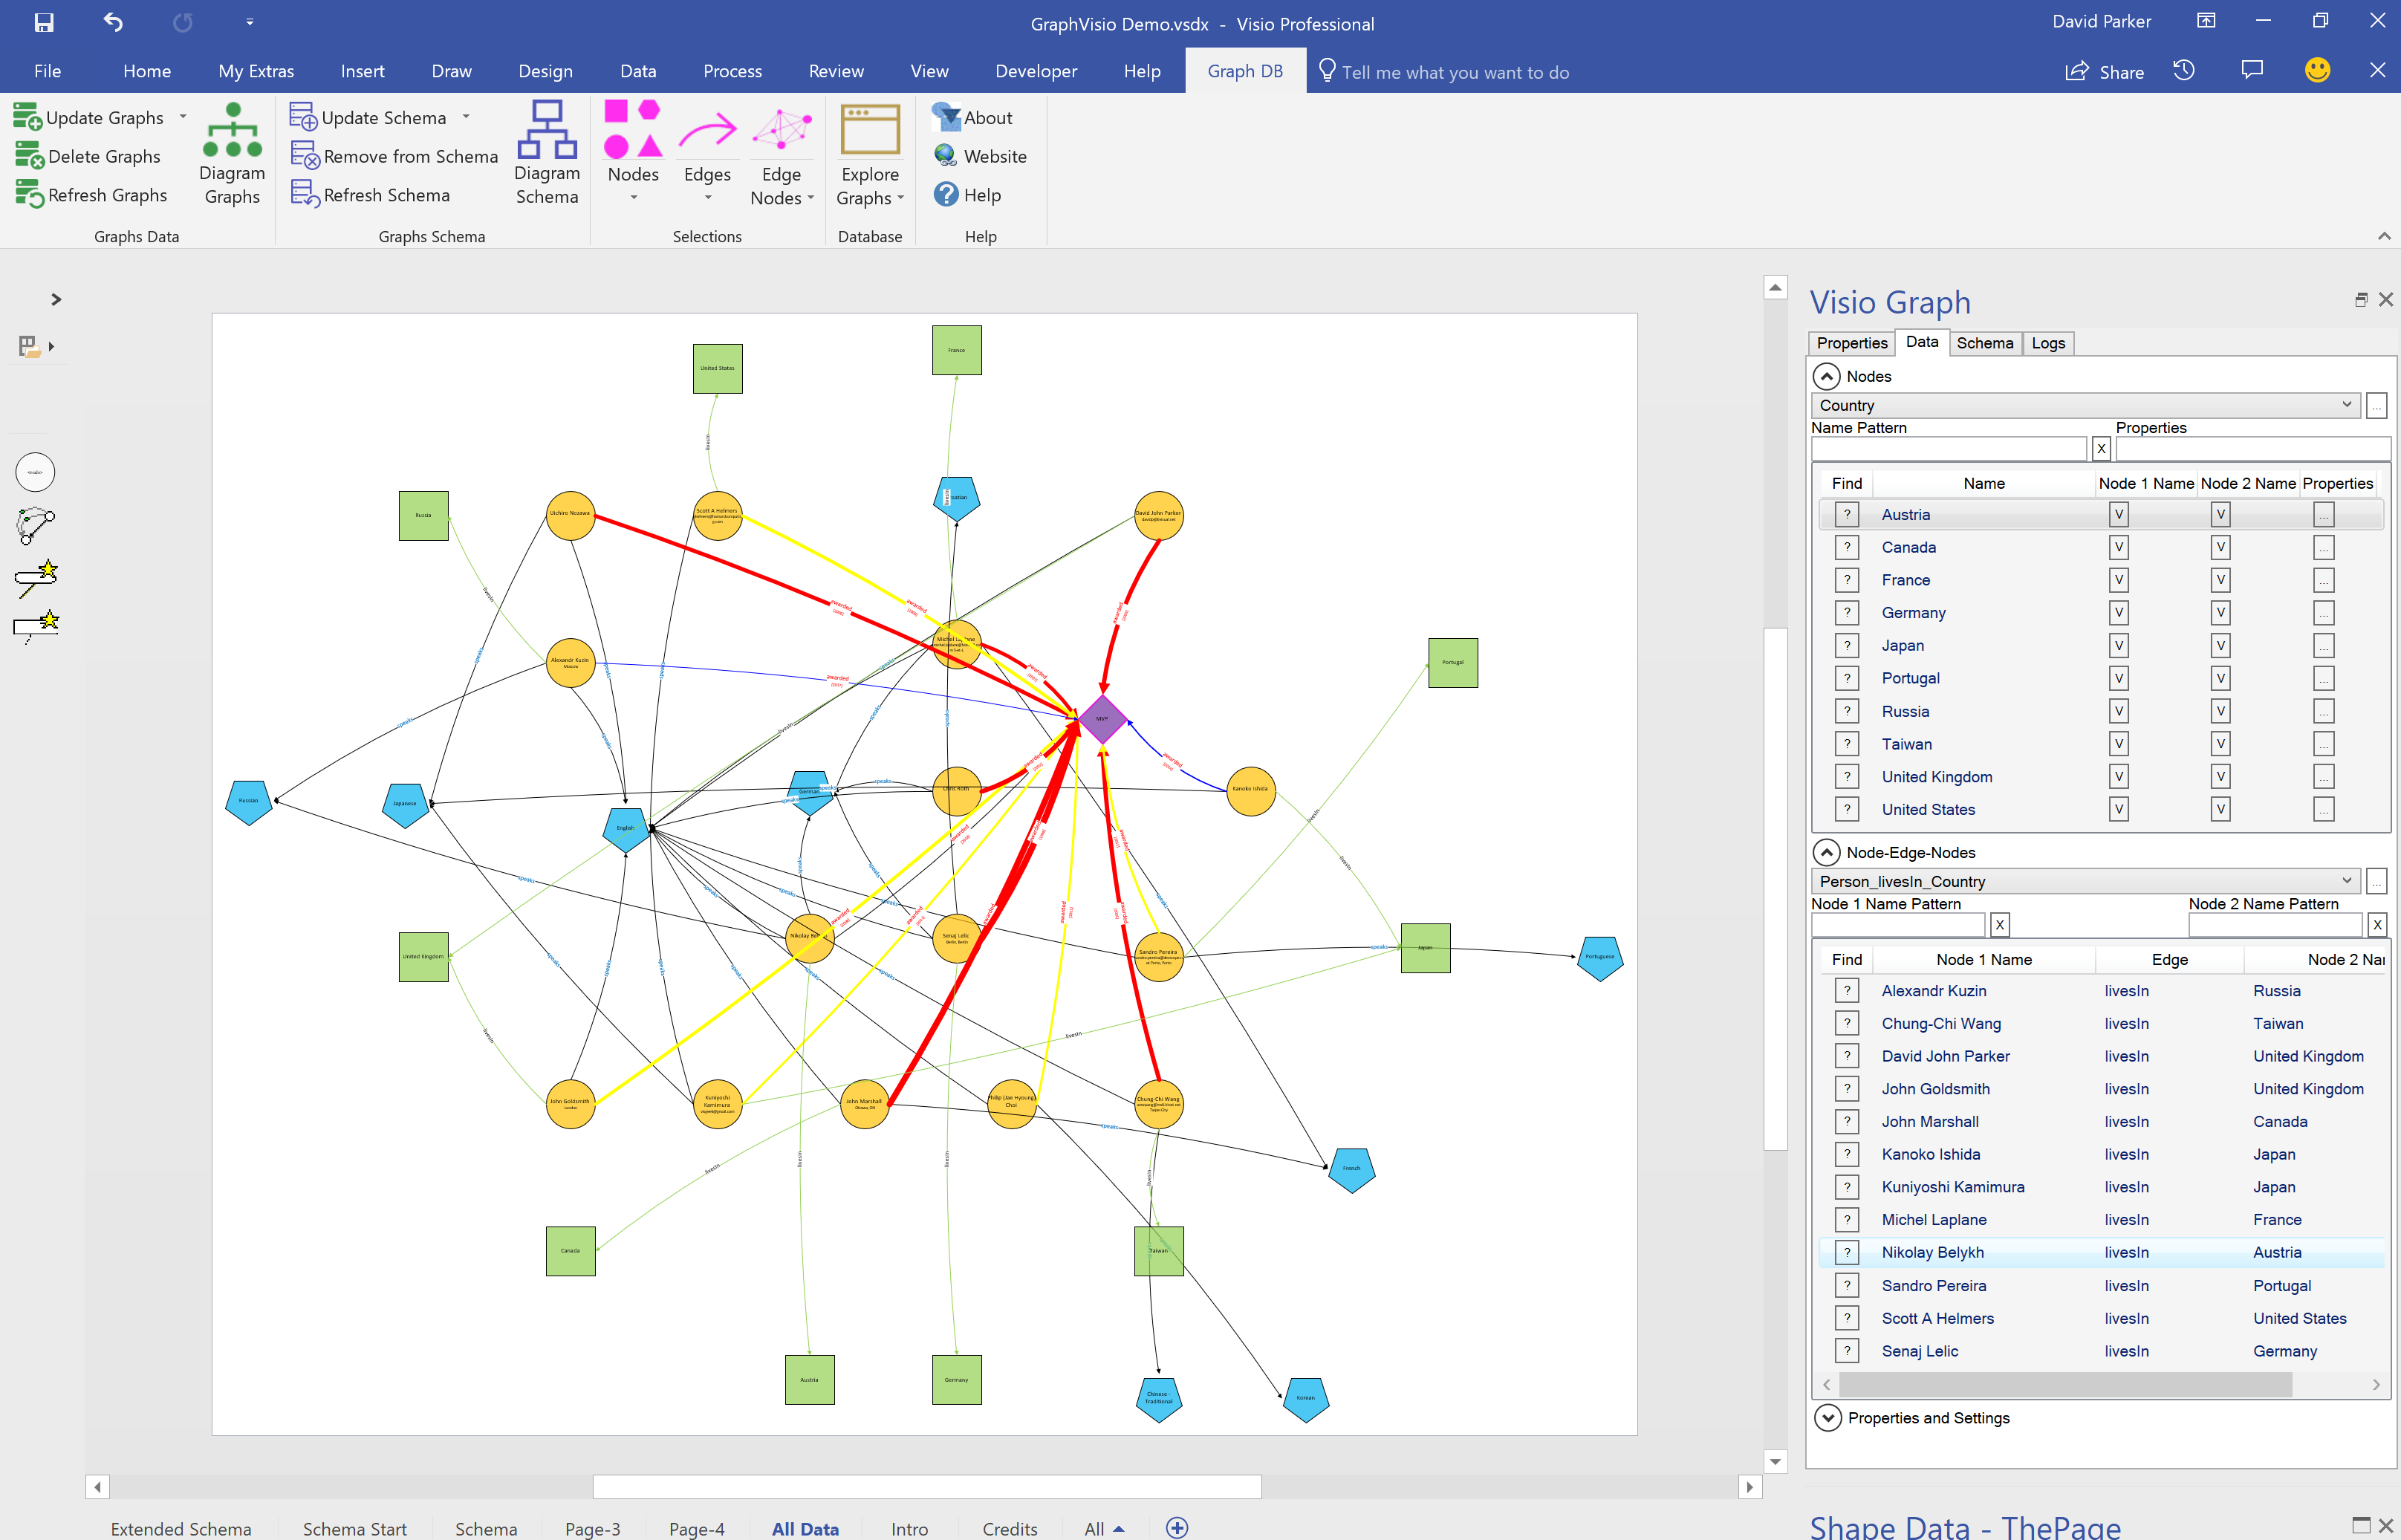
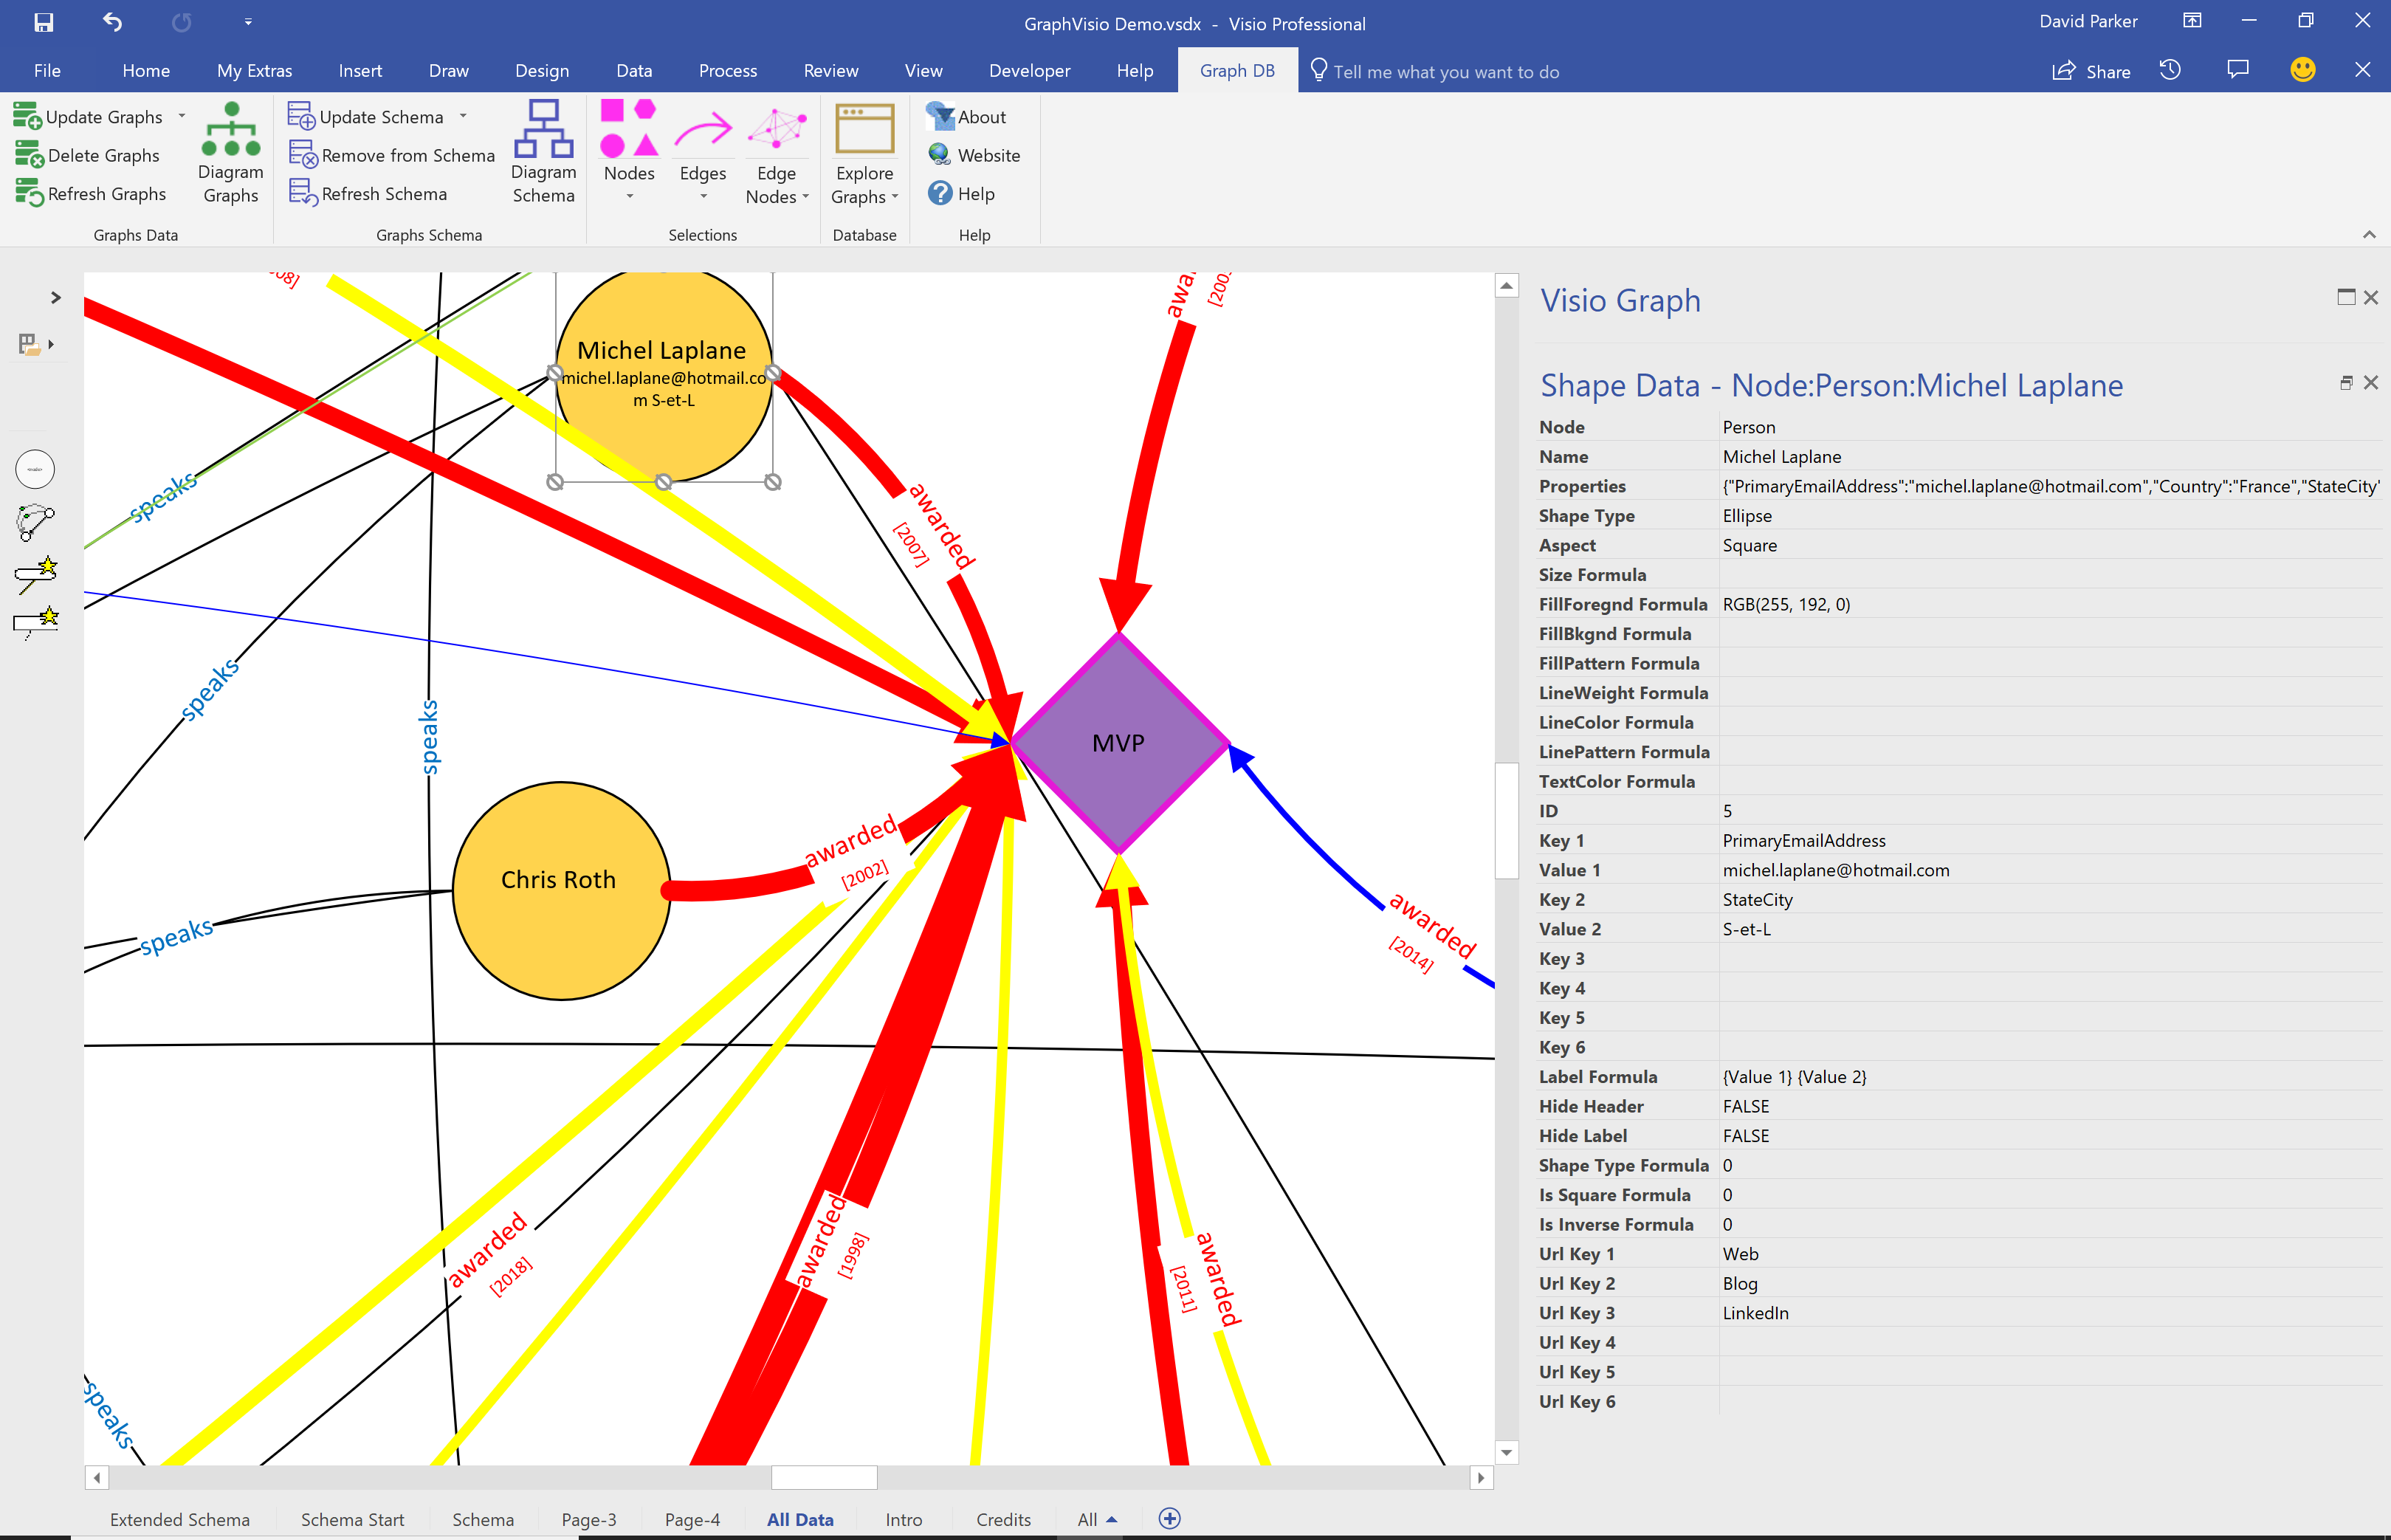
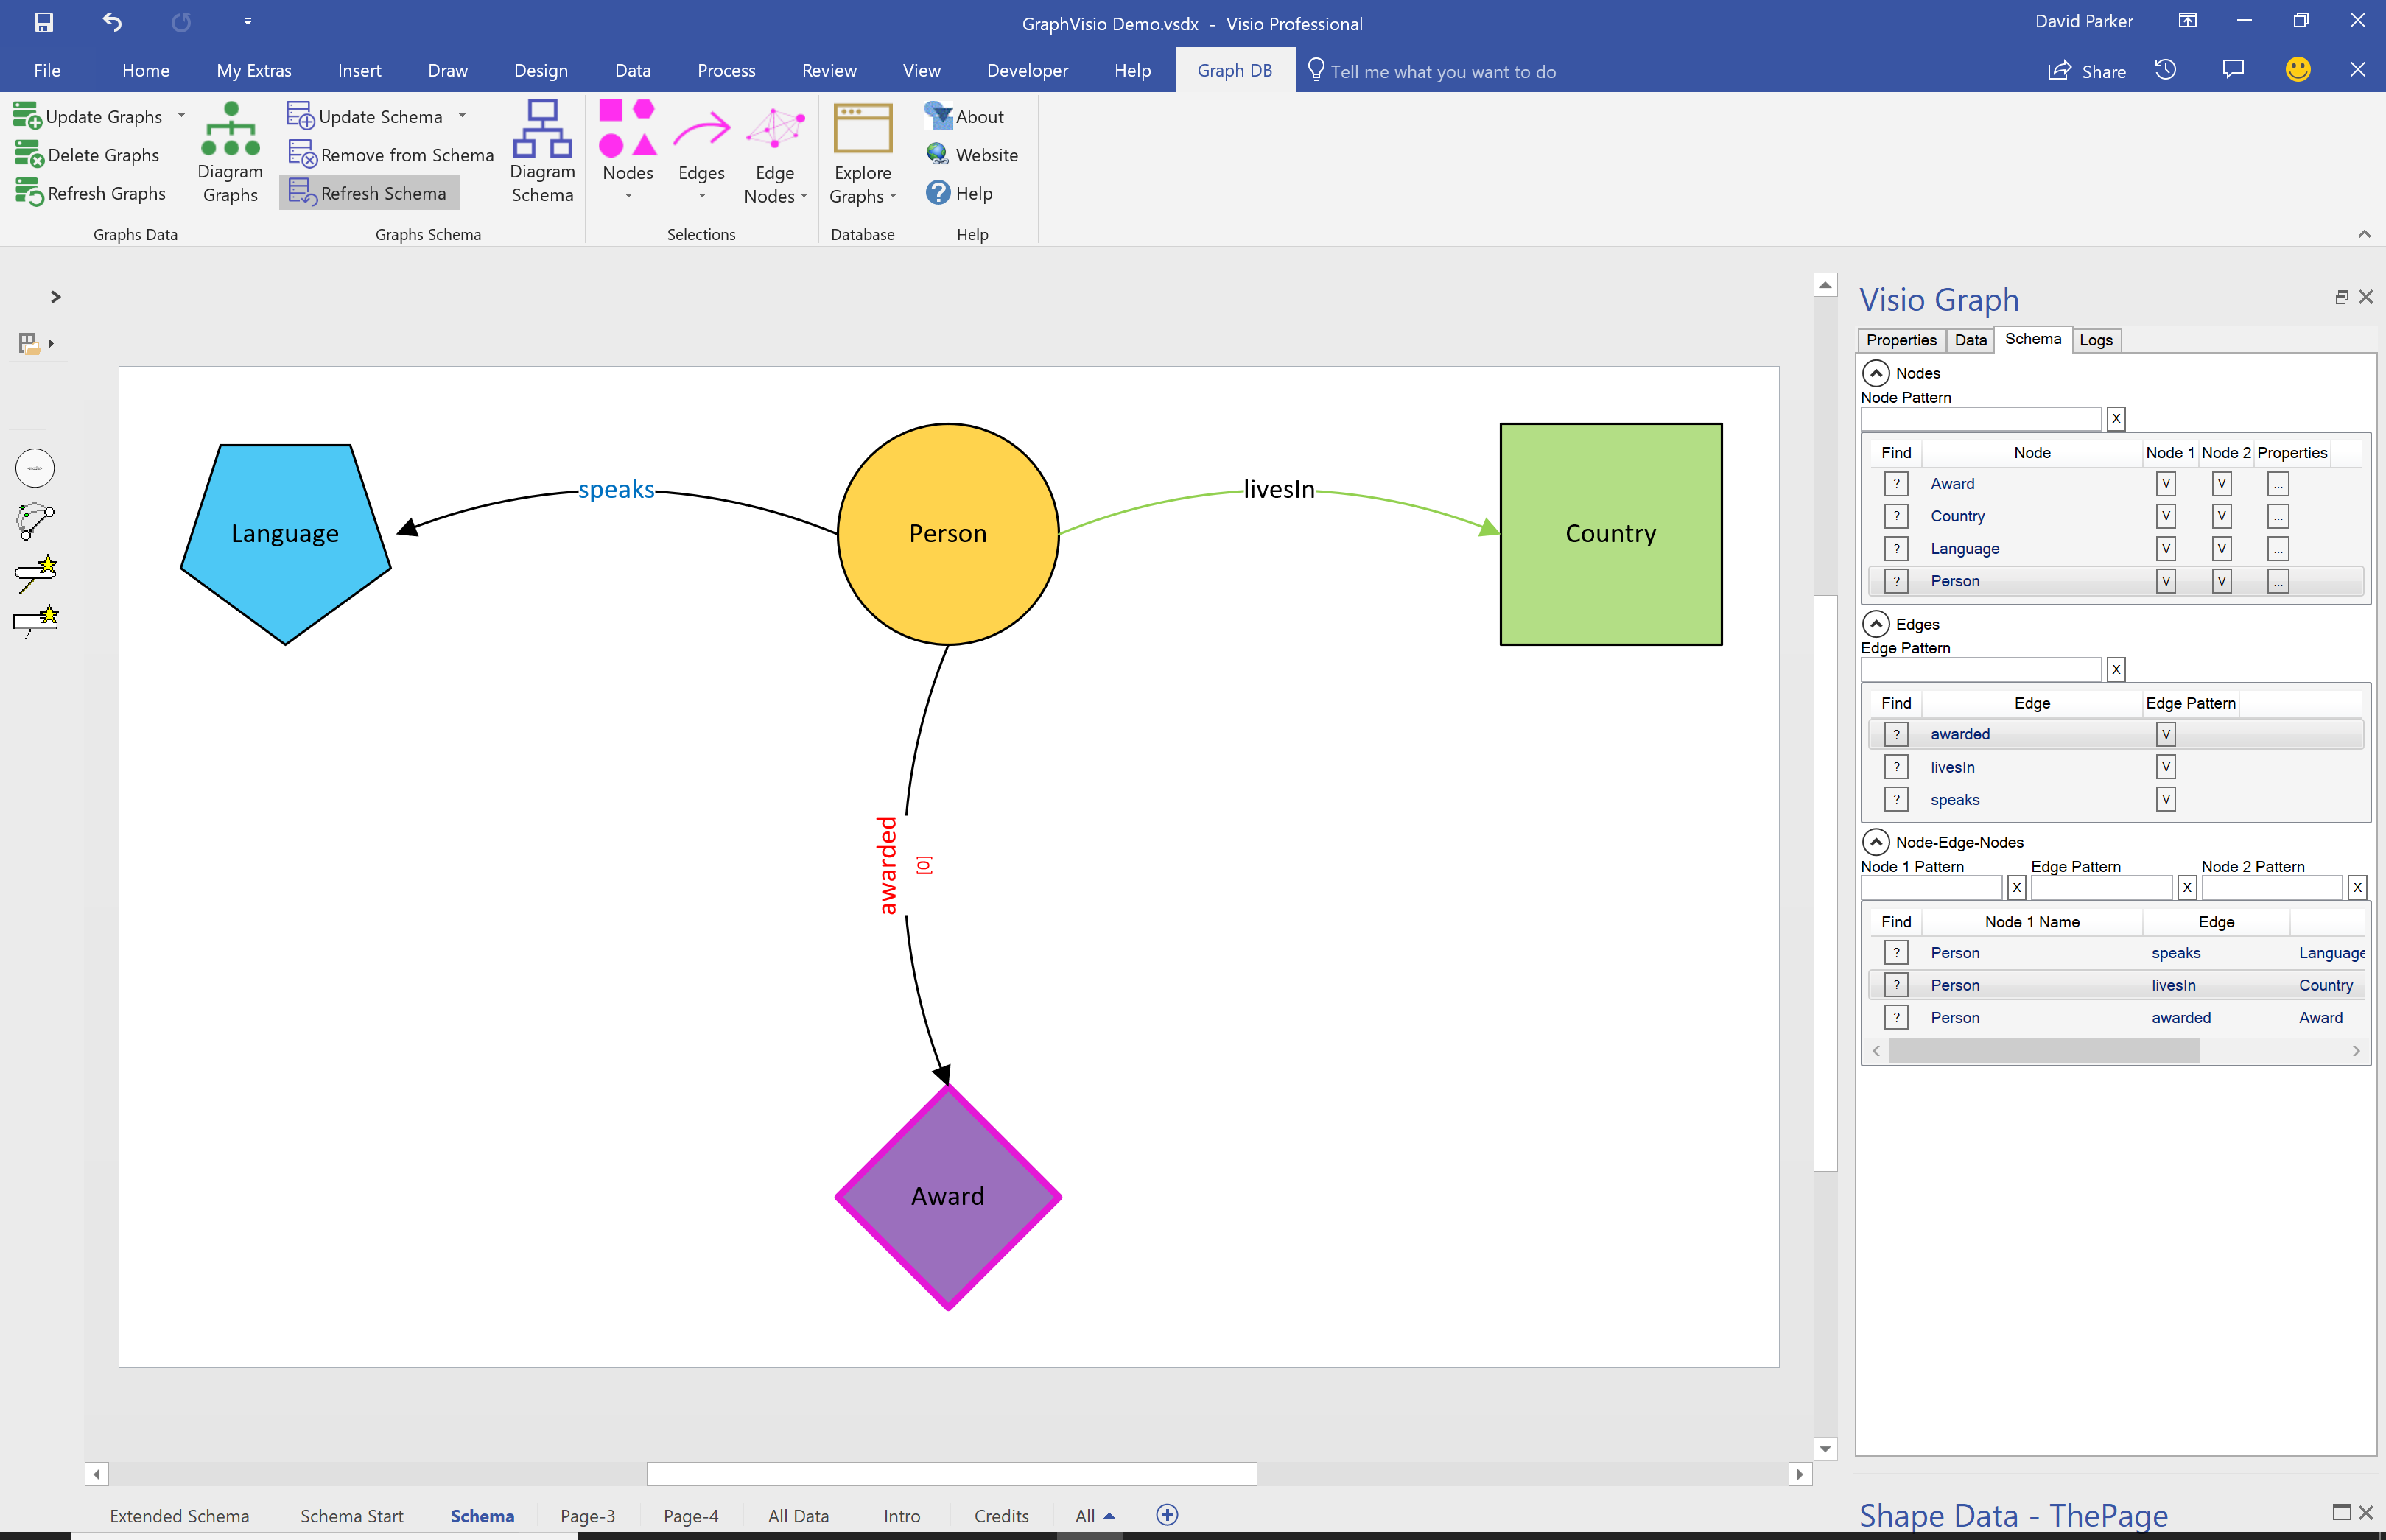
I have been continuing to develop a Visio interface for SQL Server 2017 Graph databases because I believe it will be of great use in many scenarios, such as crime investigations, company and shareholder relationships, and anywhere that defining and illustrating links between items is important.
SQL Server 2017 introduced graph tables, Nodes & Edges, which is a great way of storing relationships between objects. However, there is no easy way of creating or visualising this information currently. Visio is a data-diagramming application, so what could be more natural than to use Visio to create and visualise the data?
All Visio shapes can contain data, and are easily connected to each other, so creating meaningful relationships is a breeze. Visio diagrams can be automated too, and this solution is a C# VSTO add-in that enhances the normal Visio interface. The application also has the ability to define the shapes, labels, colours and appearance from the data values, which are stored as Json objects.
An import from Excel is also provided because of its tremendous ability to gather and re-shape data from so many different sources.
The solution automatically creates SQL views of each graph table so that the data can be linked to Visio and used in Power BI too.
Visio
What is the difference between a line and a [dynamic] connector in Visio?
When I have reviewed some of the criticisms of connecting shapes in Visio on the web, it has been clear that some users have a misunderstanding about lines and connectors. It is not surprising really because the Microsoft Visio help documentation does not currently make the distinction clear. A connector shape is used to connect two shapes together, whereas a line is normally just a straight line. As usual with Visio though, this is not the whole story because a line can be used to connect two shapes together, and it can be turned into a dynamic connector. I will try to explain myself in this article.
The normal way to connect two shapes together is to use the Connector tool (CTRL+3) on the Home / Tools ribbon, and a line is drawn with the Line (CTRL+6) drop-down menu in the same ribbon group.
Visio Automation for IT Design & Operations – London, 25th April 2018
I am pleased to announce that I will be co-hosting a free event at the new Microsoft Reactor in Shoreditch on 25th April, aimed at showcasing Visio automation for IT design & operations. You can find more details and sign up here.
Creating Visio Validation Rules for Graph Database template
Having developed Node and Edge/ Dynamic connector masters shapes for creating Node and Edge table entries for a SQL Server 2017, I decided that I should write some validation rules. The validation feature has been in Visio since the 2010 edition, but is underused, even though I wrote a book about them … see Microsoft Visio 2013 Business Process Diagramming and Validation . I think that only six rules are necessary to validate that a page with Node and Edge shapes is well constructed before attempting to update the tables in SQL Server, or any other GraphDatabase.
Using JSON text in Visio shapes
I often create Visio masters with a fixed number of Shape Data rows, and sometimes I get requests to modify them because of changes in business needs. Well, my previous posts about Graph Databases got me thinking if it would be possible to embed JSON text in Visio shapes in some sort of meaningful way. Then the user could enter just attribute-value pairs at will, without the need for me to modify their master shape. Alternatively, the data could be inserted into the shape from a database, such as SQL server. So, in this article I discuss the suitability of JSON text in Visio shapes.
[Read more…] about Using JSON text in Visio shapesUsing Visio and PowerBI with GraphDatabase in SQLServer – Part 2
In my last article, I described how Visio can be used to input Nodes & Edges into a SQL Server graph tables (see Using #Visio and #PowerBI with #GraphDatabase in #SQLServer). In this article, I show how PowerBI can be used to create an Excel table that can then be used to automatically create a Visio diagram. This diagram can then be enhanced for reports and presentations, or used to check the validity of nodes and relationships. The shapes can then be used to update or delete edges and nodes in the database.