I have been continuing to develop a Visio interface for SQL Server 2017 Graph databases because I believe it will be of great use in many scenarios, such as crime investigations, company and shareholder relationships, and anywhere that defining and illustrating links between items is important.
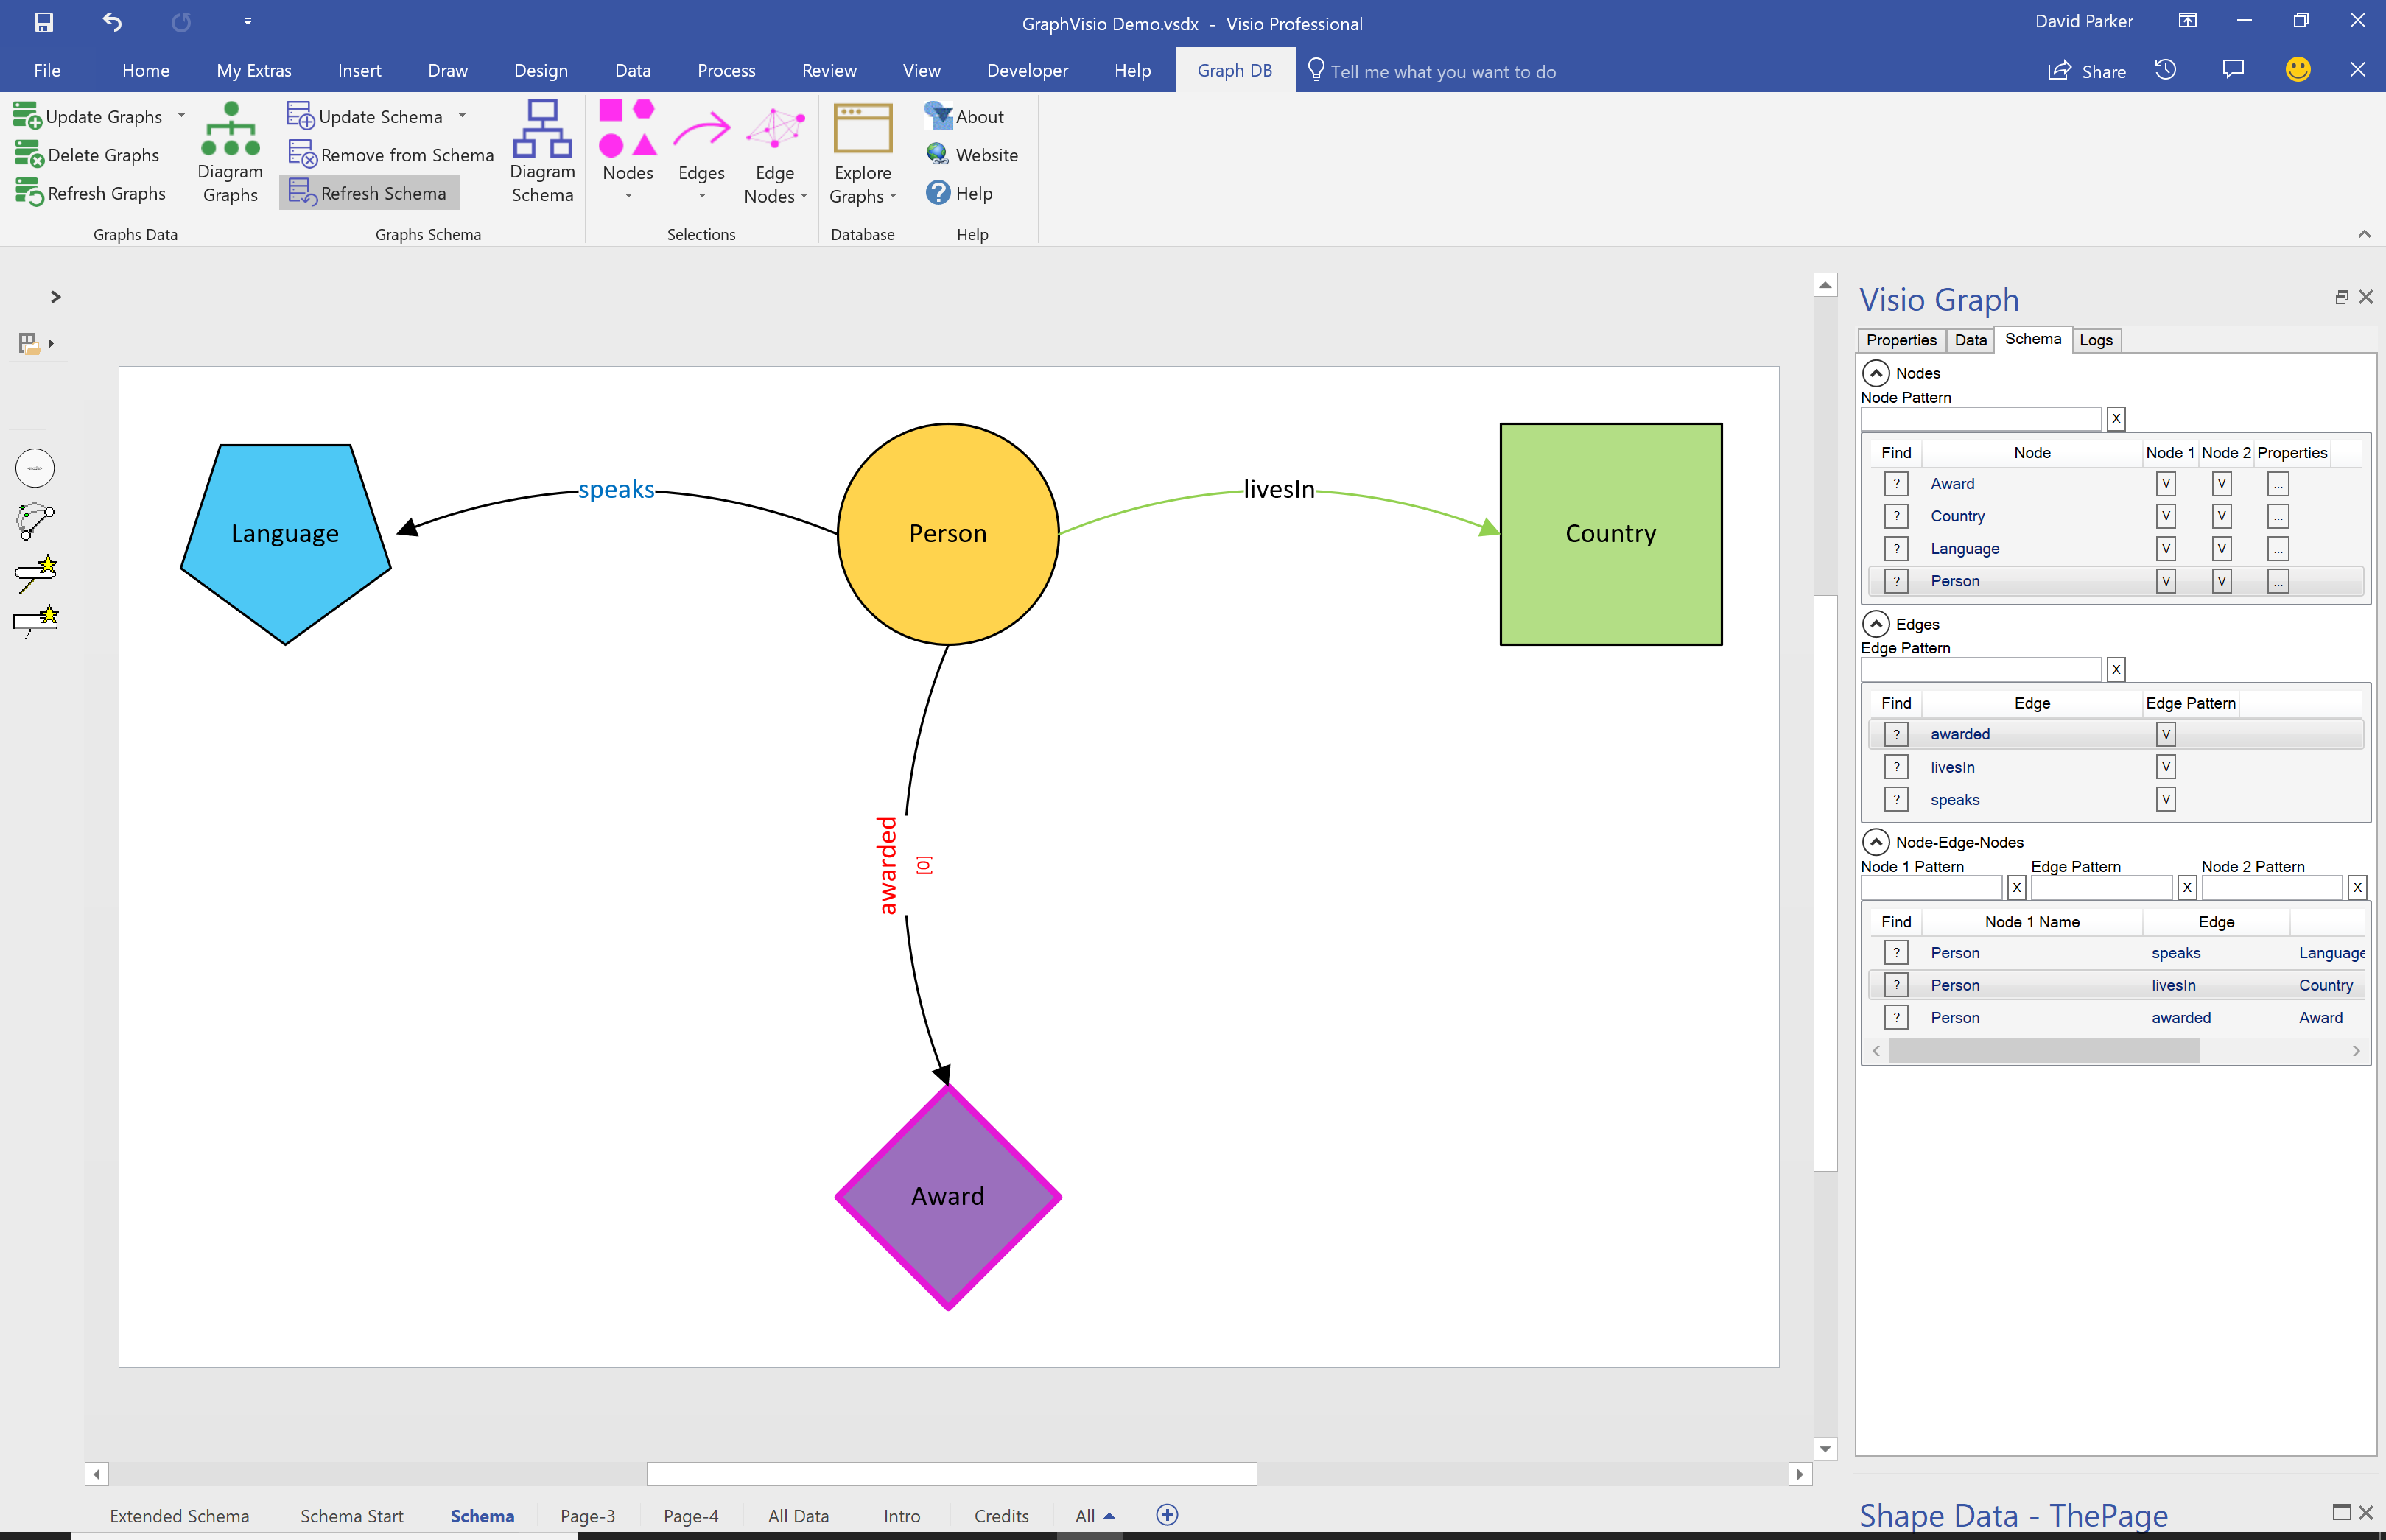
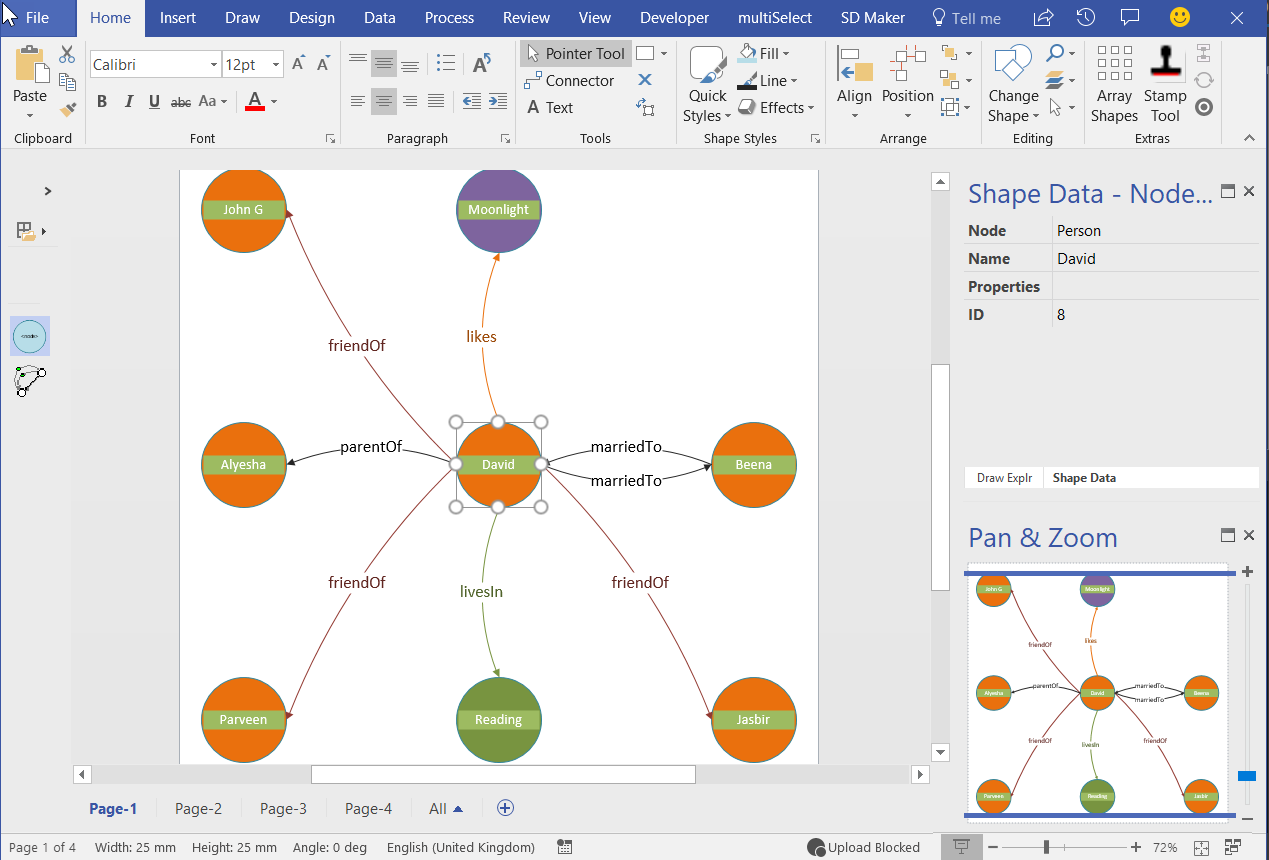
SQL Server 2017 introduced graph tables, Nodes & Edges, which is a great way of storing relationships between objects. However, there is no easy way of creating or visualising this information currently. Visio is a data-diagramming application, so what could be more natural than to use Visio to create and visualise the data?
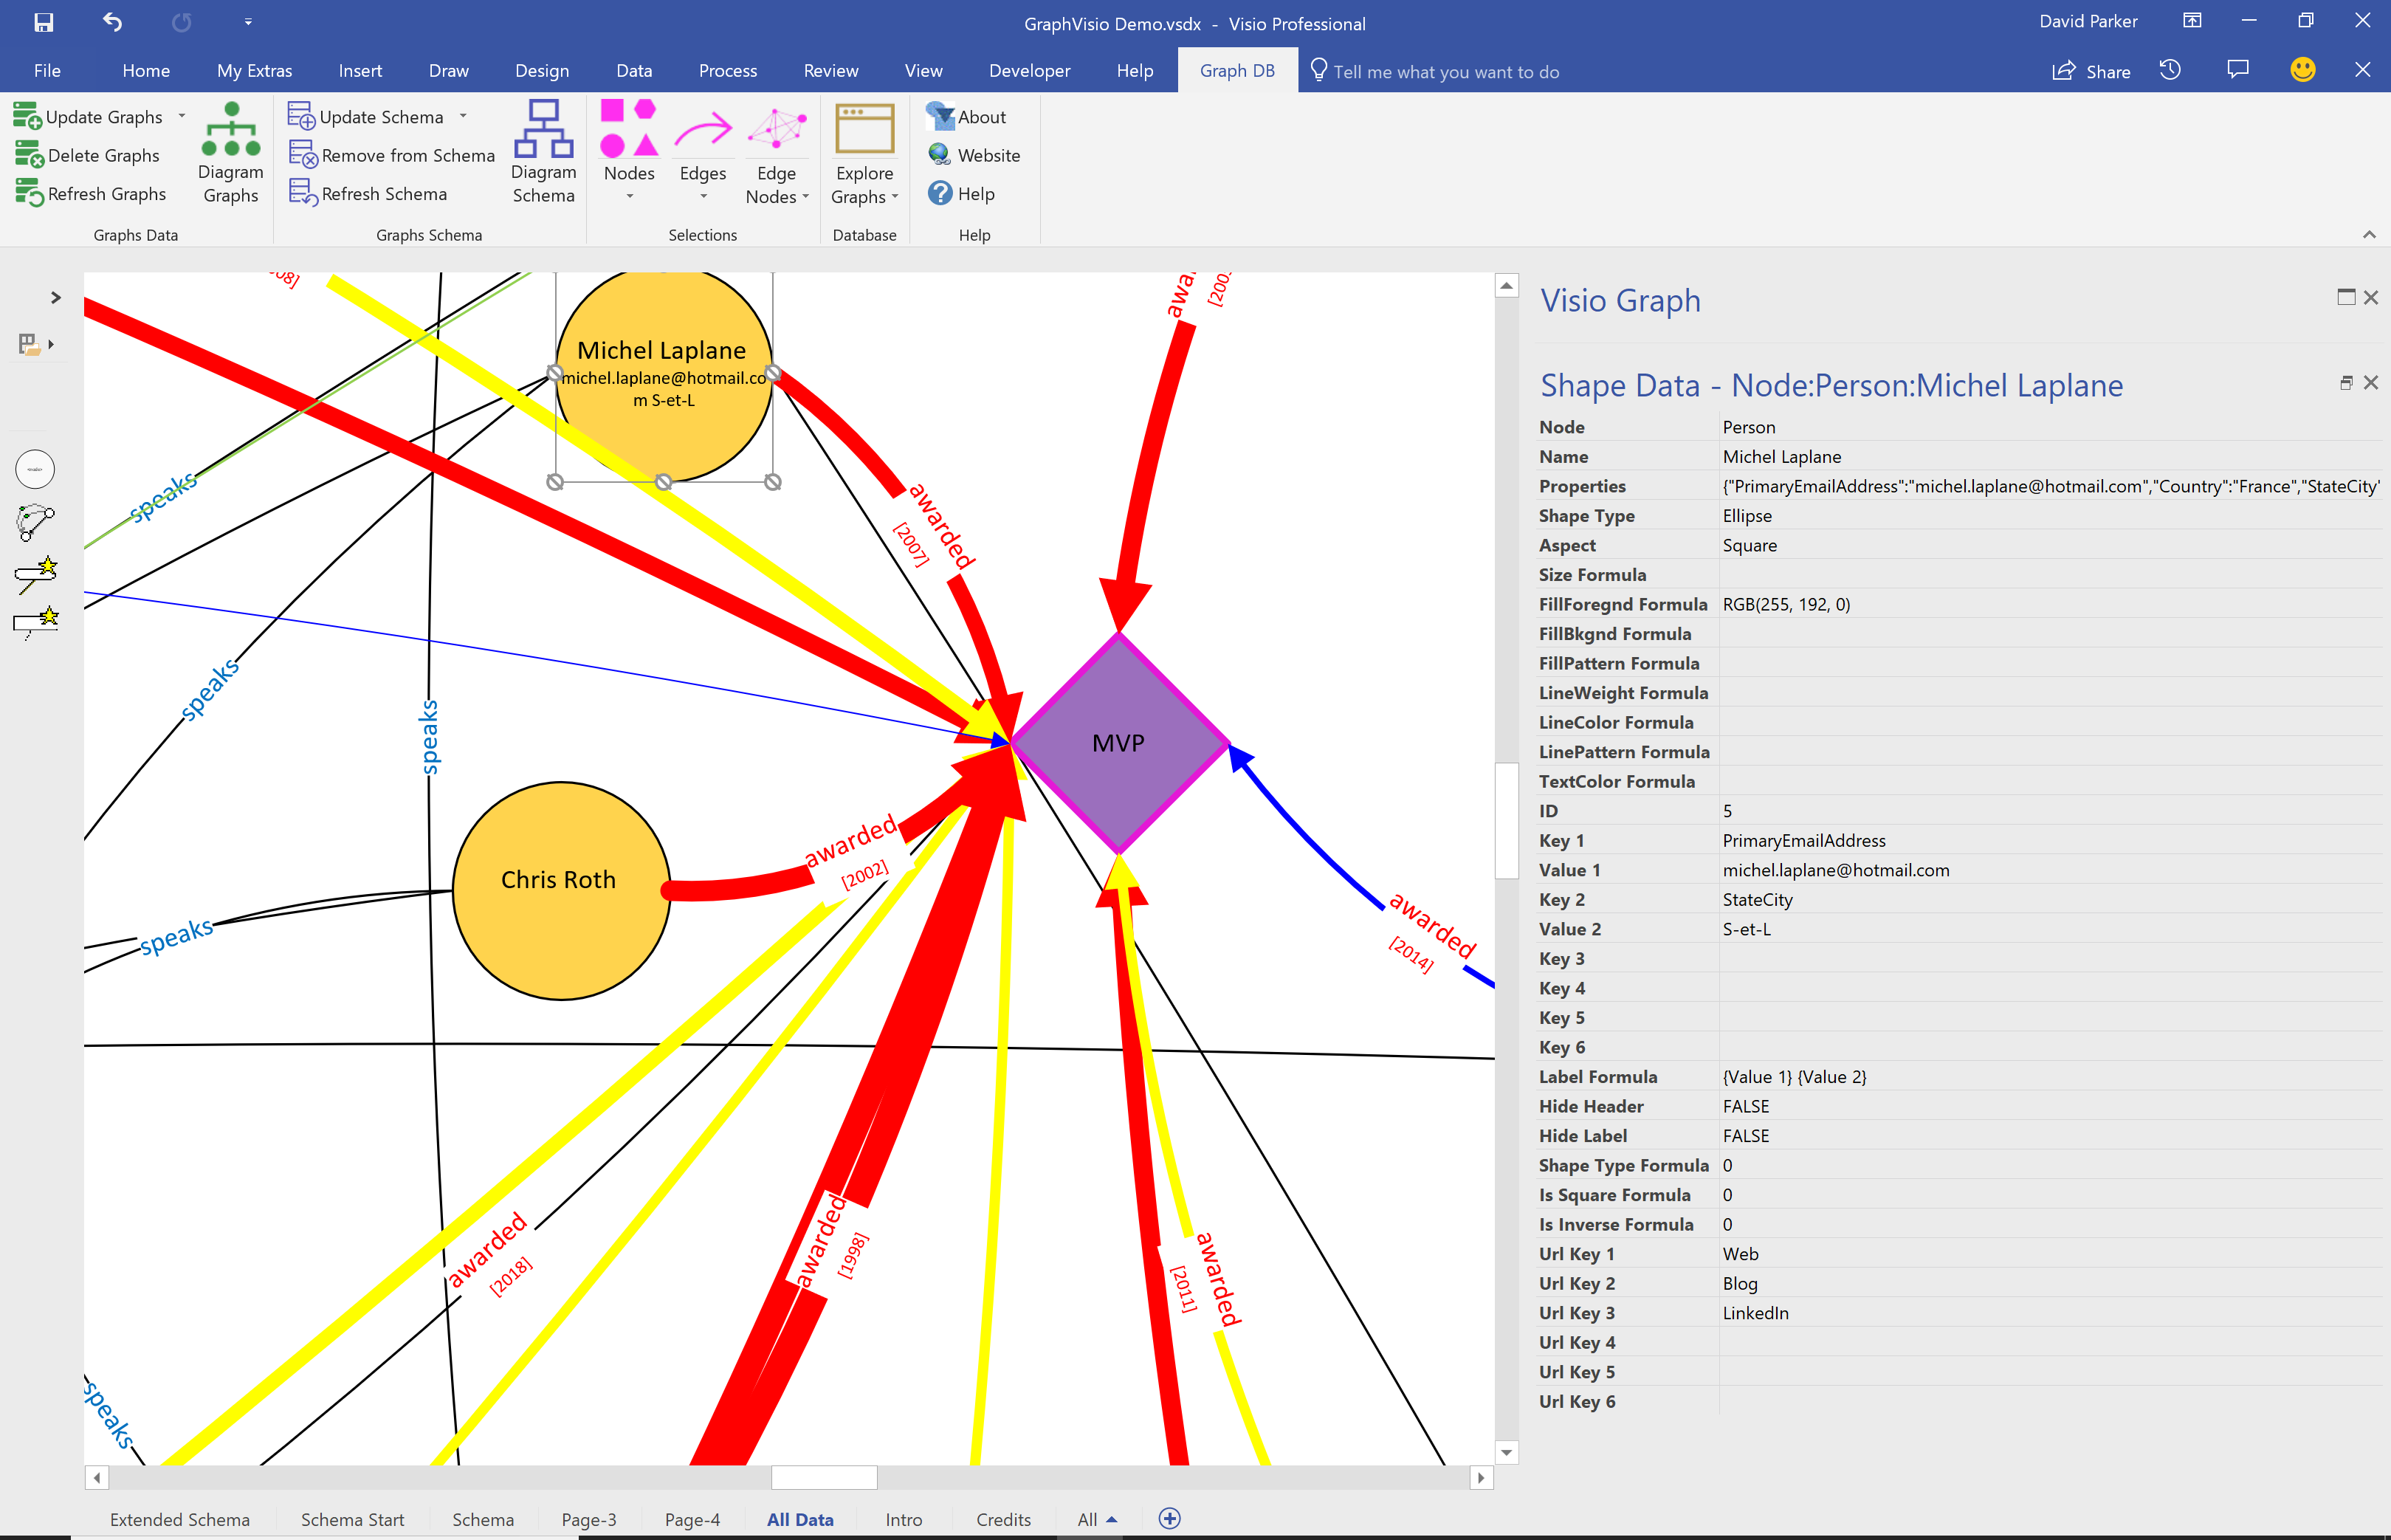
All Visio shapes can contain data, and are easily connected to each other, so creating meaningful relationships is a breeze. Visio diagrams can be automated too, and this solution is a C# VSTO add-in that enhances the normal Visio interface. The application also has the ability to define the shapes, labels, colours and appearance from the data values, which are stored as Json objects.
An import from Excel is also provided because of its tremendous ability to gather and re-shape data from so many different sources.
The solution automatically creates SQL views of each graph table so that the data can be linked to Visio and used in Power BI too.
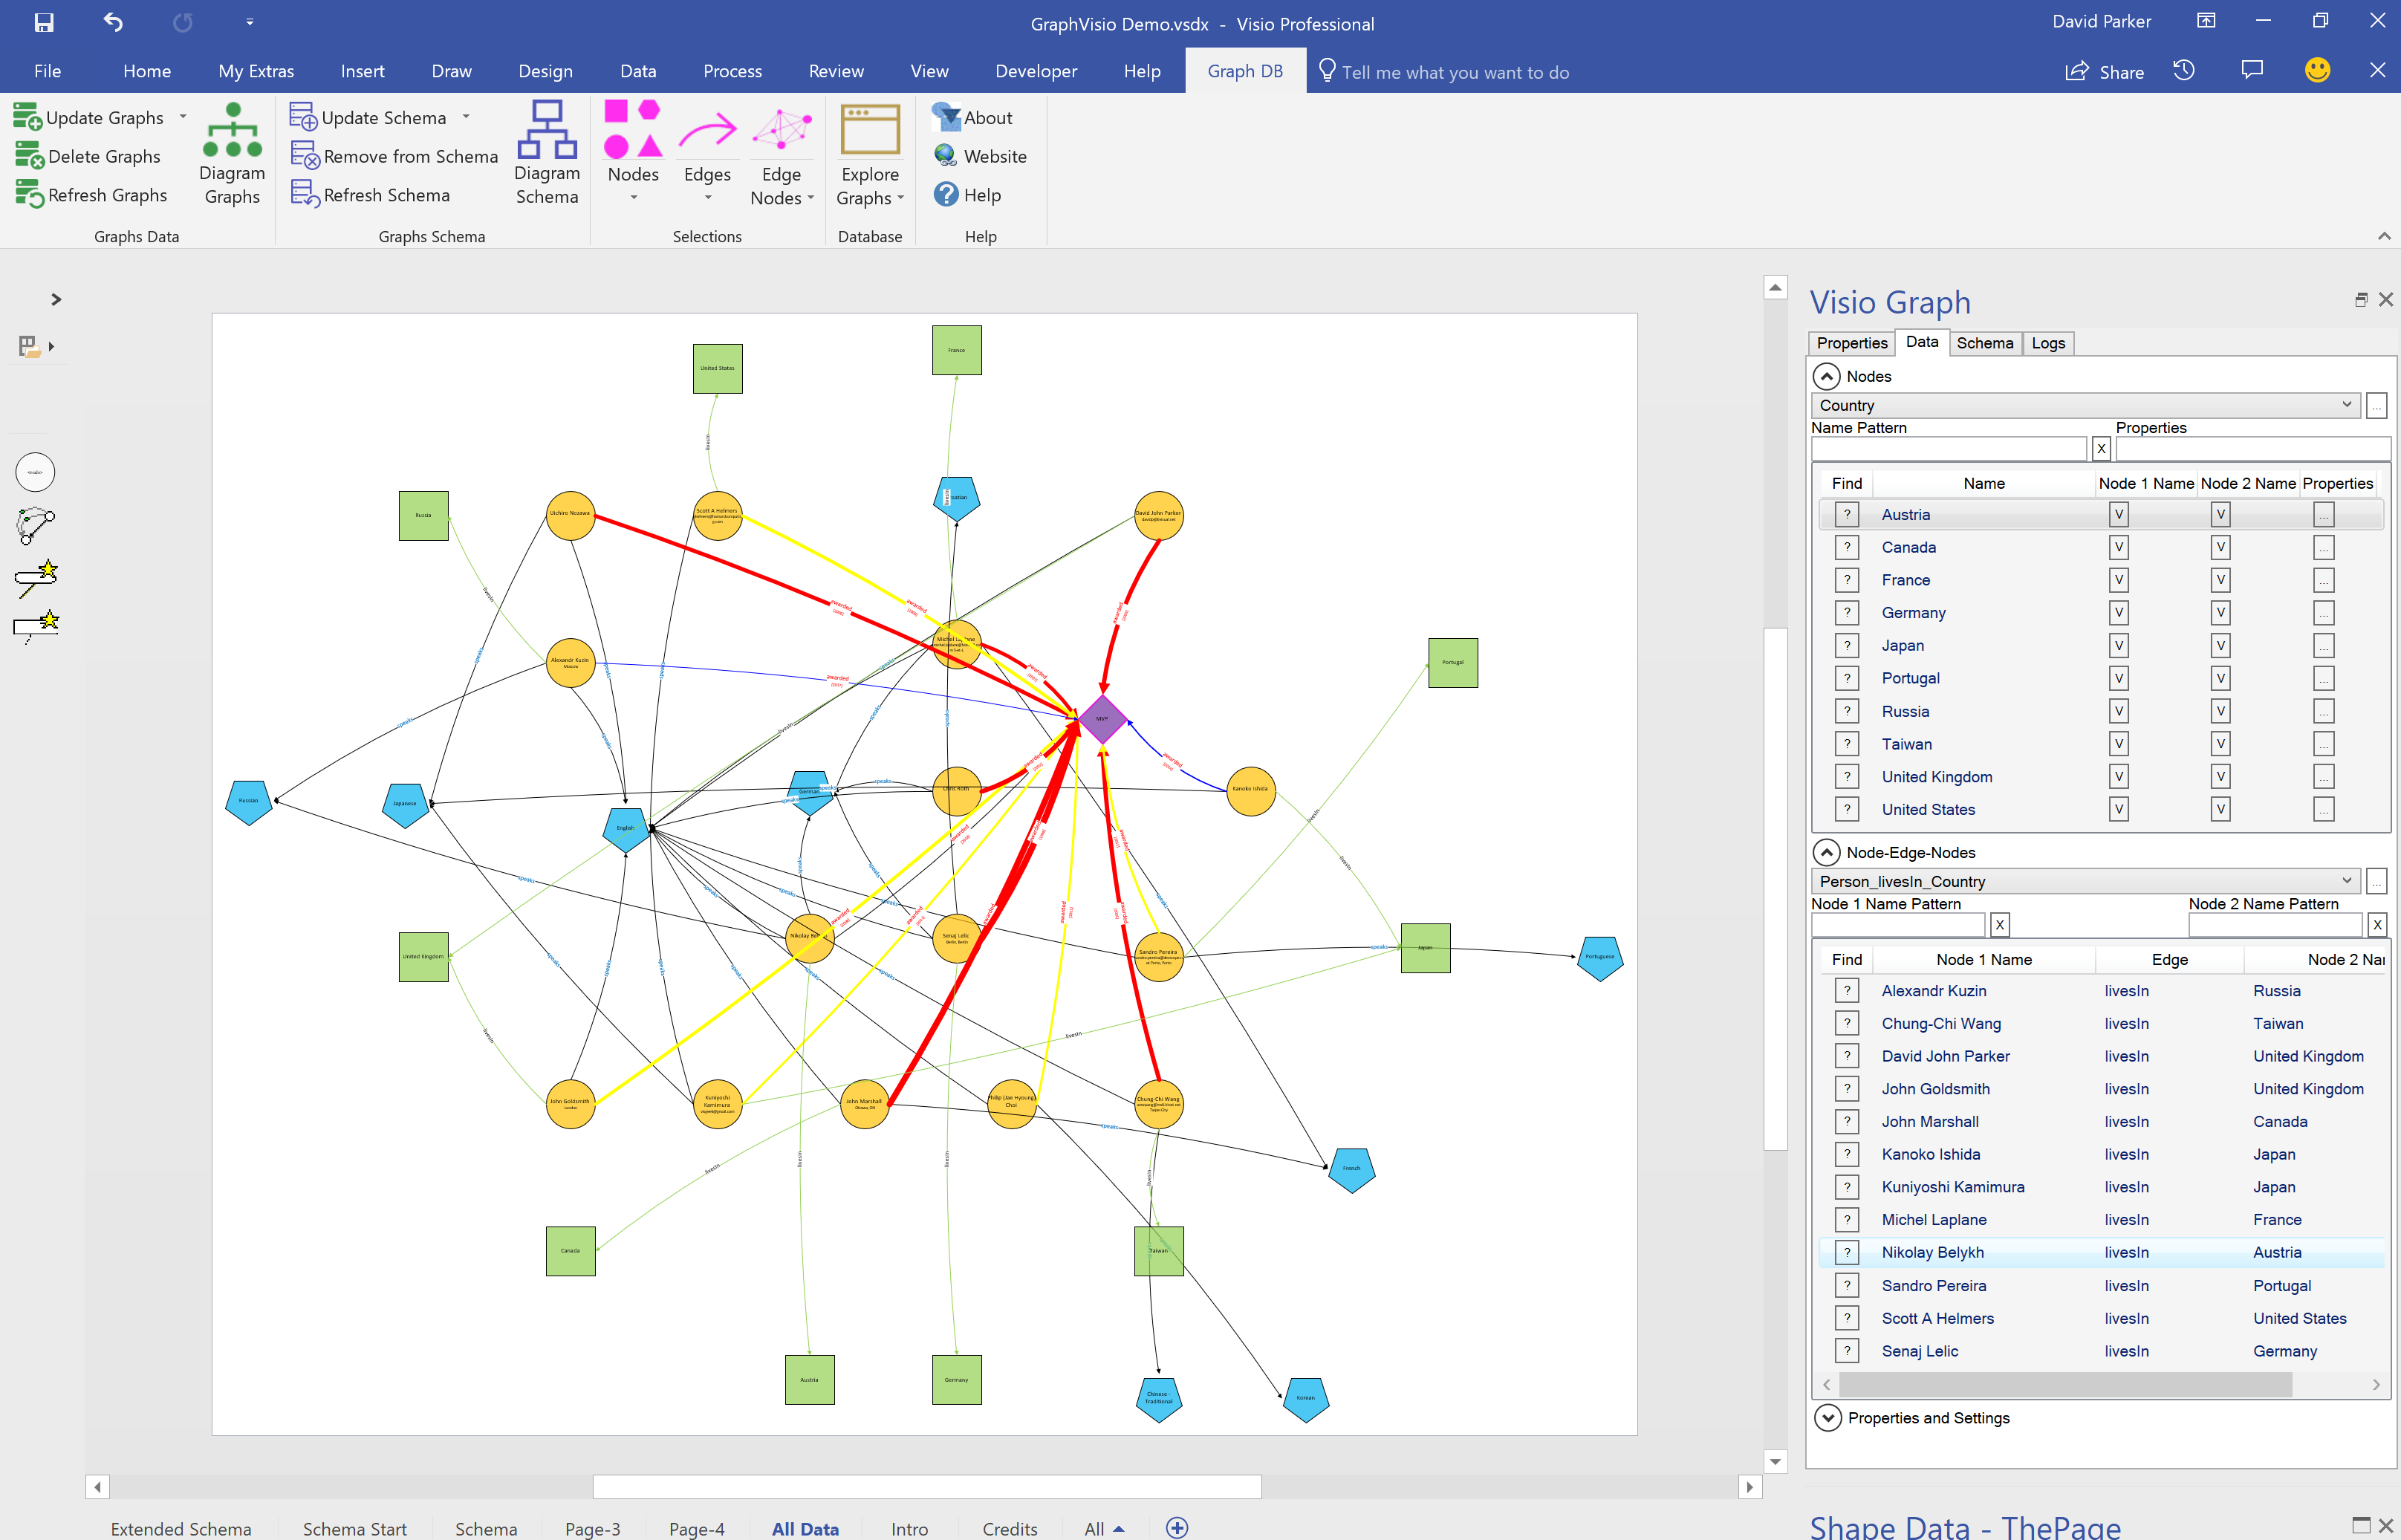
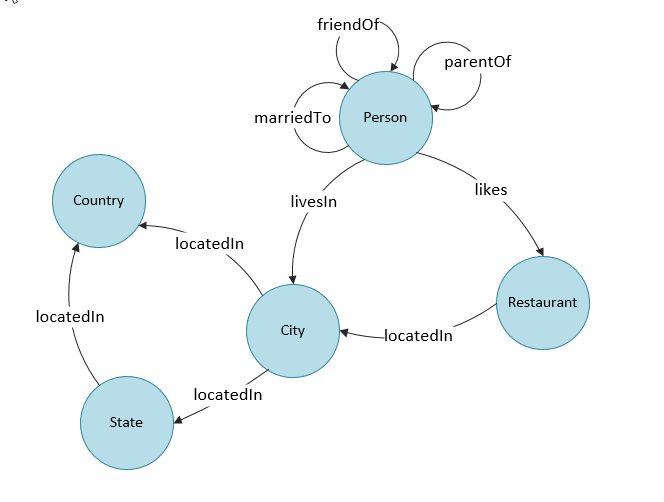
My goal is to provide any amount of properties to be defined for any node (noun) or edge (verb), and for their values to be able to define the graphic labels, sizes, colours, etc. I have created a short into video :
Watch a longer description below, or open at : Screencast
Related blogs
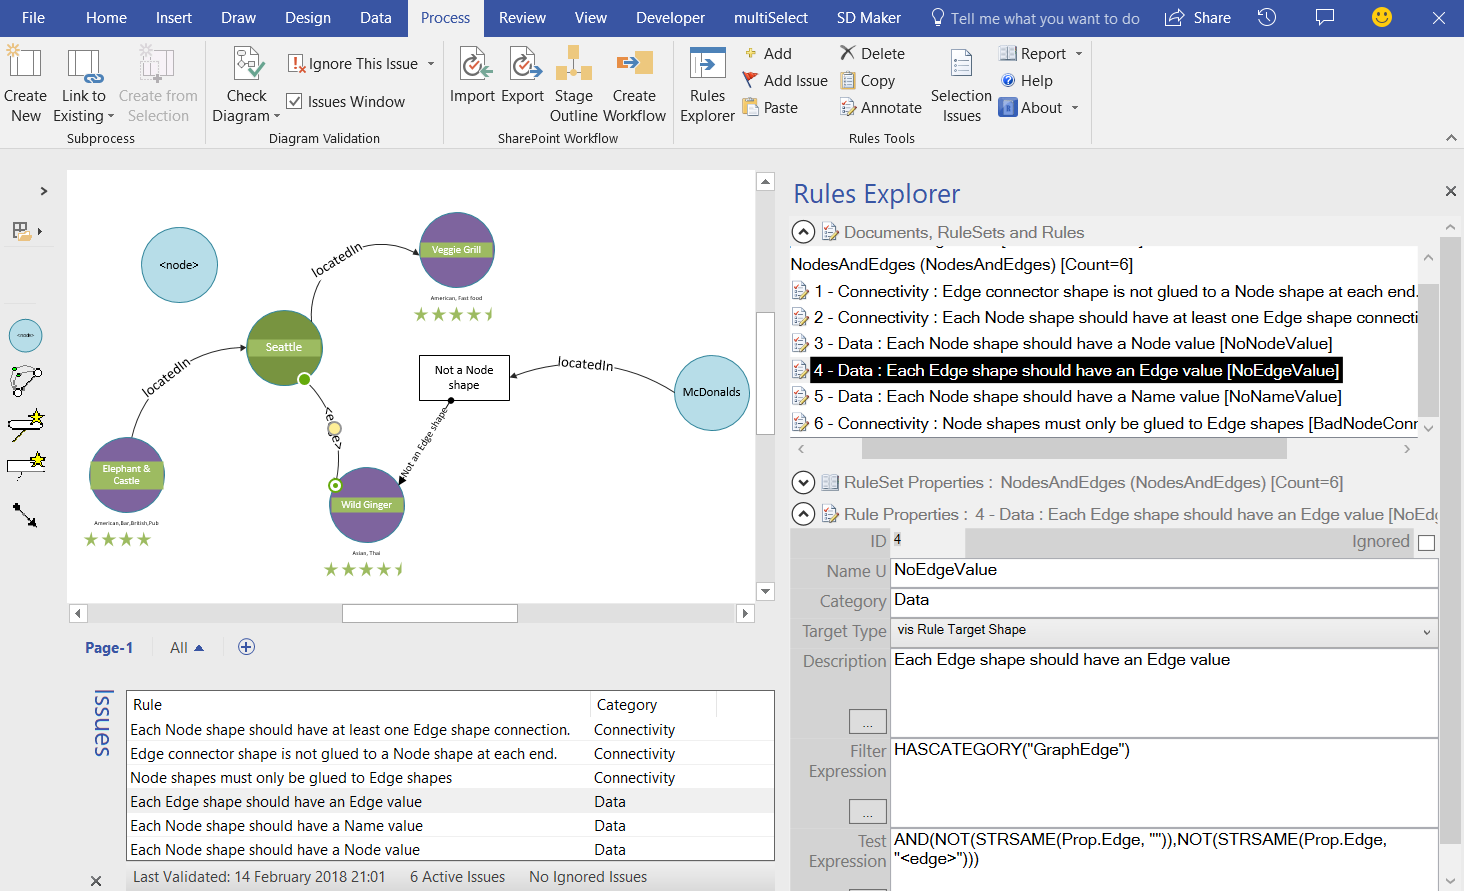
Creating Visio Validation Rules for Graph Database template
See how Visio Validation can be used in Visio to check integrity for SQL Server Graph DB
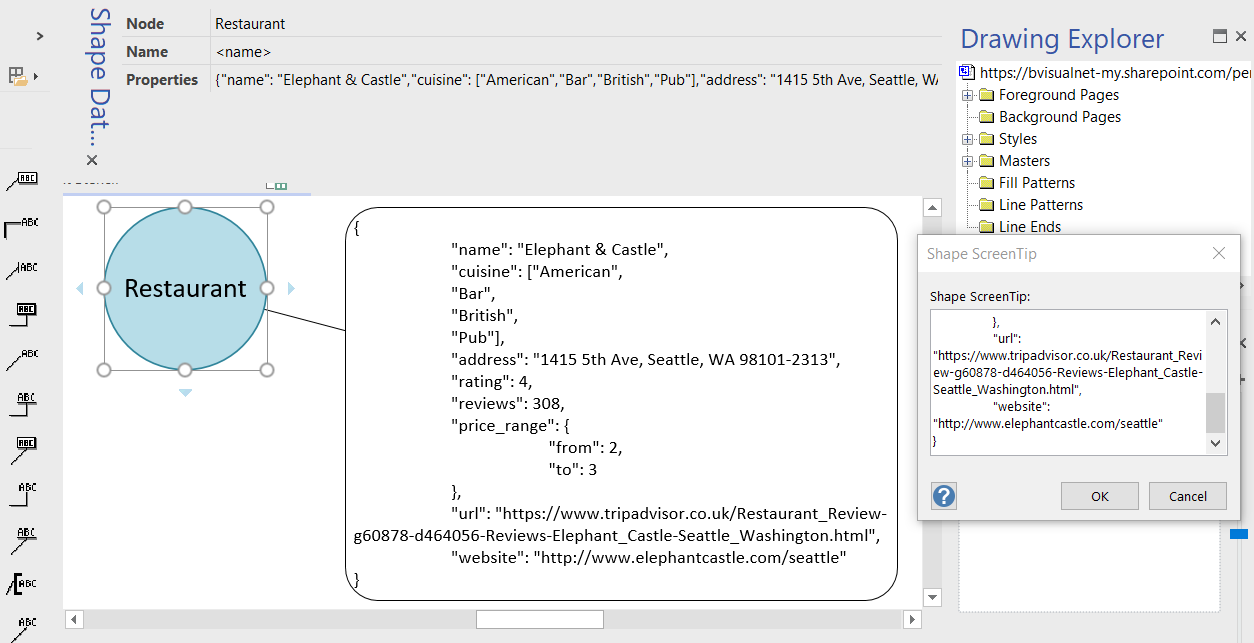
Using JSON text in Visio shapes
I often create Visio masters with a fixed number of Shape Data rows, and sometimes I get requests to modify them because of changes in business needs. Well, my previous posts about Graph Databases got me thinking if it would be possible to embed JSON text in Visio shapes in some sort of meaningful way.…
Using Visio and PowerBI with GraphDatabase in SQLServer – Part 2
In my last article, I described how Visio can be used to input Nodes & Edges into a SQL Server graph tables (see Using #Visio and #PowerBI with #GraphDatabase in #SQLServer). In this article, I show how PowerBI can be used to create an Excel table that can then be used to automatically create a…
Using Visio and PowerBI with GraphDatabase in SQLServer
I went to a very interesting inaugural meeting of the South East UK Power BI Group last week. Whilst the presentation by Dr. Subramani Paramasivam was impressive for its ambition, it was the presentation by Andrew Fryer of Microsoft that particularly intrigued me. He introduced us to the world of Graph Databases, such as Neo4J…
Awesome! You should be able to produce super powerful graphing business apps, using the data capacity of SQL and the programmability of Visio. In the NHS patients are on different drugs, have had contacts with many medics, have been in different wards etc and you could create a terrific interface to track a patient’s progress- all without getting the poor nurses to enter more data, and it could be self-service data for the clinical staff. Can you have filtering and maybe layers?
ok, this is brilliant! No other words necessary. Well done.