I will be venturing to the dark side of the moon on Saturday 12th September 2015 at SQL Saturday in Cambridge, UK ( see http://www.sqlsaturday.com/411/EventHome.aspx ).

I will be venturing to the dark side of the moon on Saturday 12th September 2015 at SQL Saturday in Cambridge, UK ( see http://www.sqlsaturday.com/411/EventHome.aspx ).
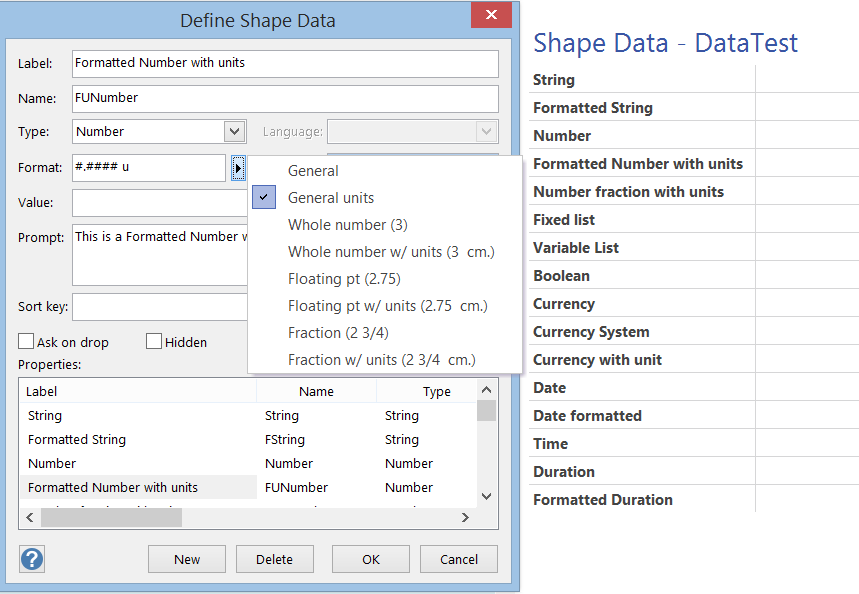
One of the best aspects of Visio is the ability of shapes to hold data, and the easiest way to do this is to define rows of Shape Data. Each row can be defined as holding one of eight different types, and most of these can have their values formatted for display. In this article I discuss the formatting of these values, using either ShapeSheet functions or automation methods. The driver for this is my on-going frustration with the Microsoft provided standard Shape Data window because of its shortcomings … for example, its lack of multi-line support even though it can hold 64k characters in each row, and its lack of a time control, even though it can store dates and time.
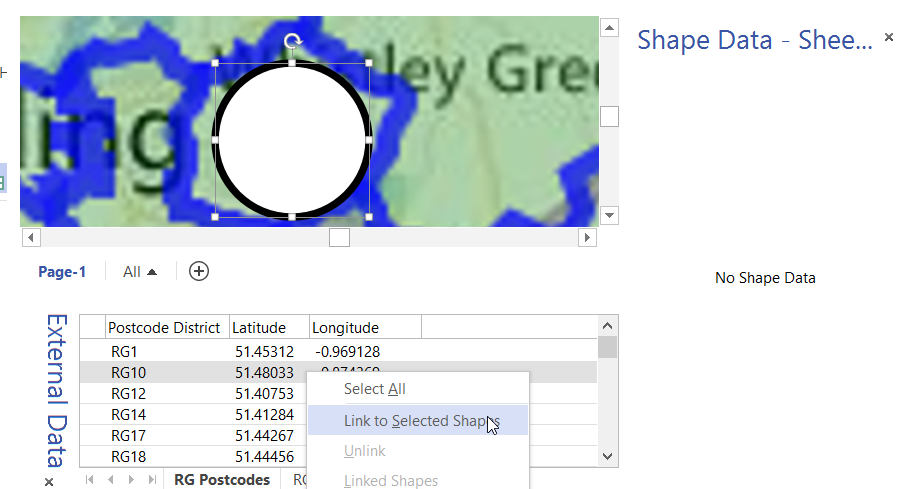
In my last article, I described how to calibrate a map in Visio ( see http://blog.bvisual.net/2015/05/26/calibrating-a-map-in-visio/ ), and in this article I use a calibrated map to distribute data points from a linked data source automatically.
For this example, I drew a simple shape at the size that I want, but you could add this smartness to any shape. All you need is an external data recordset that contains the Latitude and Longitude values that need to be linked to each data point.
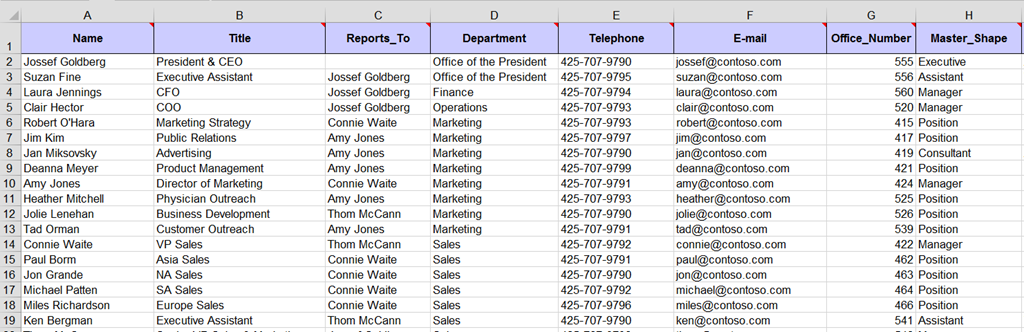
I had an enquiry recently about displaying Organisation Charts with text in different languages. This set me thinking, and, if you have Visio Professional, then you can use Link Data to Shapes to add this capability to existing diagrams, but Visio Standard users can just the Org Chart Wizard.
I will use the OrgData.xls file that is provided in the <Program Files>\Microsoft Office\Office 15\Visio Content\<LCID>\ folder to demonstrate this. I have English US (1033) and Norwegian Bokmal (1044) available to me, as shown below:
In Englsih
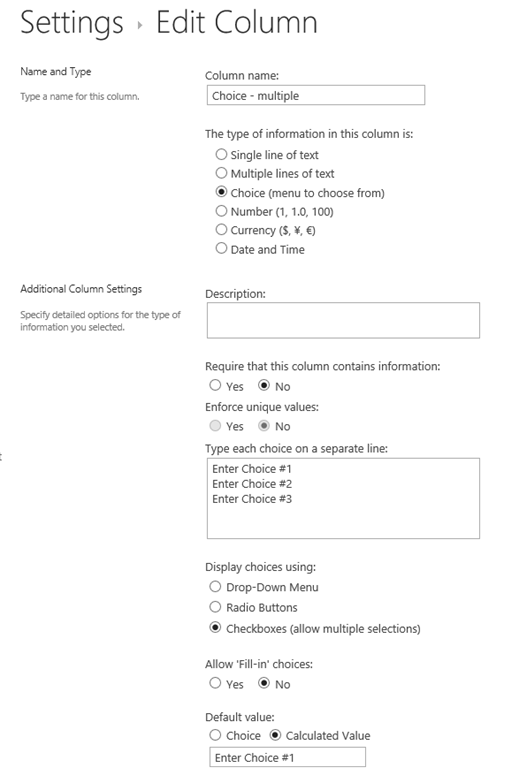
Back in March 2014, I wrote about mapping SharePoint Column Types to Visio Shape Data Types ( see http://blog.bvisual.net/2014/03/03/mapping-sharepoint-list-columns-to-visio-shape-data-types/ ), and I skipped over the remaining SharePoint column types that could not be directly mapped. I described Rich Text previously ( see http://blog.bvisual.net/2014/11/14/using-sharepoint-rich-text-multiple-line-columns-with-visio-services/ ), and in this article I describe some of the possibilities of using the SharePoint Choice column type.
There are three different options for Choice columns in SharePoint 2013, but only the third, Checkboxes, allows for multiple selections.
In August, I wrote about Using JavaScript to Display Visio Shape Data and Hyperlinks in SharePoint Content Editor ( see http://blog.bvisual.net/2014/08/16/using-javascript-to-display-visio-shape-data-and-hyperlinks-in-sharepoint-content-editor/ ), so now I have added the ability to select shapes by a property value. The main advantage of using JavaScript in the client is that there is no need to go back to the server to refresh the page.
In the following screenshot, I have used the standard web part connections between the BeSmart Ltd document library view and the Visio Web Access control in order to set the Drawing URL.
