I recently wrote a series of articles about some of the new capabilities of the Visio desktop and web app.
Using the Visio Data Visualizer in Excel
Creating Visio Tabs and Apps for Teams with SharePoint Framework (SPFx)
Published on by David Parker
I recently wrote a series of articles about some of the new capabilities of the Visio desktop and web app.
Using the Visio Data Visualizer in Excel
Creating Visio Tabs and Apps for Teams with SharePoint Framework (SPFx)
Published on by David Parker

Microsoft Ignite 2019 at the huge Orange County Conference Conference Center in Orlando is over for another year. 30,000 attendees over 6 days, and I have seen my first sunlight today since I arrived in Florida last Saturday! So, it is time to review just what was announced about Visio, and how much Visio is appreciated.
Published on by David Parker

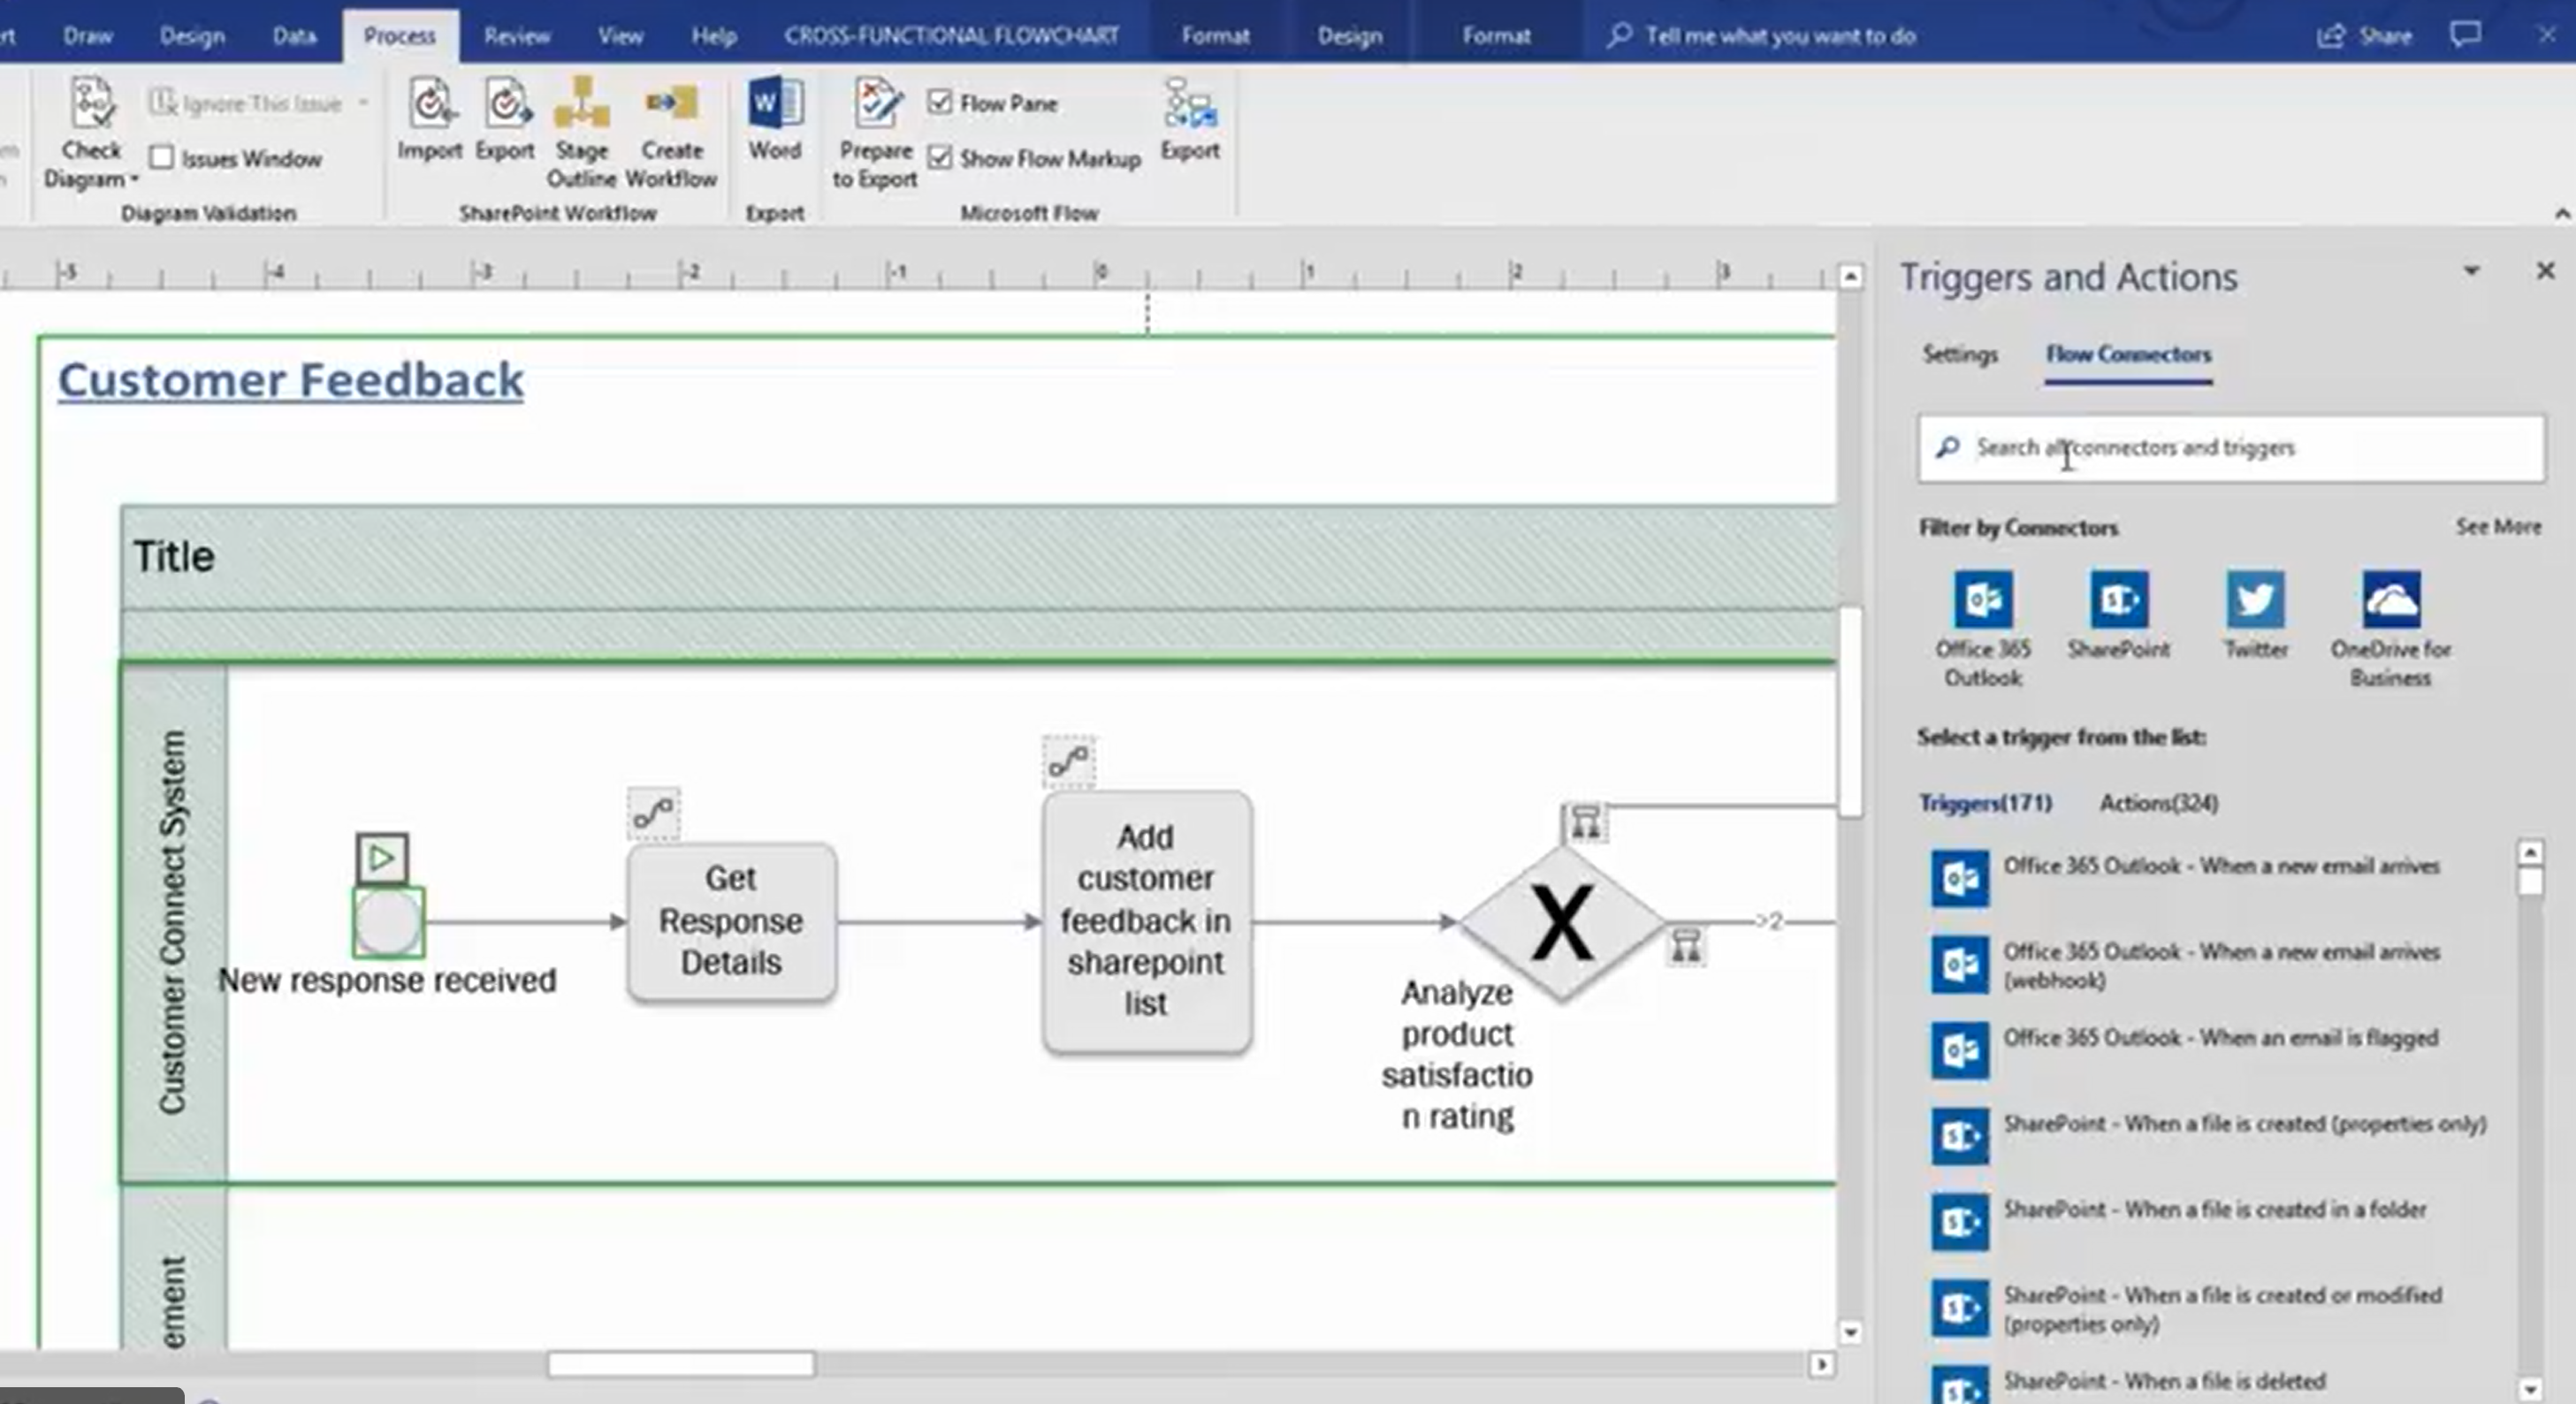
It will take me some time to review the content coming out at MSIgnite, but there is a re-occurring theme with the seemingly omni-presence of the Power Platform in all the user-facing applications that contain data. The Power Platform is PowerApps, Microsoft Flow, and Power BI ( view a session about this ) built on top of Azure. They work together, or separately, and they add an incredible amount of flexibility and democracy to applications. In the case of Visio, there is a tantalising view of what is coming shortly! Check out this video.
Published on by David Parker

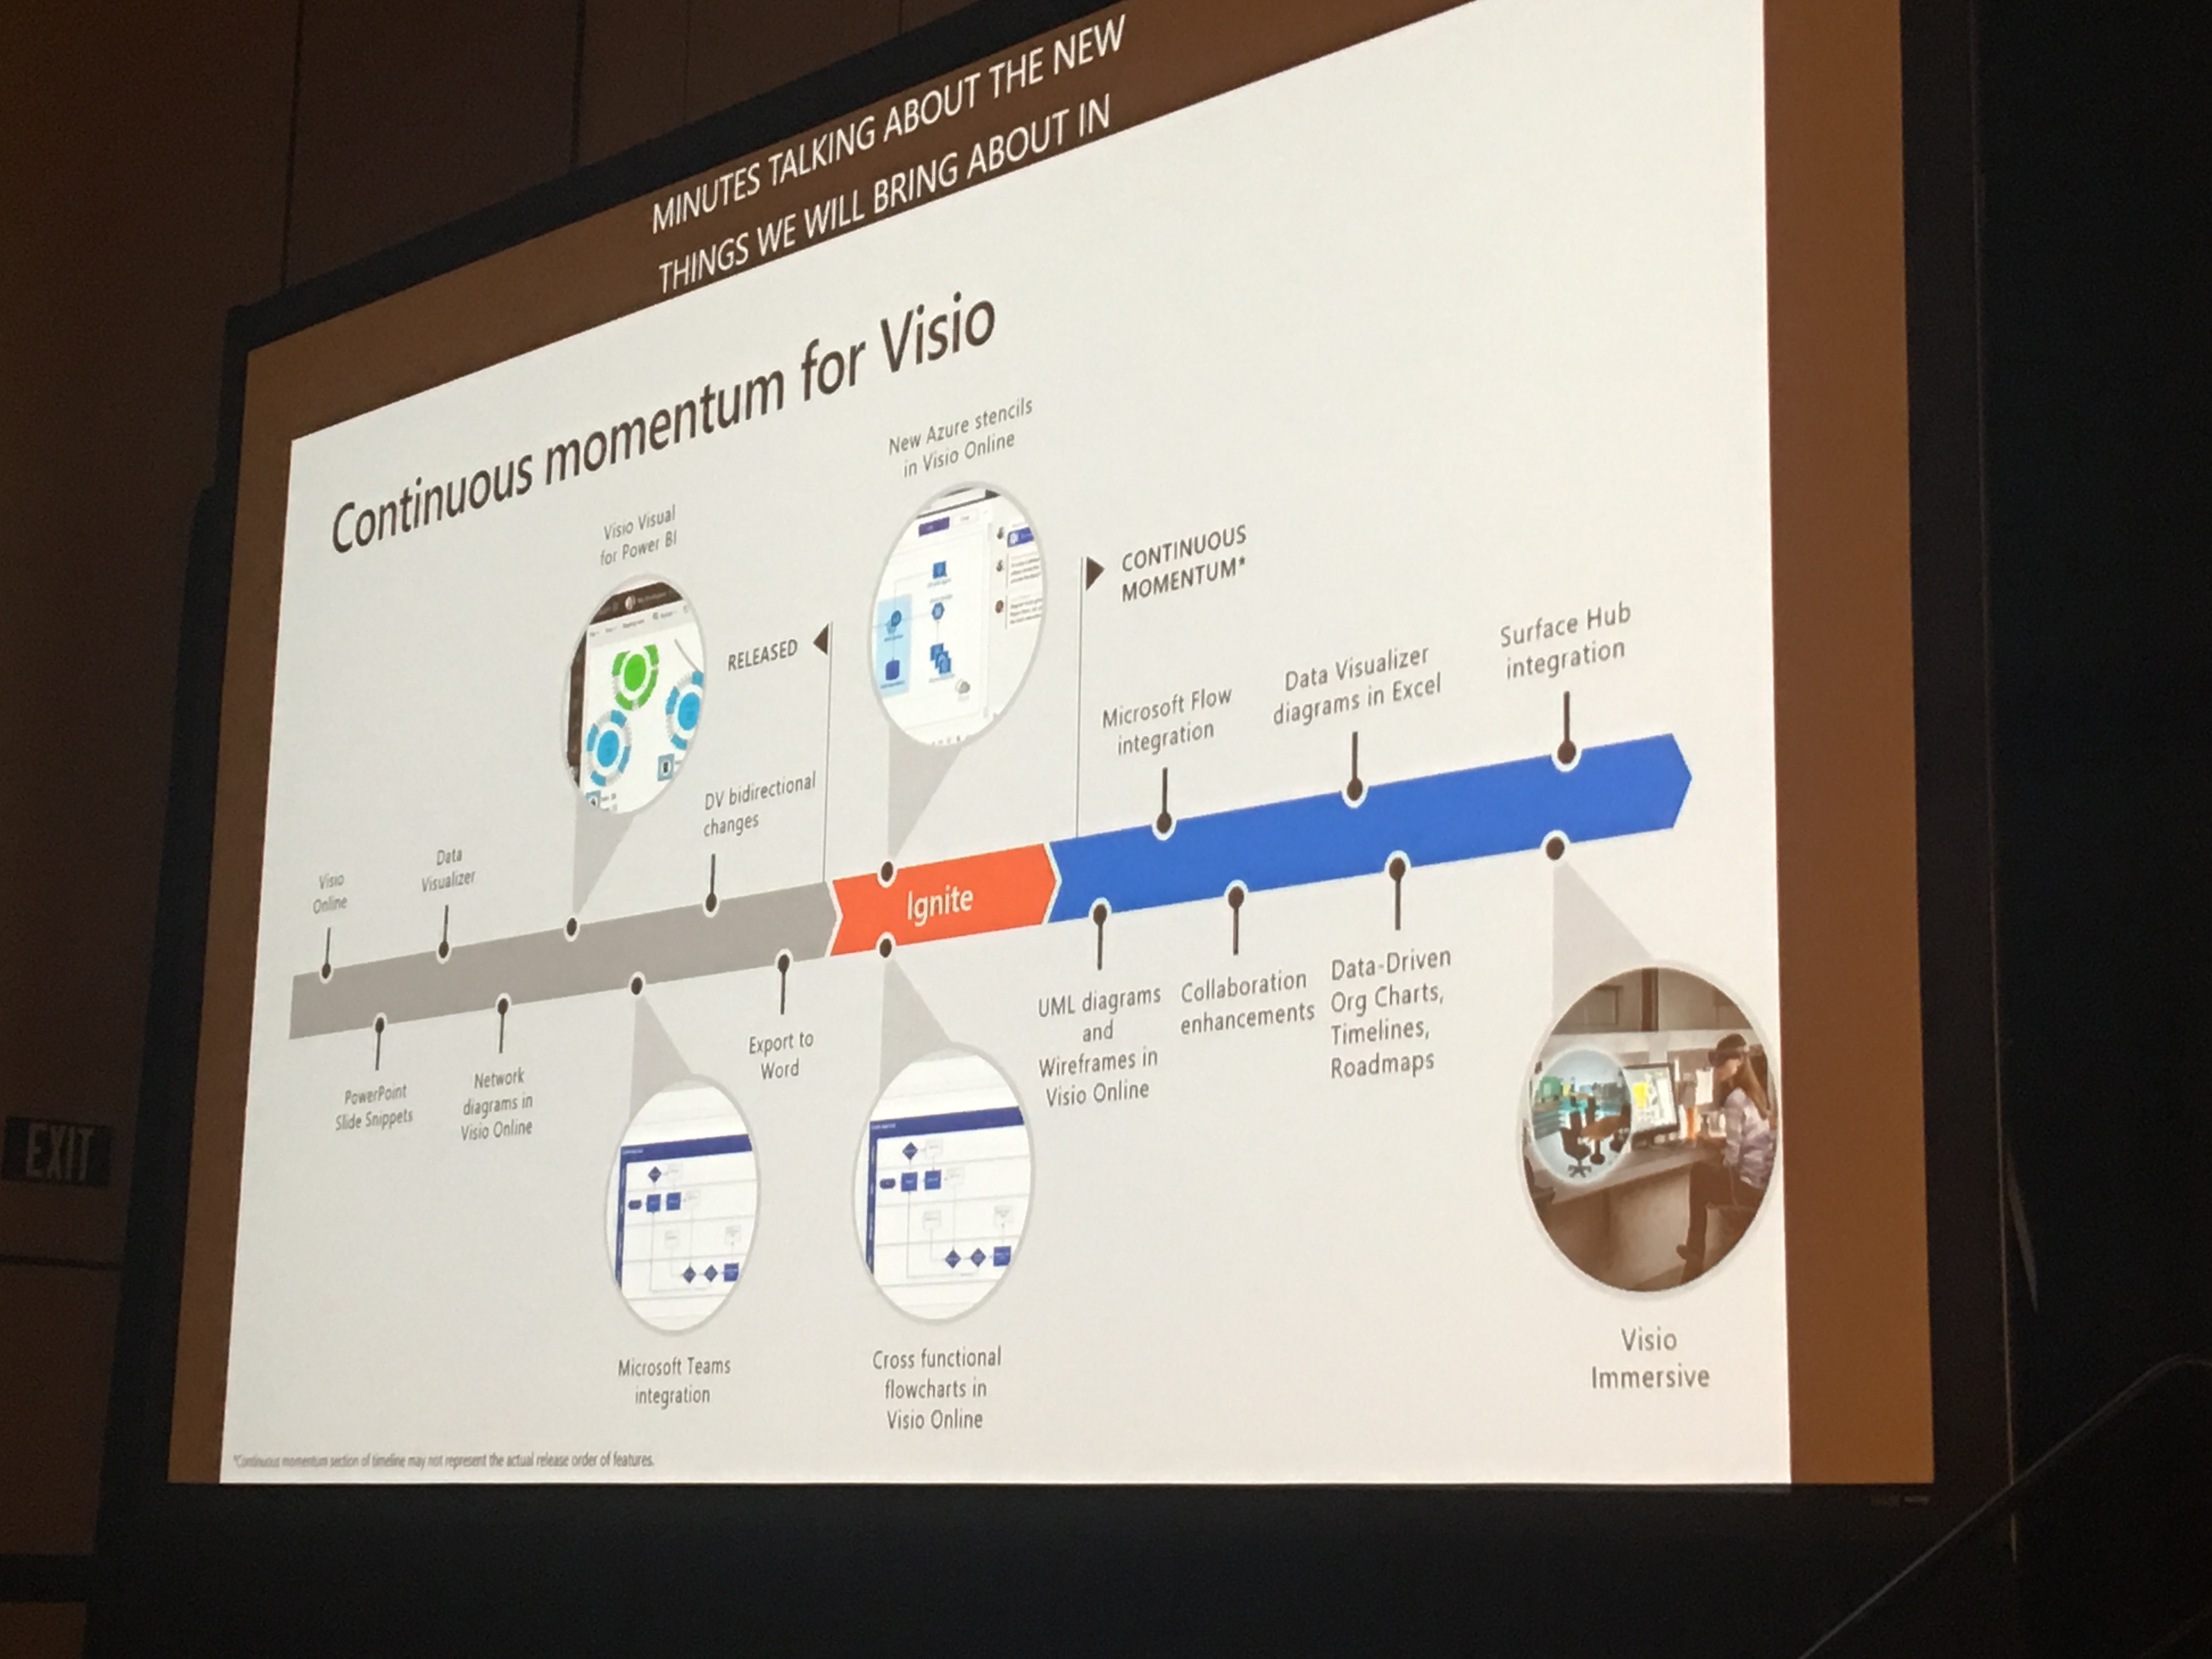
The first slot of the day at the furthest away room from the main conference area is not the ideal time to present anything, but those attendees that made it saw how many new features have been added to Visio recently, and what is soon to be added. The session recording should be available soon, but for those who can’t wait, here is a spoiler! ( View the session here )
Published on by David Parker
Only a couple of days to go before Microsoft Ignite conference starts here in Orlando. Yes, I am here a week early to “acclimatize” 🙂 , but I have not been idle since I will be presenting in three sessions!
[Read more…] about Countdown to MSIgnite for Visio sessionsPublished on by David Parker
Office 365 is a truly remarkable success story, but it is often difficult to understand what each of the parts actually do, or what it is actually in each edition. Microsoft are always adding applications and services to the various editions, or retiring ones that have been superseded. If I can’t see it, I can’t understand it, so I was very interested to see the Periodic Table of Office 365 infographic created by Matt Wade, a SharePoint guru who keeps an eye on these changes ( see http://icsh.pt/O365Table ). It really helps in comprehending the current Office 365 applications and their purpose. Indeed, I have seen his graphic go through many iterations over the last few months, and it will continue to change. However, it was not clickable, and I am a visual data guy, so I contacted him, and offered to integrate his infographic into a Power BI now that the Visio custom visual is available. I then found out that there are several different language versions of his infographic out there on the web, translated by other SharePoint professionals in his network.
[Read more…] about Adding clicks to infographics with Visio visual for PowerBIThe UK-based independent Visio consultancy with a worldwide reach. We have over 25 years experience of providing data visualization solutions to companies around the globe.