Only a couple of days to go before Microsoft Ignite conference starts here in Orlando. Yes, I am here a week early to “acclimatize” 🙂 , but I have not been idle since I will be presenting in three sessions!
[Read more…] about Countdown to MSIgnite for Visio sessionsExcel
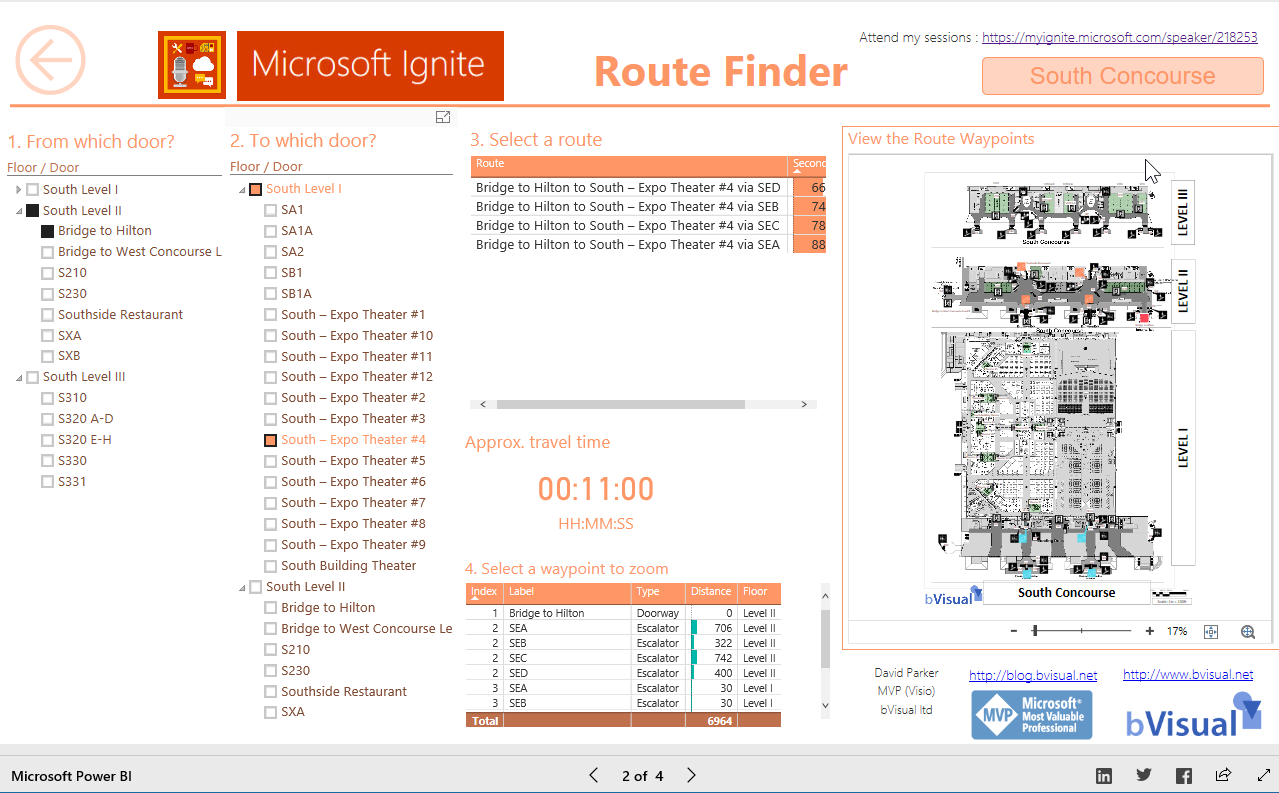
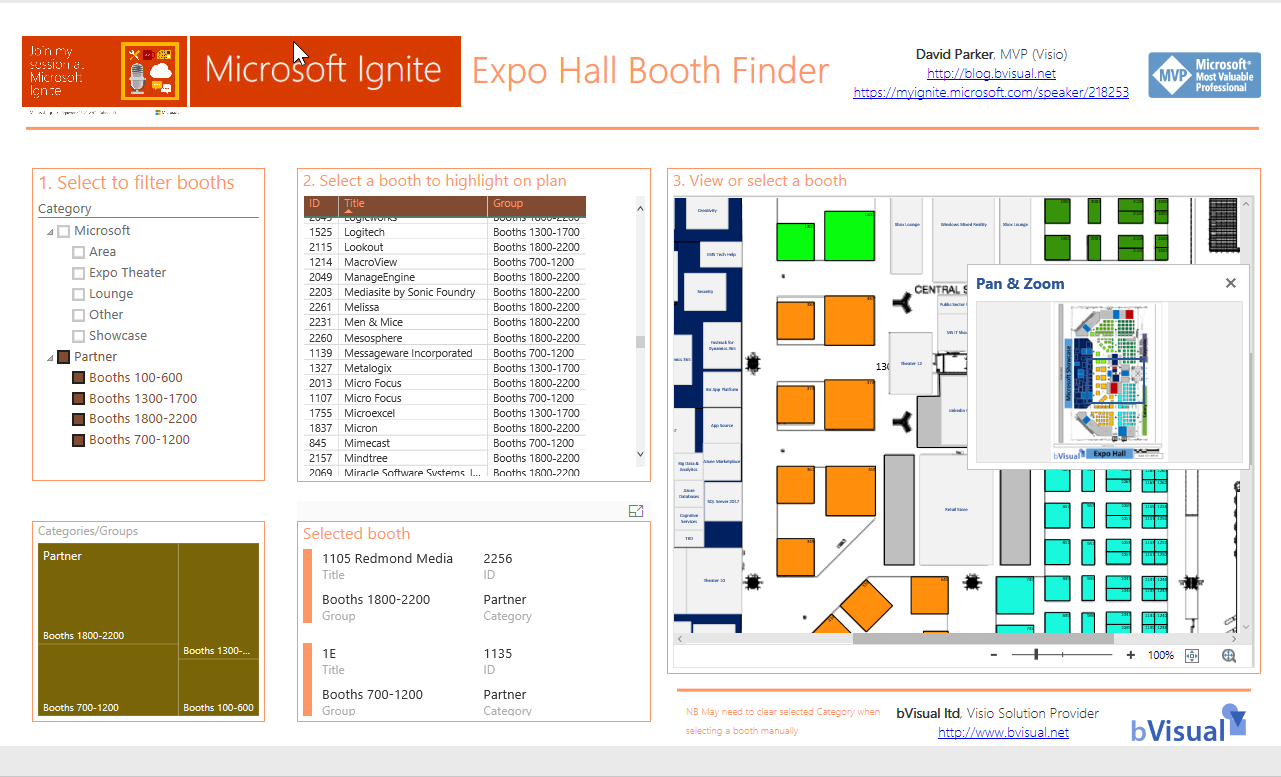
Previewing the Visio Custom Visual in PowerBI
It is time to talk about the new Visio custom visual for PowerBI. You may have read about it at Visio Power BI example and Add Visio visualizations to Power BI reports, but I wanted to add my findings. First, it is great to see this feature, but it is not yet the finished article. However, I hope I can show that it can be an extremely useful addition to the business intelligence toolset from Microsoft. I think that the existing Link Data to Shapes and Data Graphics features in Visio desktop are considered to be Operational Intelligence capabilities, whereas this new custom visual for PowerBI is definitely Business Intelligence. This is a different discipline, and I have been developing some guidelines for good practice when using Visio with PowerBI. In this article, I will demonstrate how I created a PowerBI dashboard using graphics and data from last years Microsoft Ignite conference.
Let me set the expectations because I am working with a preview of the Visio custom visual.
[Read more…] about Previewing the Visio Custom Visual in PowerBIData Visualizer for Visio Pro for Office 365 – Part 2
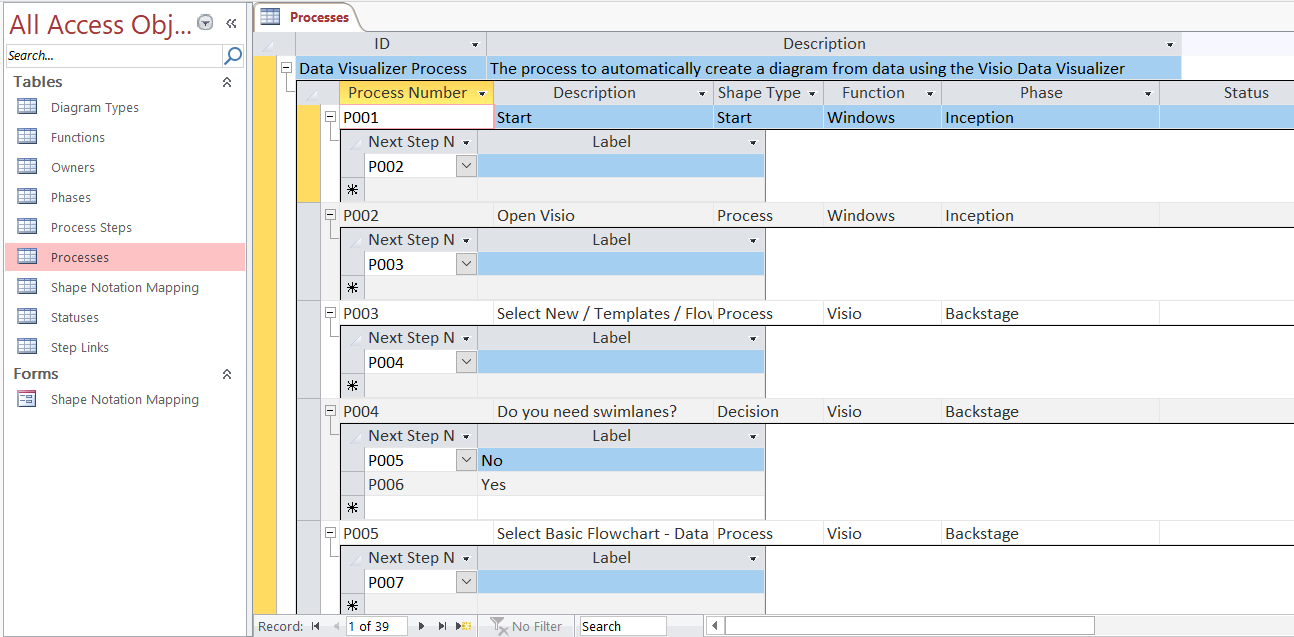
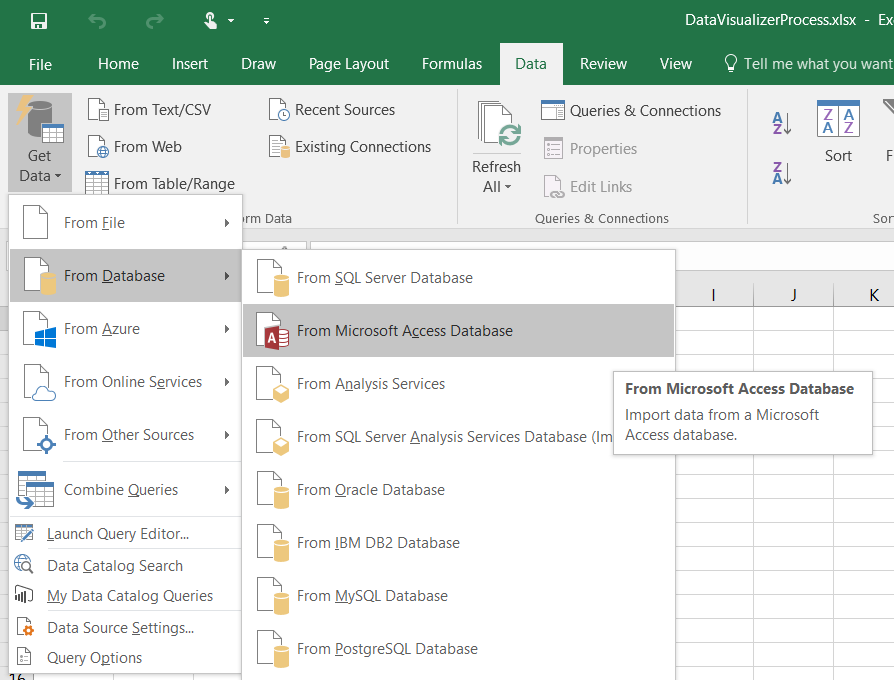
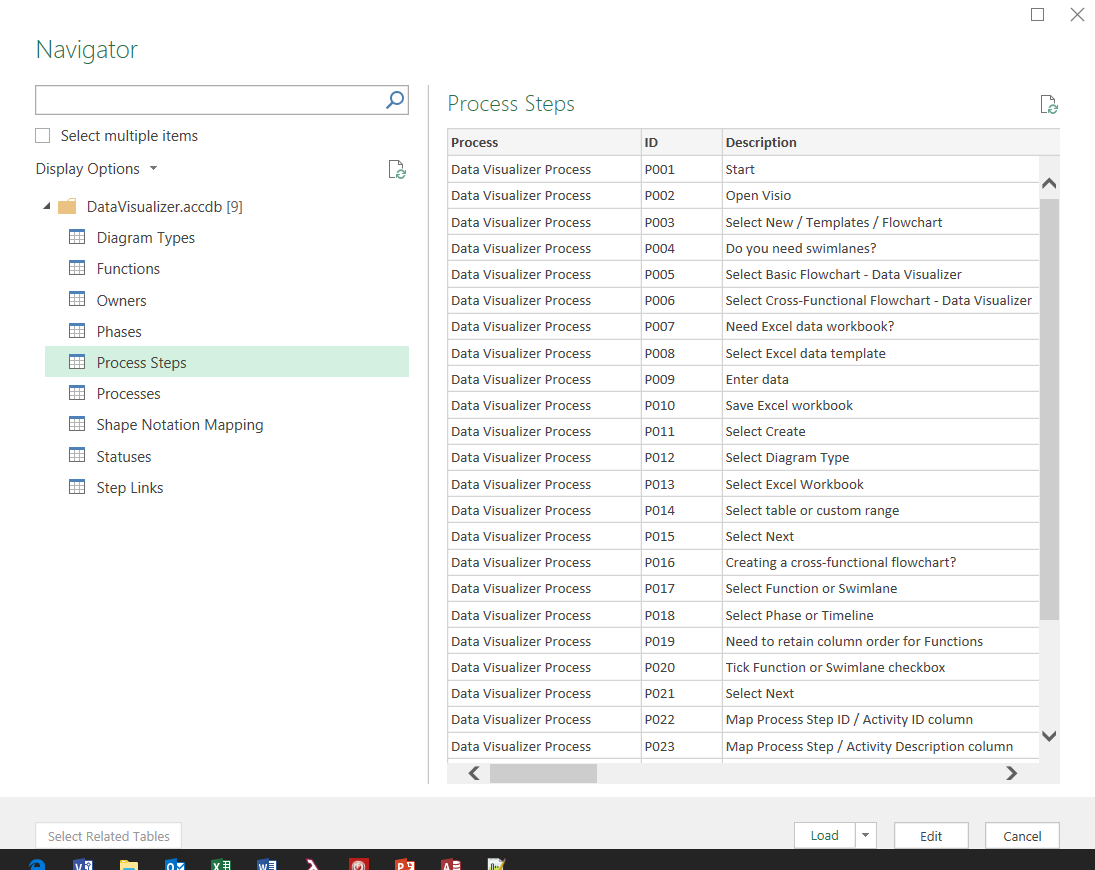
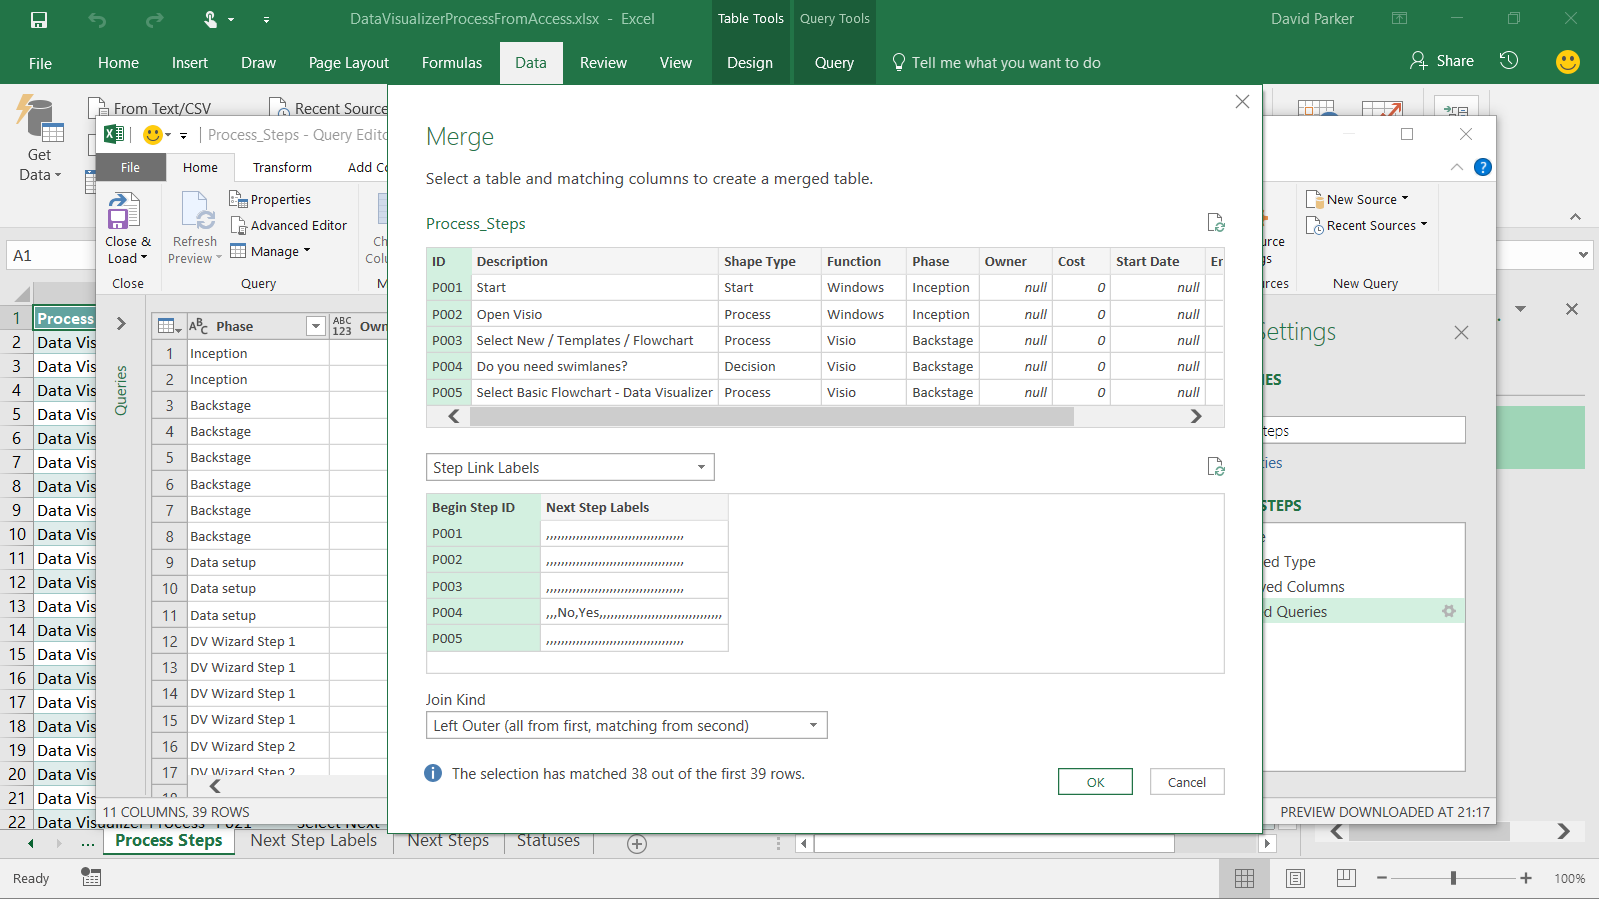
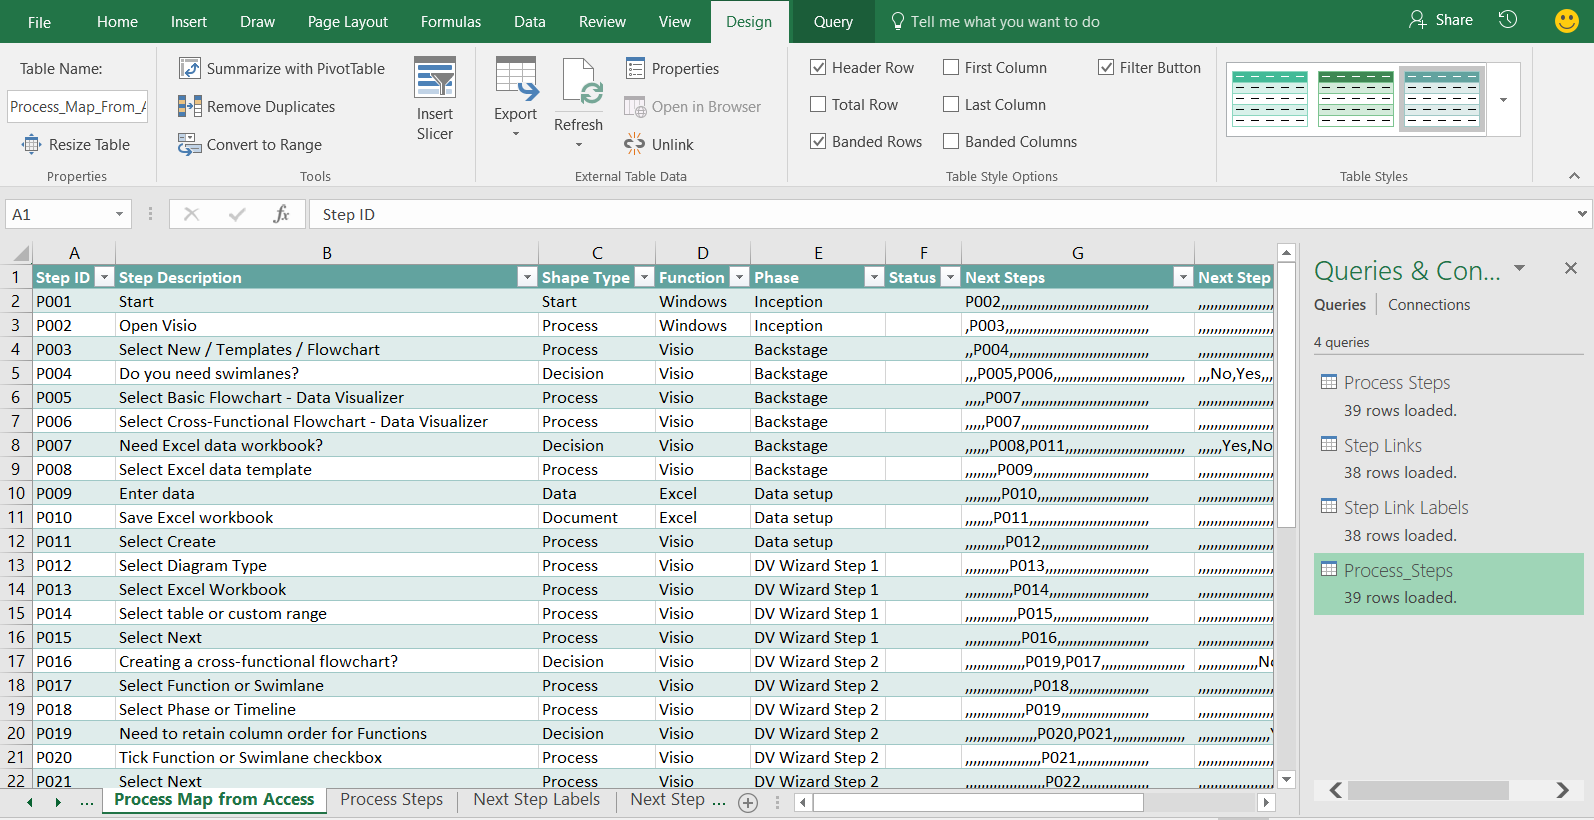
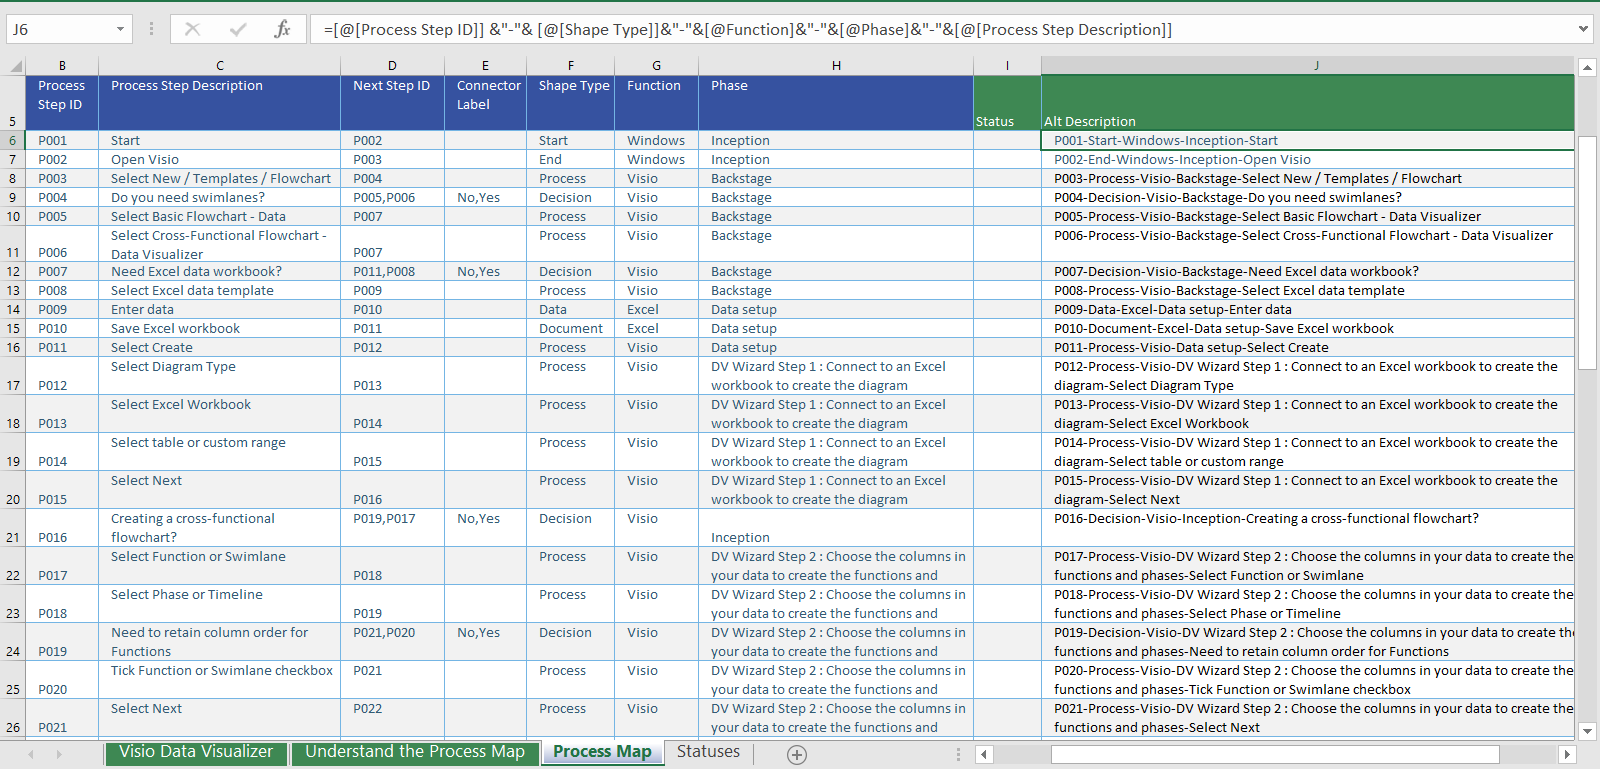
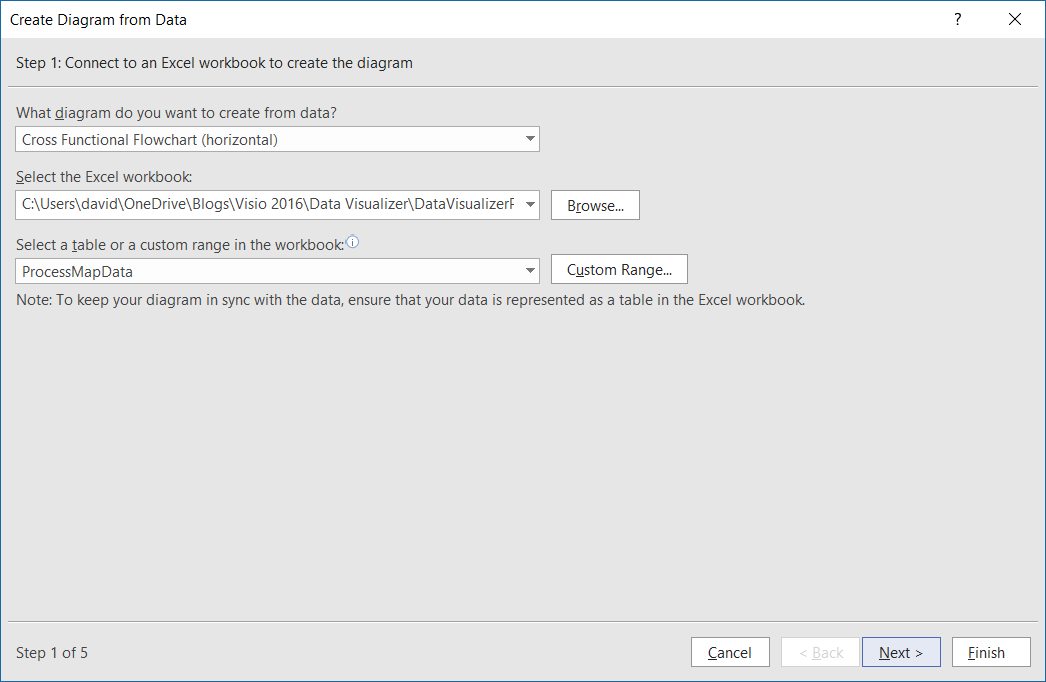
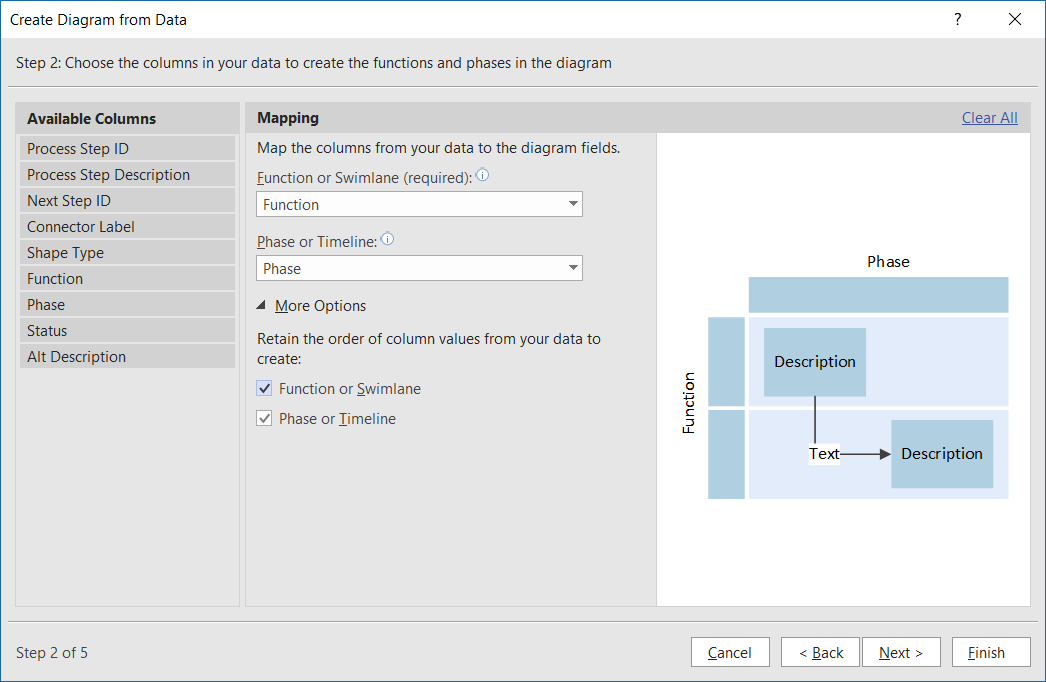
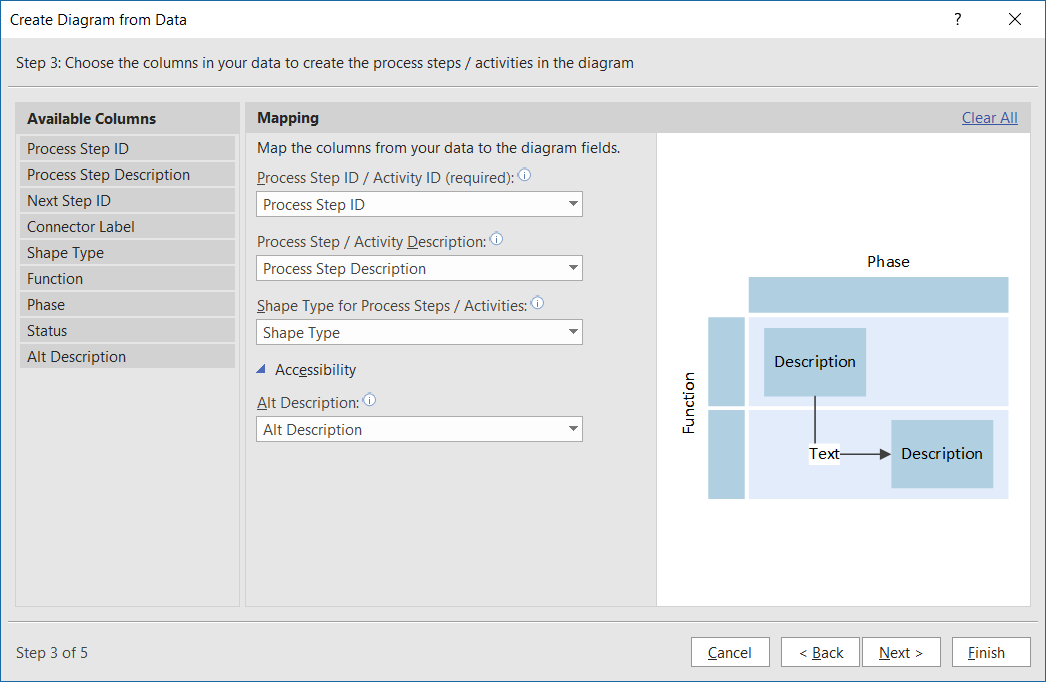
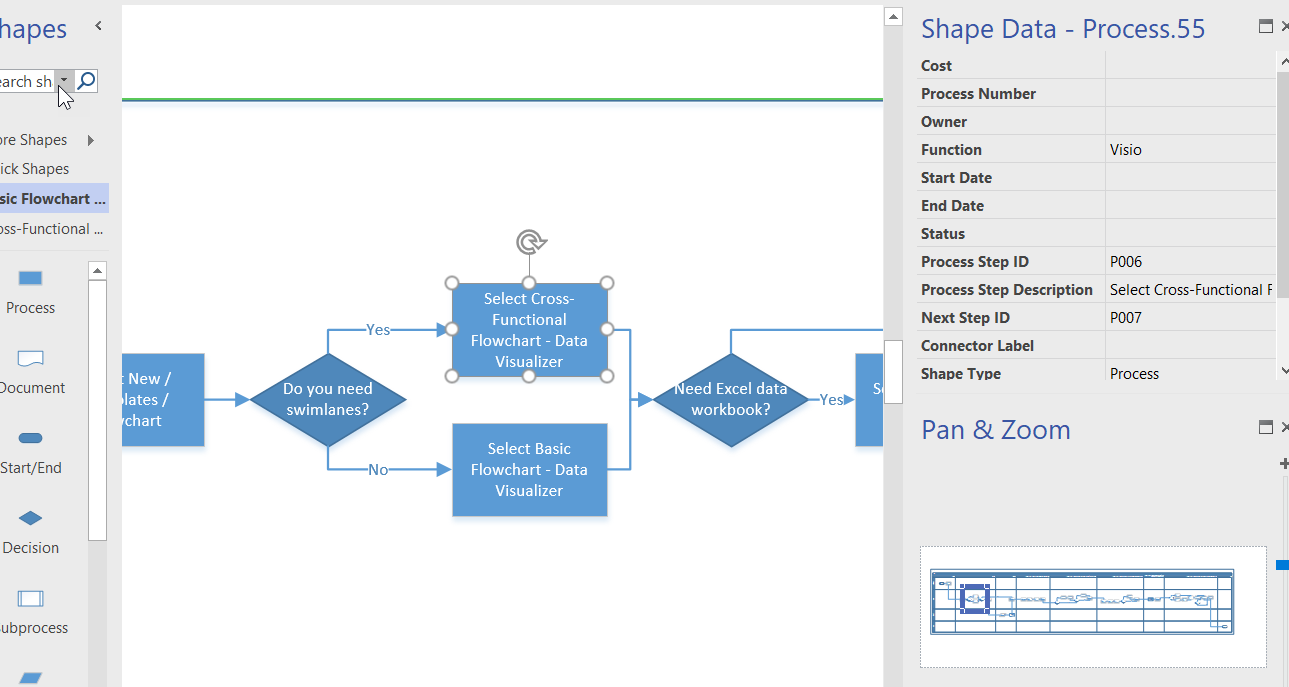
I walked though the steps to create a Cross-Functional flowchart automatically from an Excel table in my last article ( Data Visualizer for #Visio Pro for Office 365 – Part 1 ), but I often prefer to use a relational data source, such as Access or SQL Server, to store and organise my data. Therefore, I describe how Excel‘s Get Data (nee PowerQuery) can be used to merge together the data in a relational data source as a single table suitable for Data Visualizer in Visio Pro for Office 365.
[Read more…] about Data Visualizer for Visio Pro for Office 365 – Part 2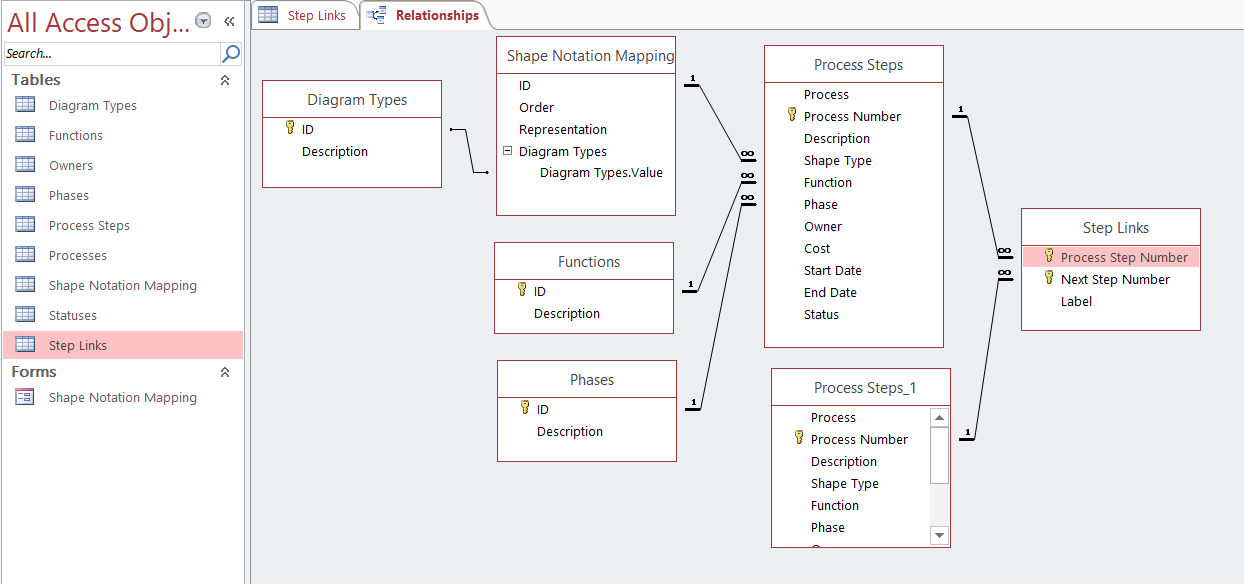
Data Visualizer for Visio Pro for Office 365 – Part 1
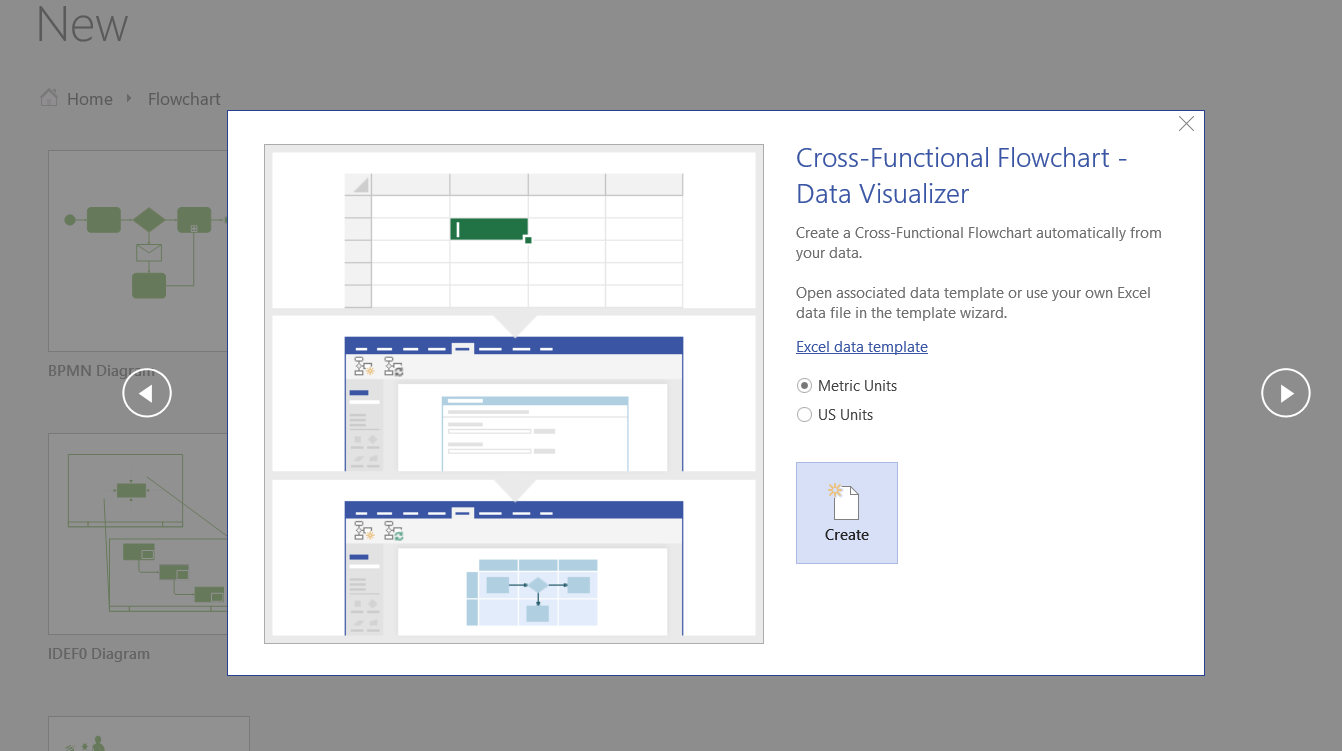
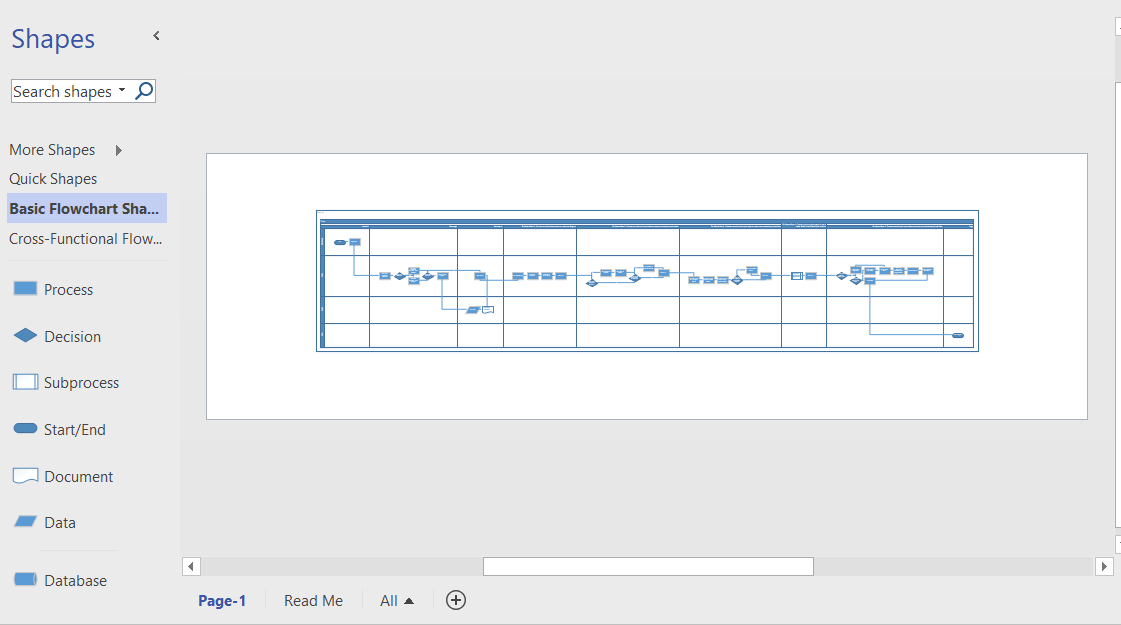
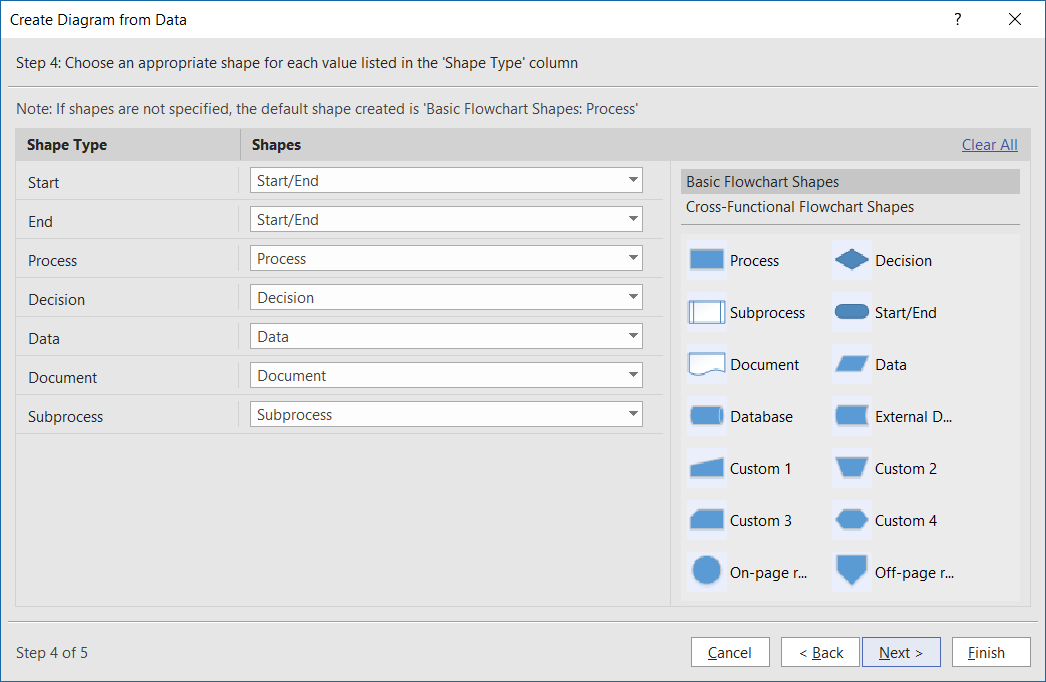
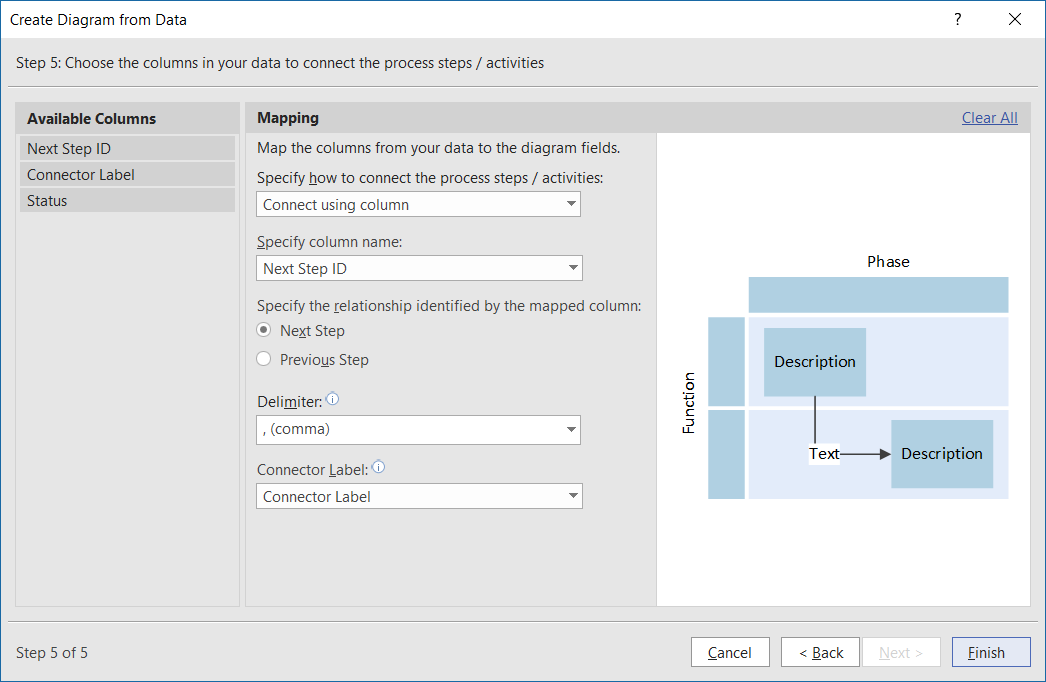
Microsoft have just released Data Visualizer for Viso Pro for Office 365! This great new feature provides you with the ability to create diagrams from an Excel table automatically. It currently comes with two new templates for creating Basic or Cross-Functional flowcharts, but the feature can be used for many other different types of diagrams.
[Read more…] about Data Visualizer for Visio Pro for Office 365 – Part 1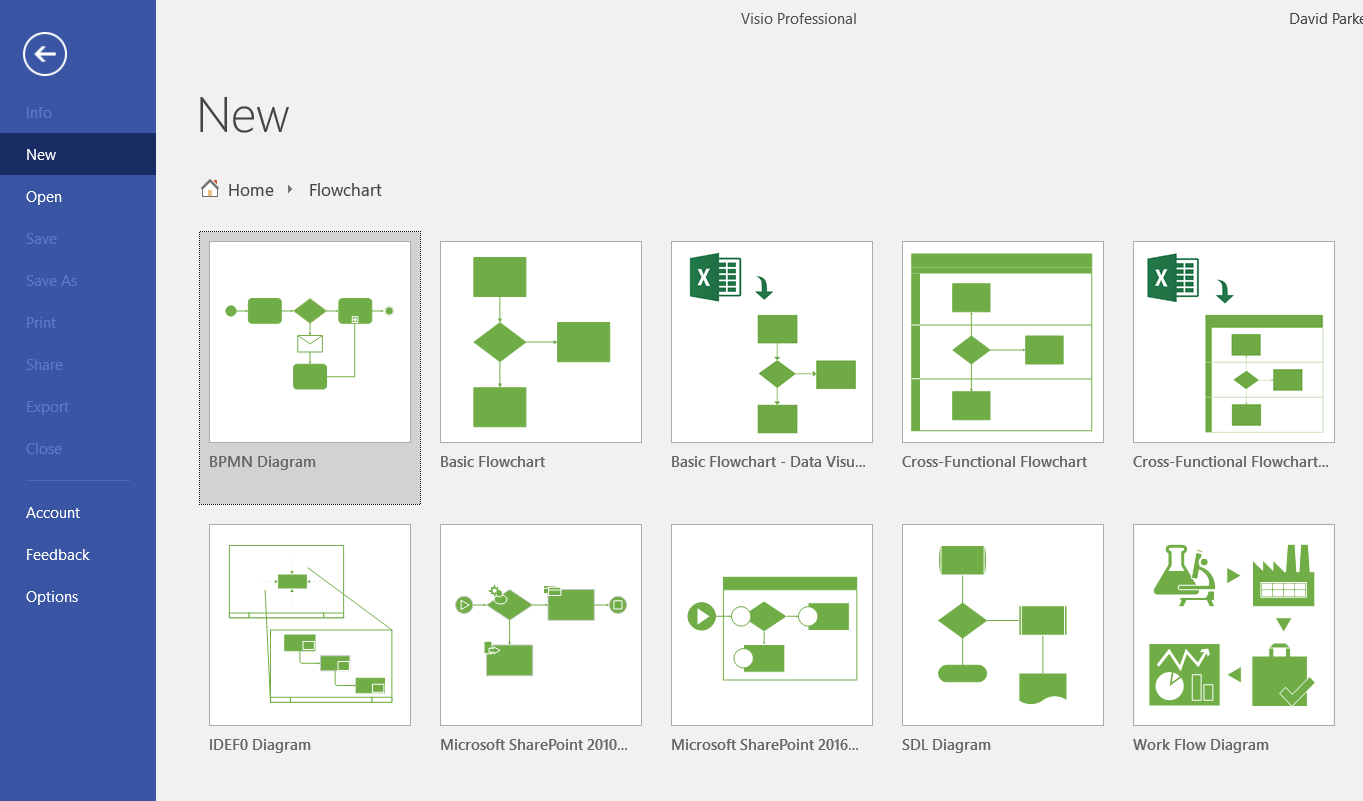
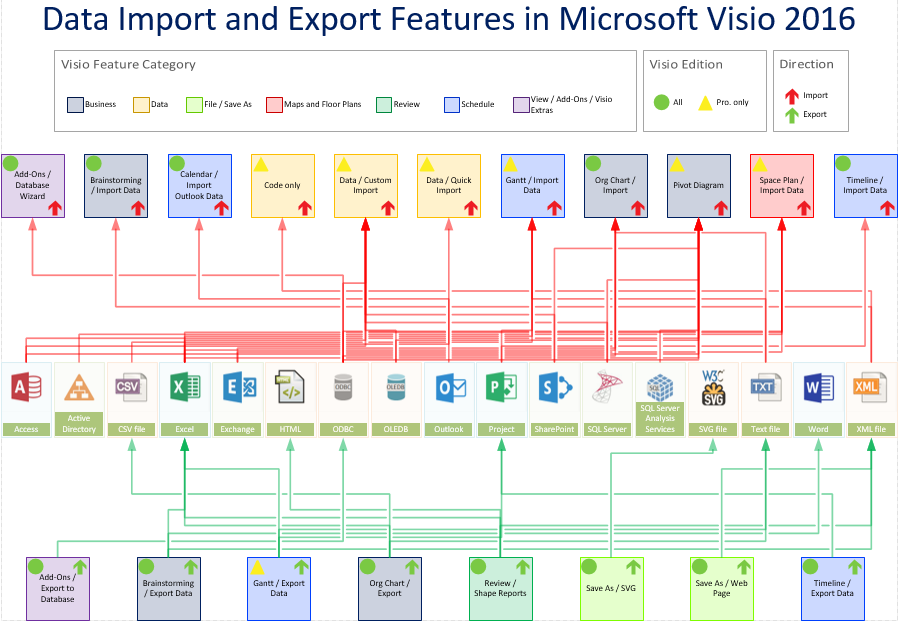
Data Import and Export Features in Visio 2016 (and 2013)
One of my most viewed articles is about the data import and export features in Visio 2010 (see http://blog.bvisual.net/2011/05/24/data-import-export-features-in-visio-2010/ ), so I thought that I should do something similar for Visio 2016. In fact, there is very little change since Visio 2013 …. The download file contains VBA code that I used to connect the shapes together from the data recordsets.
Power Map is looking pretty powerful!
I watched a presentation today about some of the new features of Power Map. I was impressed, and the surprising thing is that the data does not have to be location data to get a 3D visualisation. All that is needed is to establish a co-ordinate system and any data can be transformed … and it can even have a time dimension!

https://www.facebook.com/MSPowerMap
It can do some visualisations that are just not possible with Visio, but I could see that Visio could be used to feed custom maps to Power Map with base layers and a co-ordinate system.
Cool custom maps : https://blogs.office.com/2014/10/08/6-cool-ways-use-custom-maps/
I will play some more with this soon….