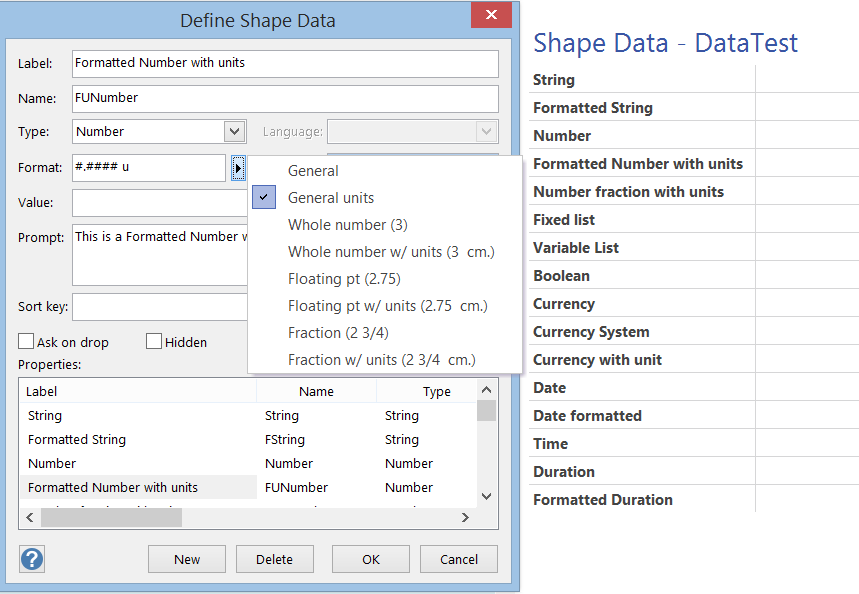
One of the best aspects of Visio is the ability of shapes to hold data, and the easiest way to do this is to define rows of Shape Data. Each row can be defined as holding one of eight different types, and most of these can have their values formatted for display. In this article I discuss the formatting of these values, using either ShapeSheet functions or automation methods. The driver for this is my on-going frustration with the Microsoft provided standard Shape Data window because of its shortcomings … for example, its lack of multi-line support even though it can hold 64k characters in each row, and its lack of a time control, even though it can store dates and time.