Regular readers of my blog will know that I like to use the Data Visualizer (DV) in Visio Plan 2, but I recently tried to help a user who really decided to push it to the limits. In this scenario, there were multiple connections, but with different labels, being created between the same flowchart shapes, and the plea was how to make it work! Well, I experimented with this, and found that DV does not really work well in this way, and then proposed an alternative approach, which I will explain in this article.
First, I will show how it fails by setting up an Excel table that does contains multiple connections, but fails to update the labels consistently.
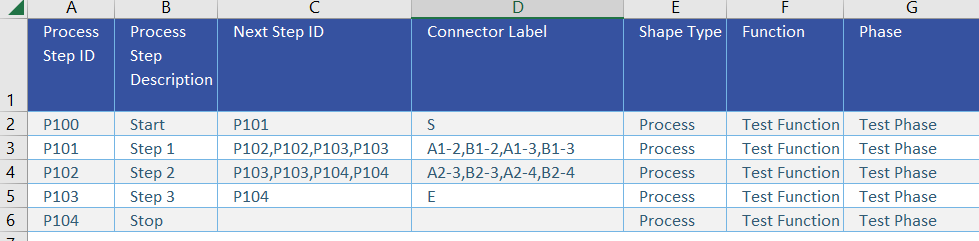
Lesson 1: Export from Excel to Visio is not the same as Import to Visio from Excel
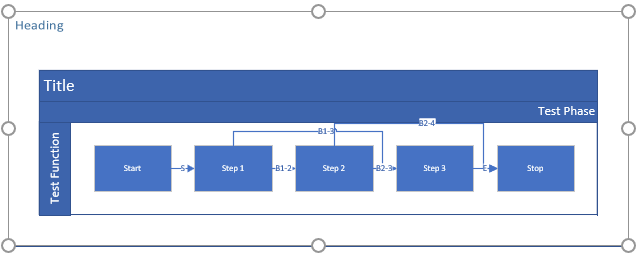
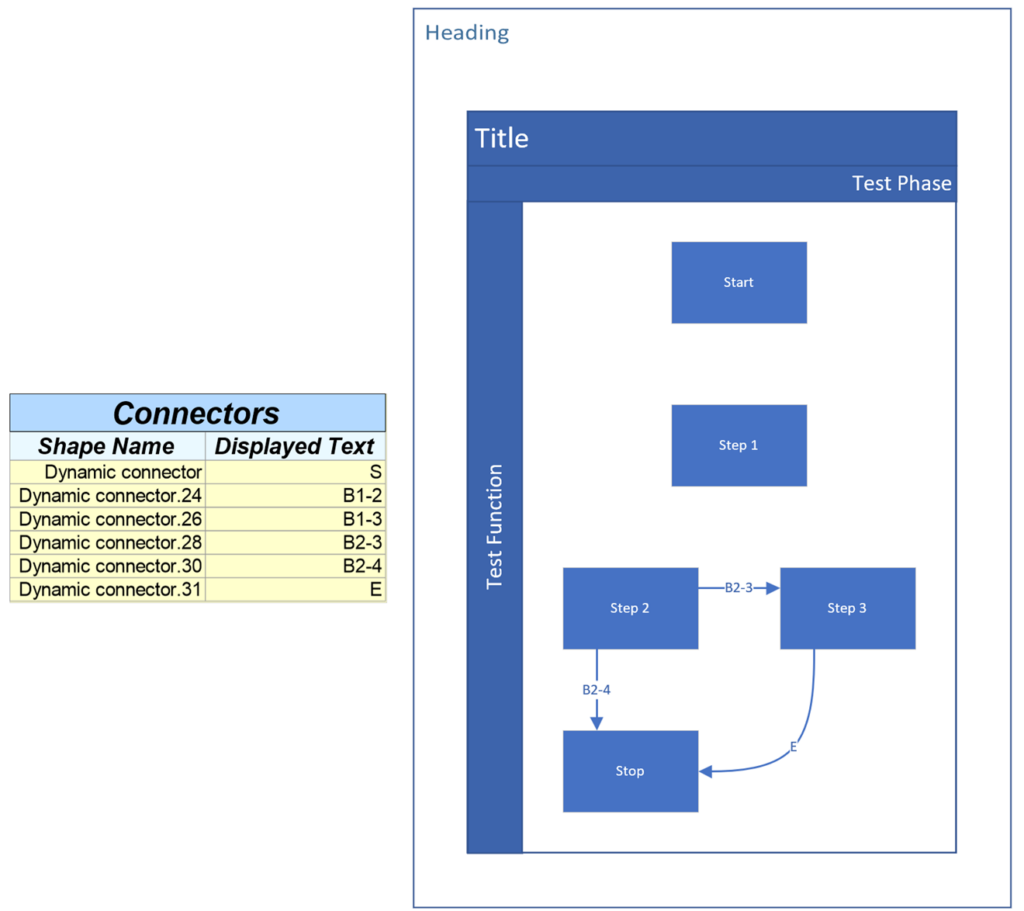
The following screenshot was created by clicking Table Design / External Table Data / Export / Export Table to Visio Diagram… in Excel for the above table, and then choosing the Cross-Functional Flowchart (horizontal) option.
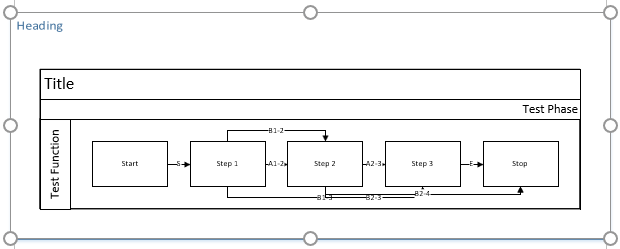
I then chose Hierarchy / Top to Bottom the Design / Layout / Re-Layout Page gallery, and created a simple Shape Report to see the text on each Dynamic connector shape. It was then clear that I had to manually change some of the connectors to use static rather than dynamic glue so that I could see them all.
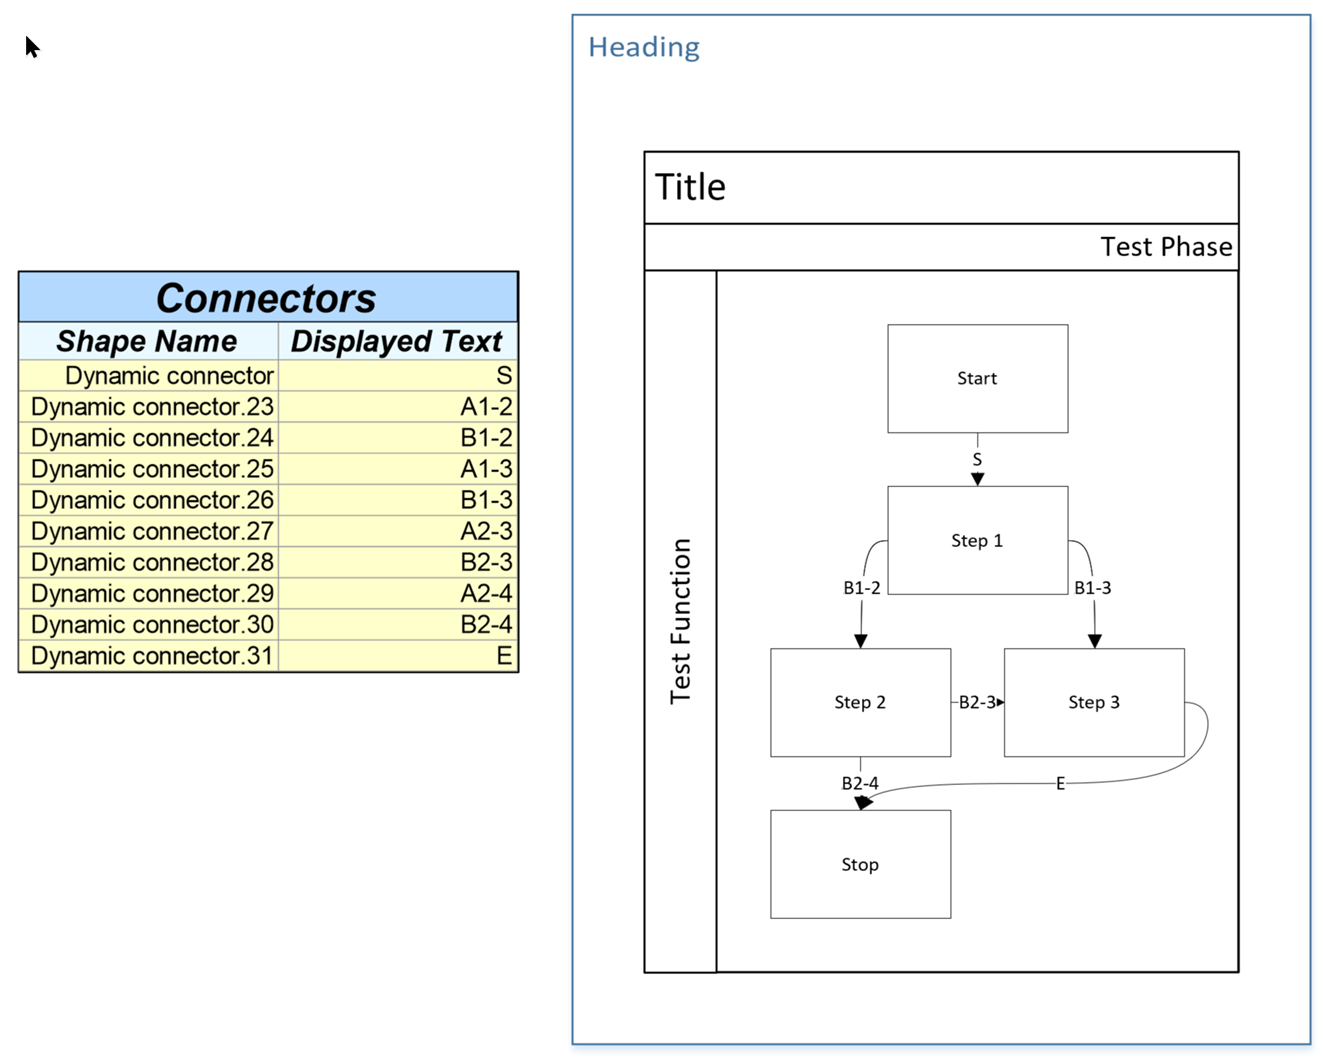
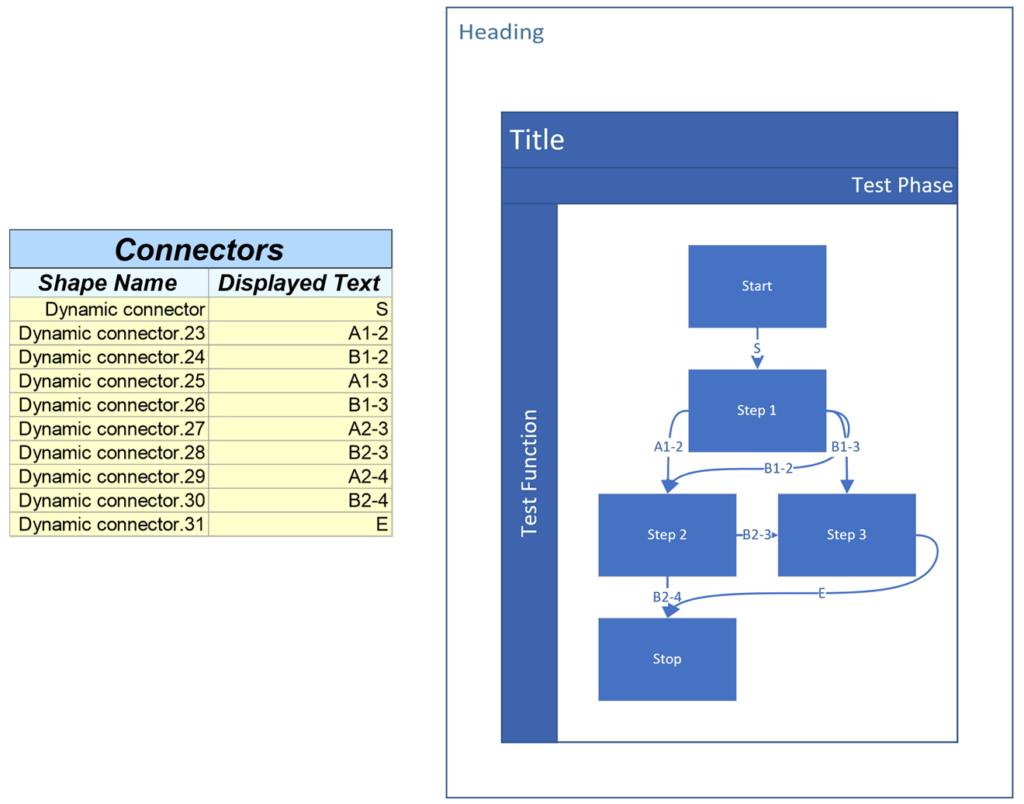
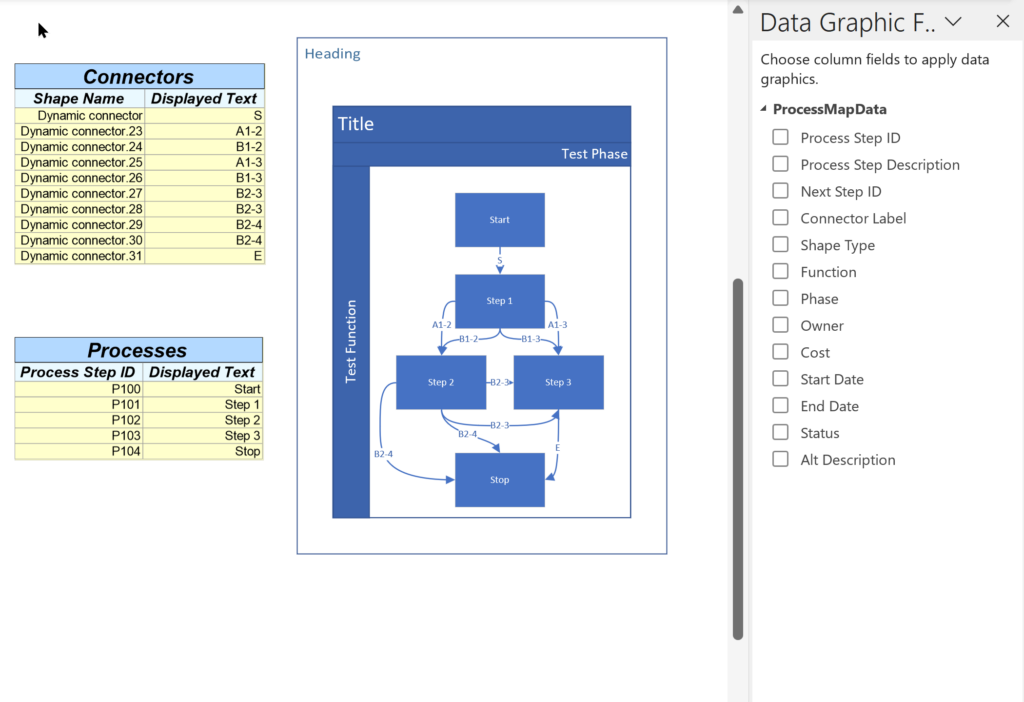
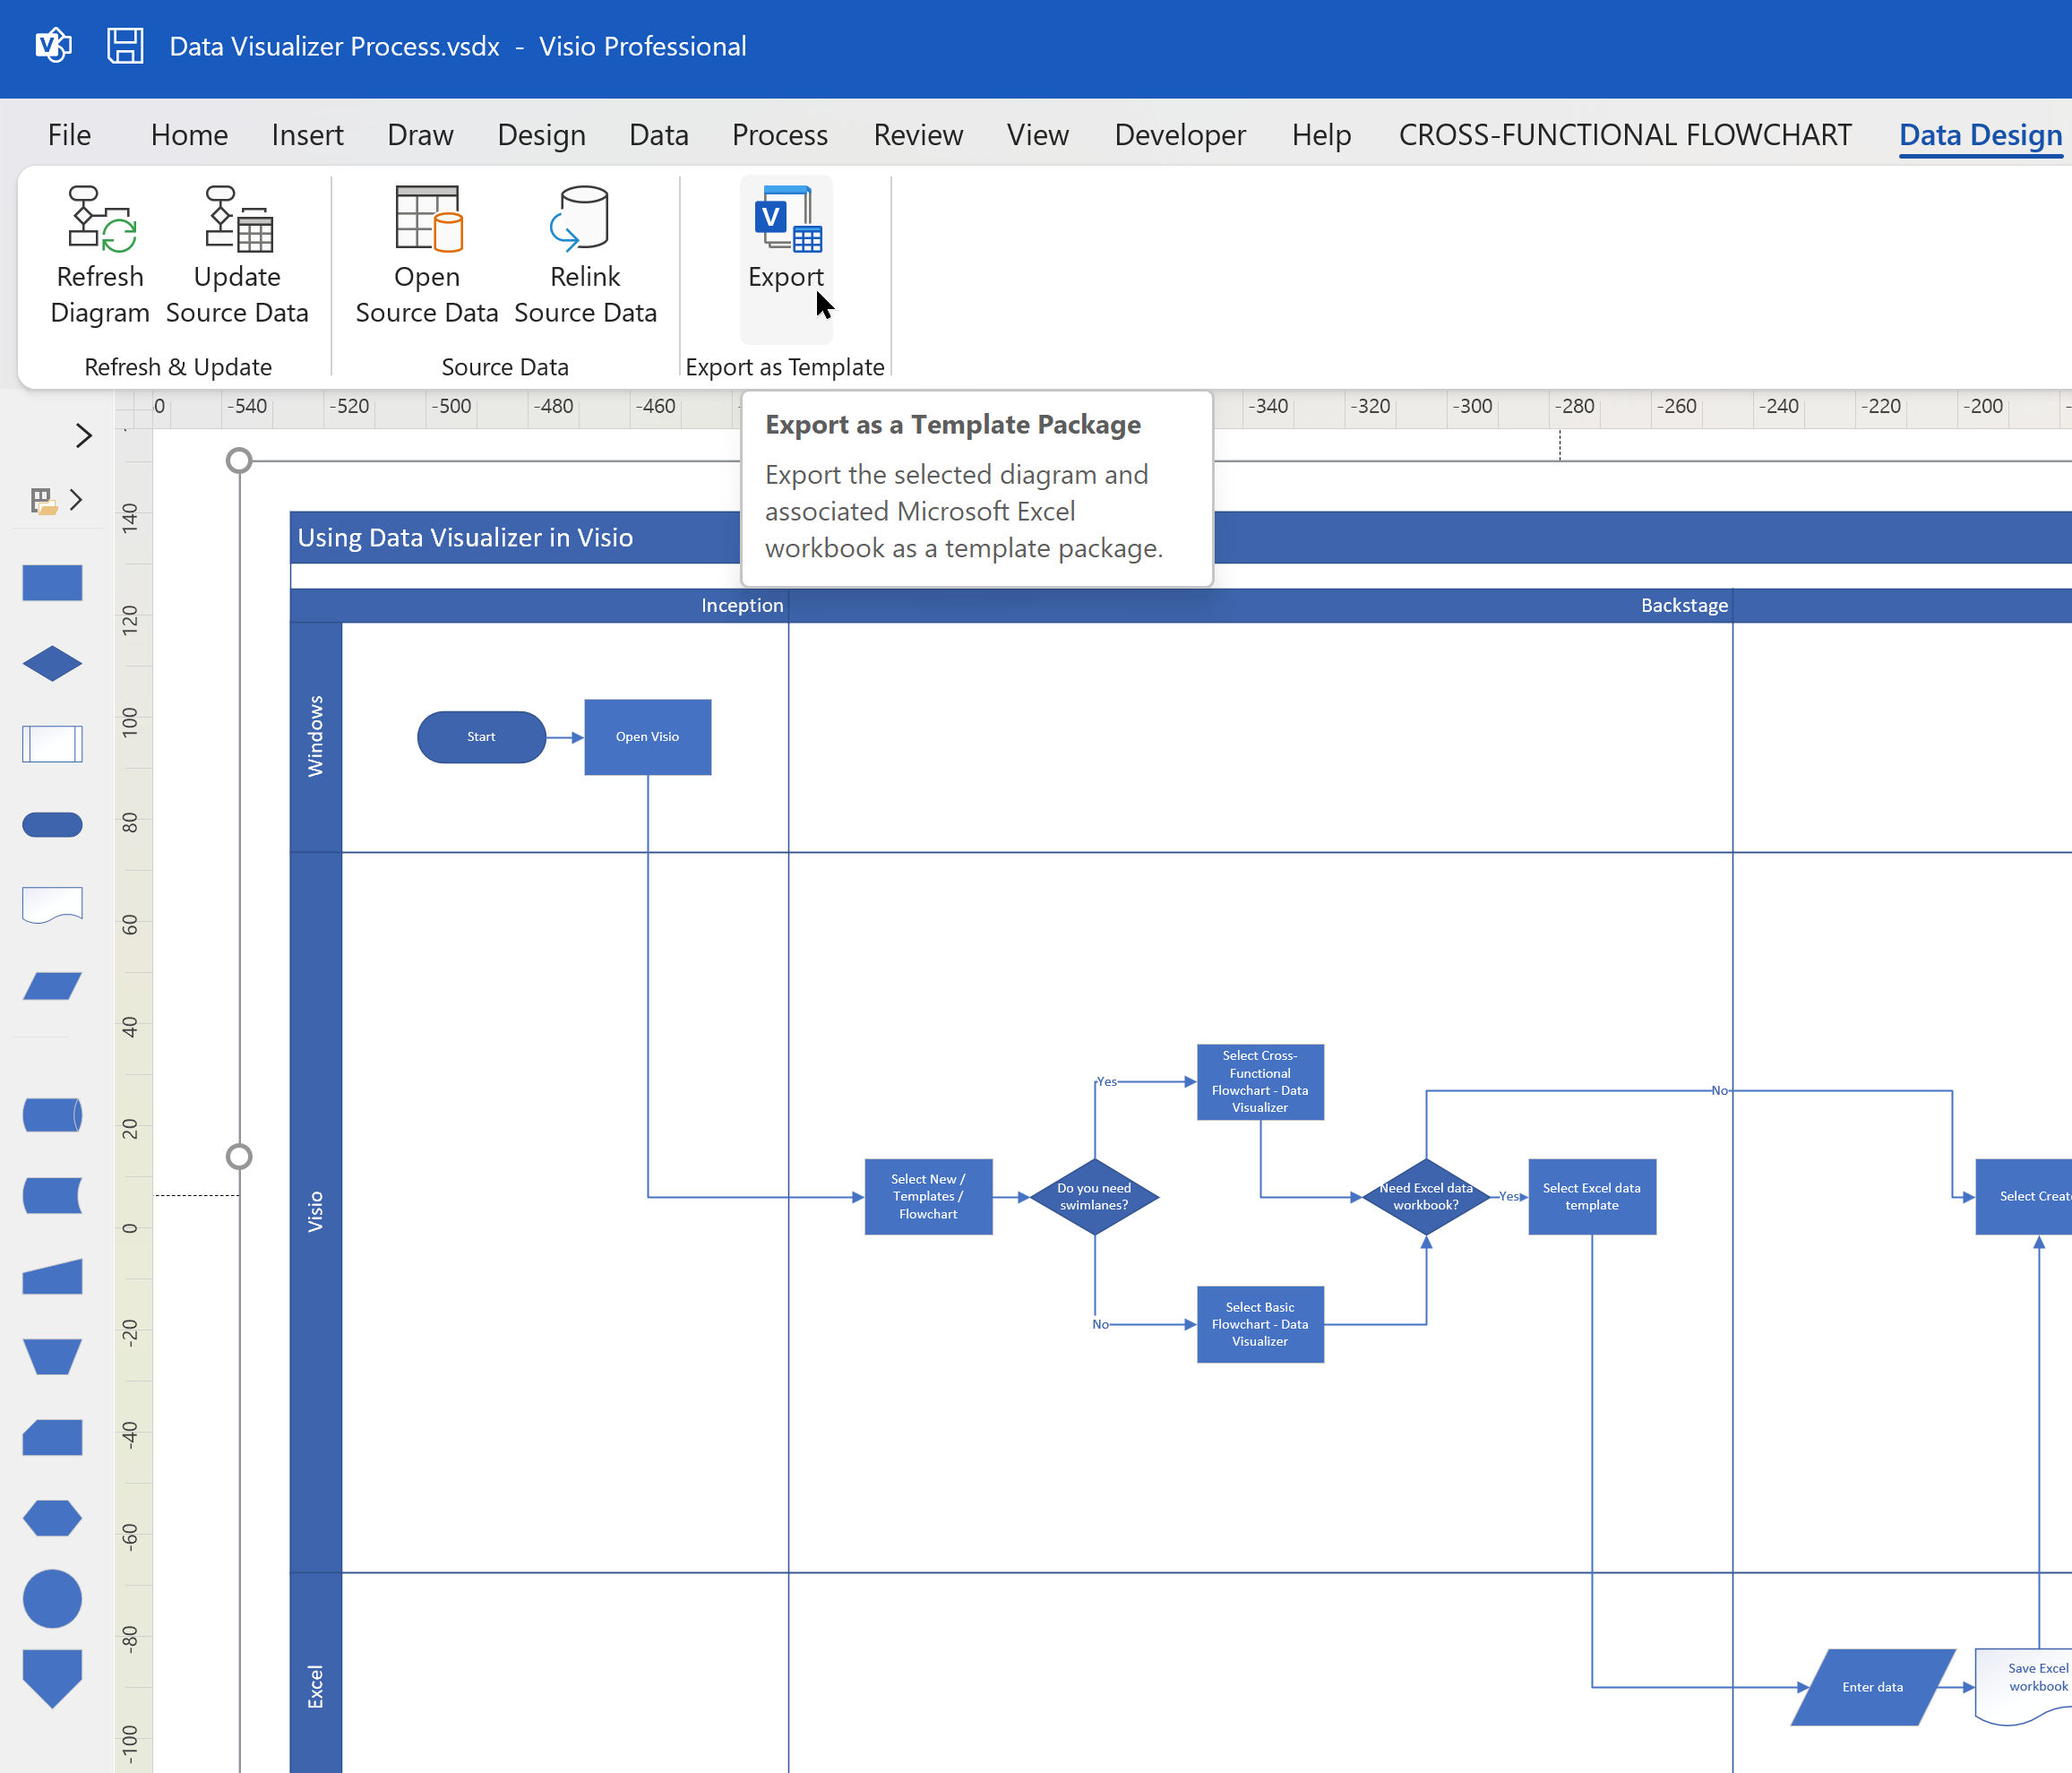
The following screenshot, however, was created by creating a new Cross-Functional Flowchart – Data Visualizer in Visio, then choosing the above Excel table.
As before, I then chose Hierarchy / Top to Bottom the Design / Layout / Re-Layout Page gallery and created a simple Shape Report to see the text on each Dynamic connector shape. Again, it was then clear that I had to manually change some of the connectors to use static rather than dynamic glue so that I could see them all. Unfortunately, Visio sometimes gets confused about which connector should have which label, and can get it wrong, as shown below, where the same label has been duplicated.

These errors can occur in the export from Excel too. I have also seen instances where the connector label becomes uneditable in Visio.
Therefore, my conclusion is that DV cannot handle multiple connectors between the same shapes.
Also, the template used by the export to Visio from Excel is different to the one used by import from Excel in Visio.
Lesson 2: Making Connectors Invisible is not the Same as Making Lines 100% Transparent
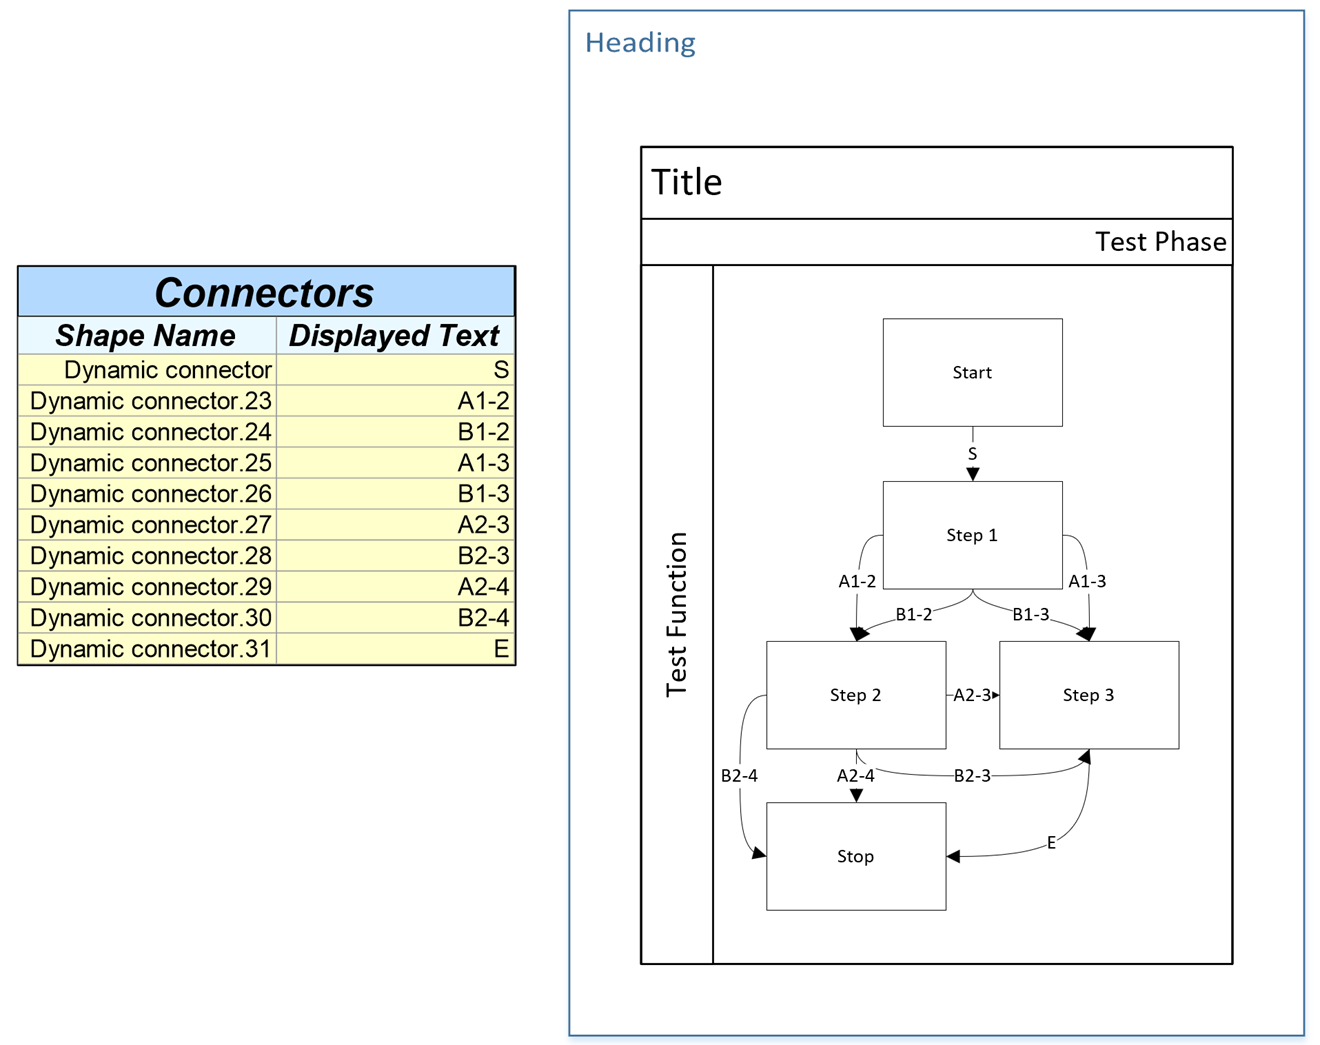
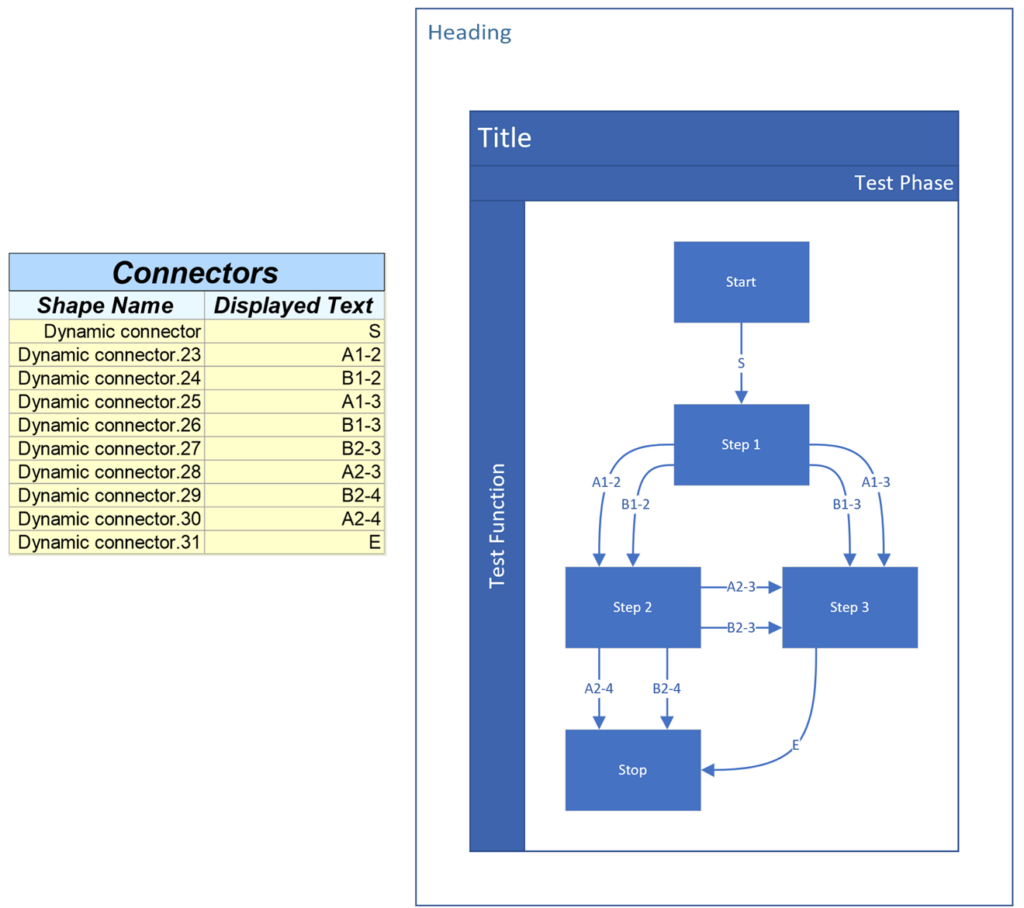
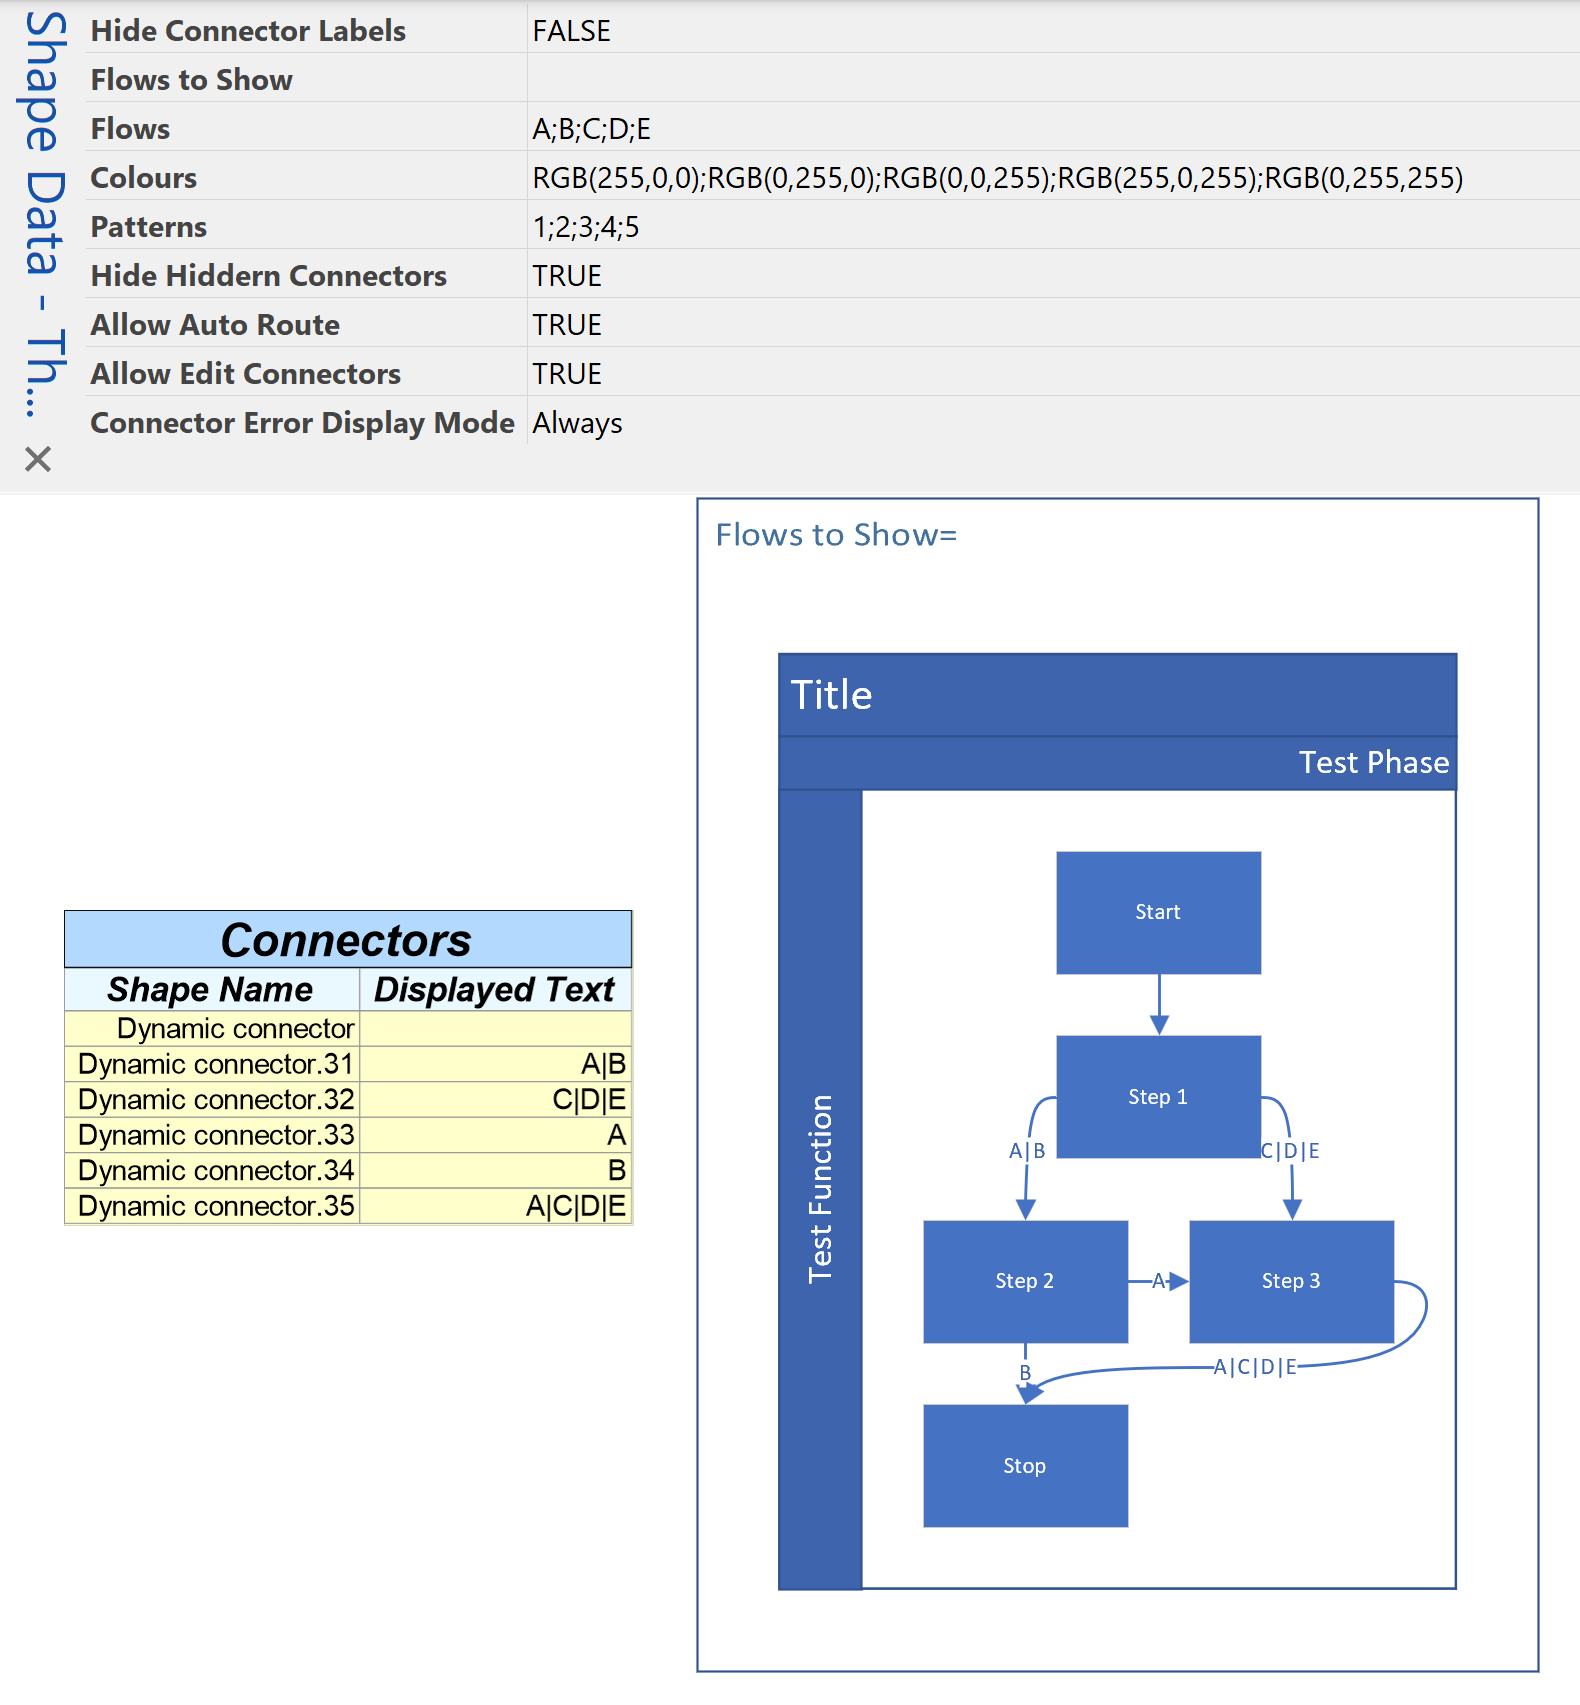
I added extra connection points to the Process shape so that all the connectors could be spaced out, and I edited the labels back to what they should have been, so finally I could display the connections clearly in the following screenshot.
However, this diagram needs to be used to display the alternative routes between Process shapes, and the user wanted to make some connectors invisible so that the desired connectors are shown clearly. My first thought was to move some connectors to a different layer, and then make the new layer invisible.
Unfortunately, DV automatically deleted all the connectors that were assigned to a layer that was made invisible!
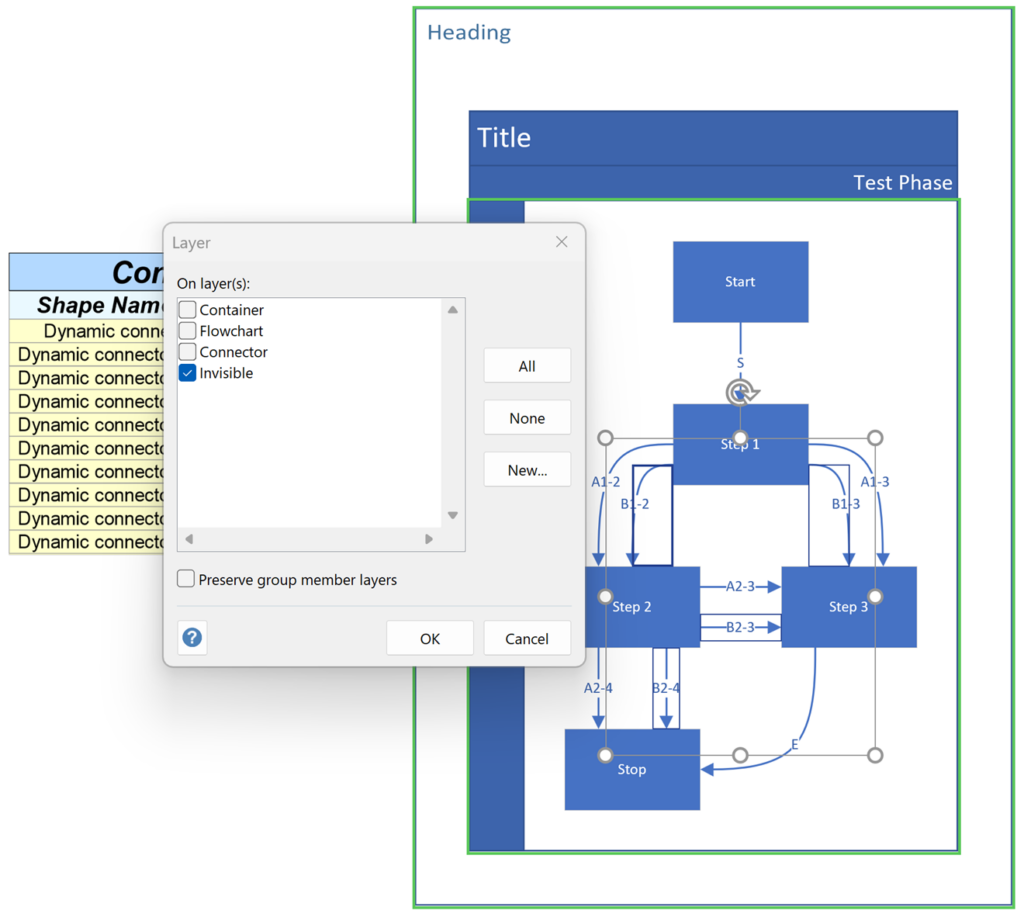
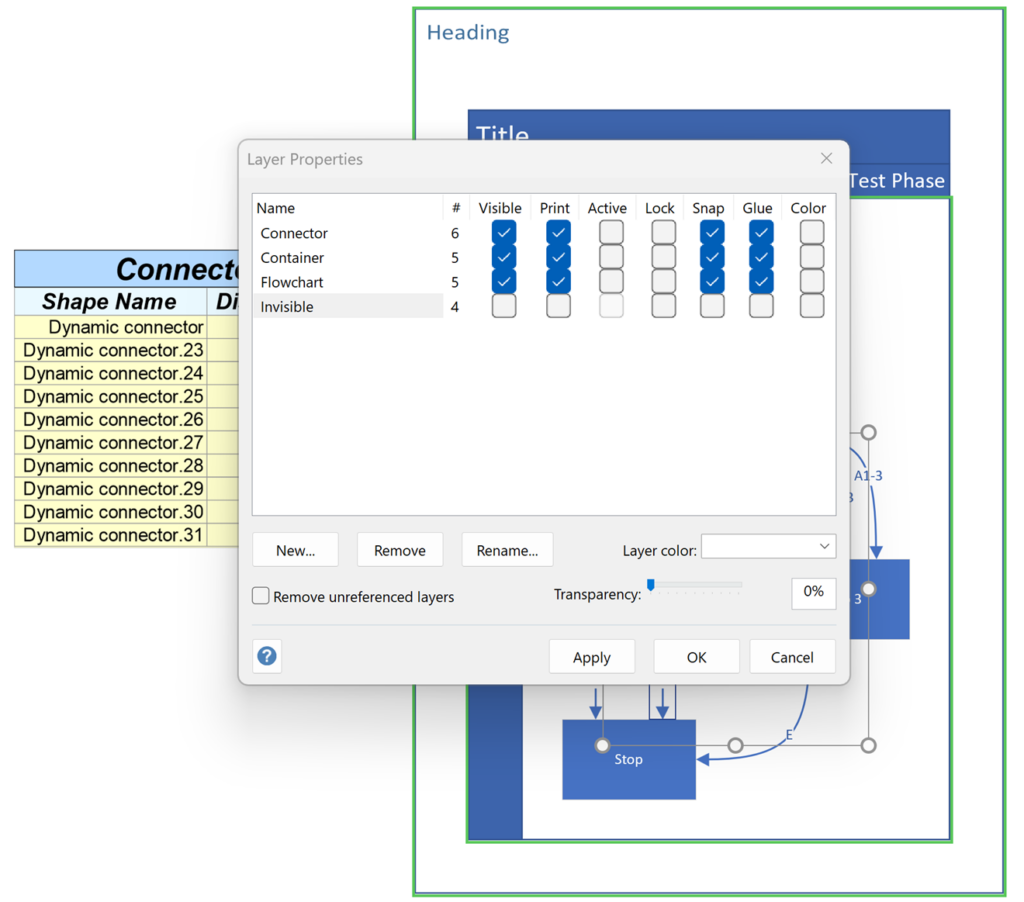
So, the alternative is to assign this new layer to a colour, and make the colour 100% transparent!
So, my conclusion is to never assign any DV controlled shapes to a transparent layer!
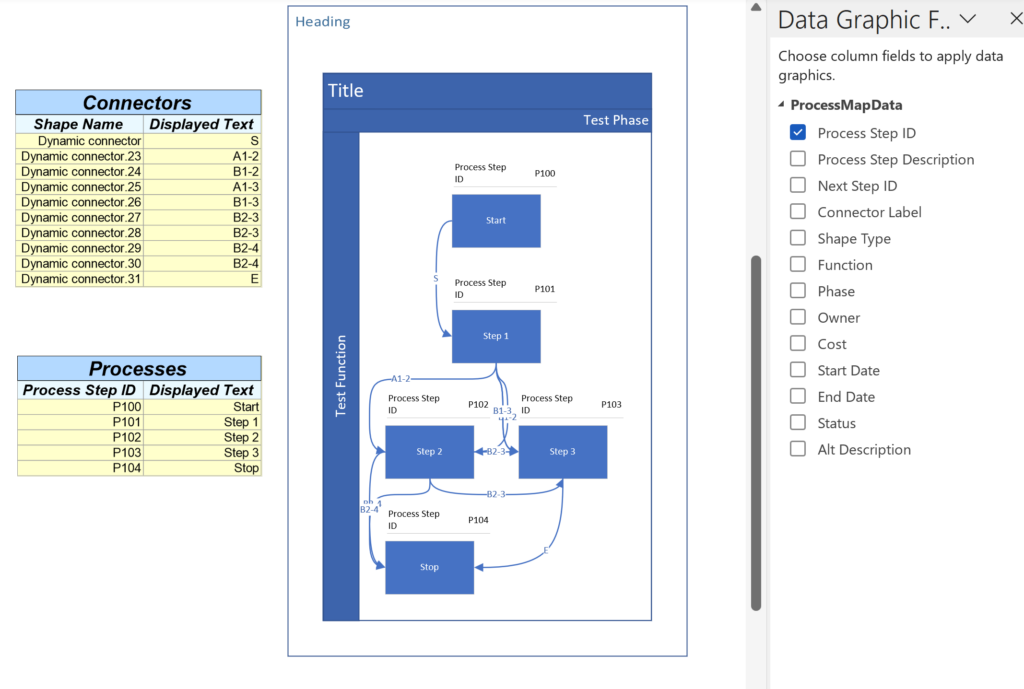
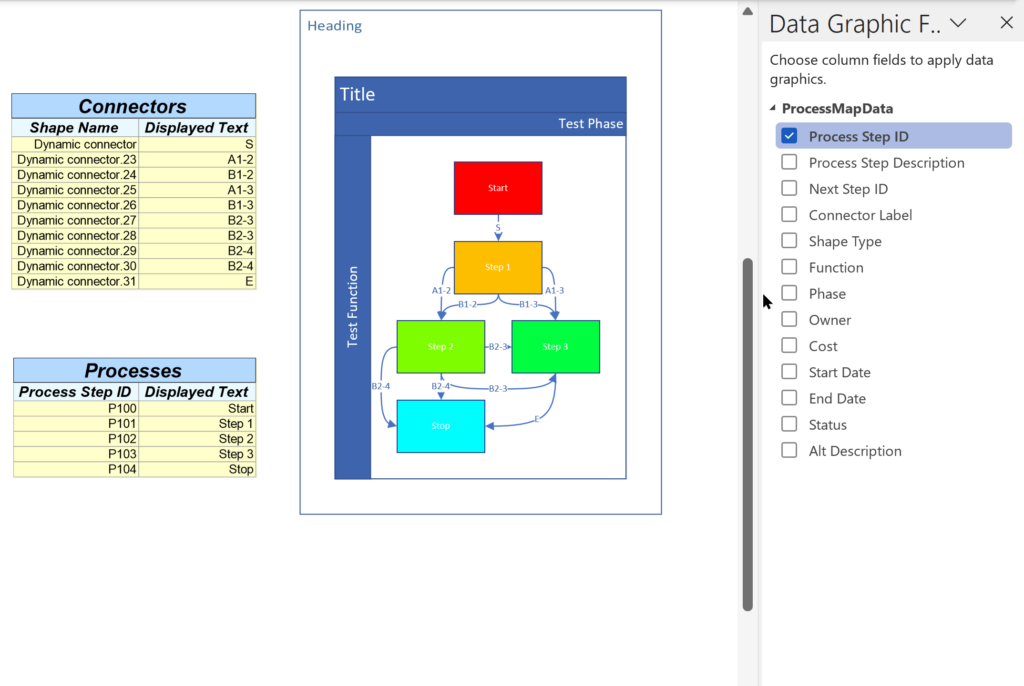
Lesson 3: Even choosing Color By Value using Data Graphic Fields causes a re-layout
There are times when I want to manually adjust the layout because DV does not do it quite right … However, if I then choose to use Data Design / Refresh Diagram or simply select a field in the Data Graphic Fields panel, then DV will automatically re-layout the diagram, even if all I wanted was to have Color by Value. This is because the Data Graphic Field row selection will try to guess what Graphic Item you may want, and this will change all the data-linked shapes to groups, if they are not already, and insert a Graphic Item sub-shape causing the bounding rectangle to be extended, and consequently forcing the layout to be re-spaced. Then, if you change it to the Color by Value that was really wanted, it is too late, the unrequired sub-shape is removed, and the re-layout is automatically performed again!
My next post will focus on a solution to overcome these issues with Data Visualizer... This will mean creating a modified Visio template to import from Excel!
Related Posts
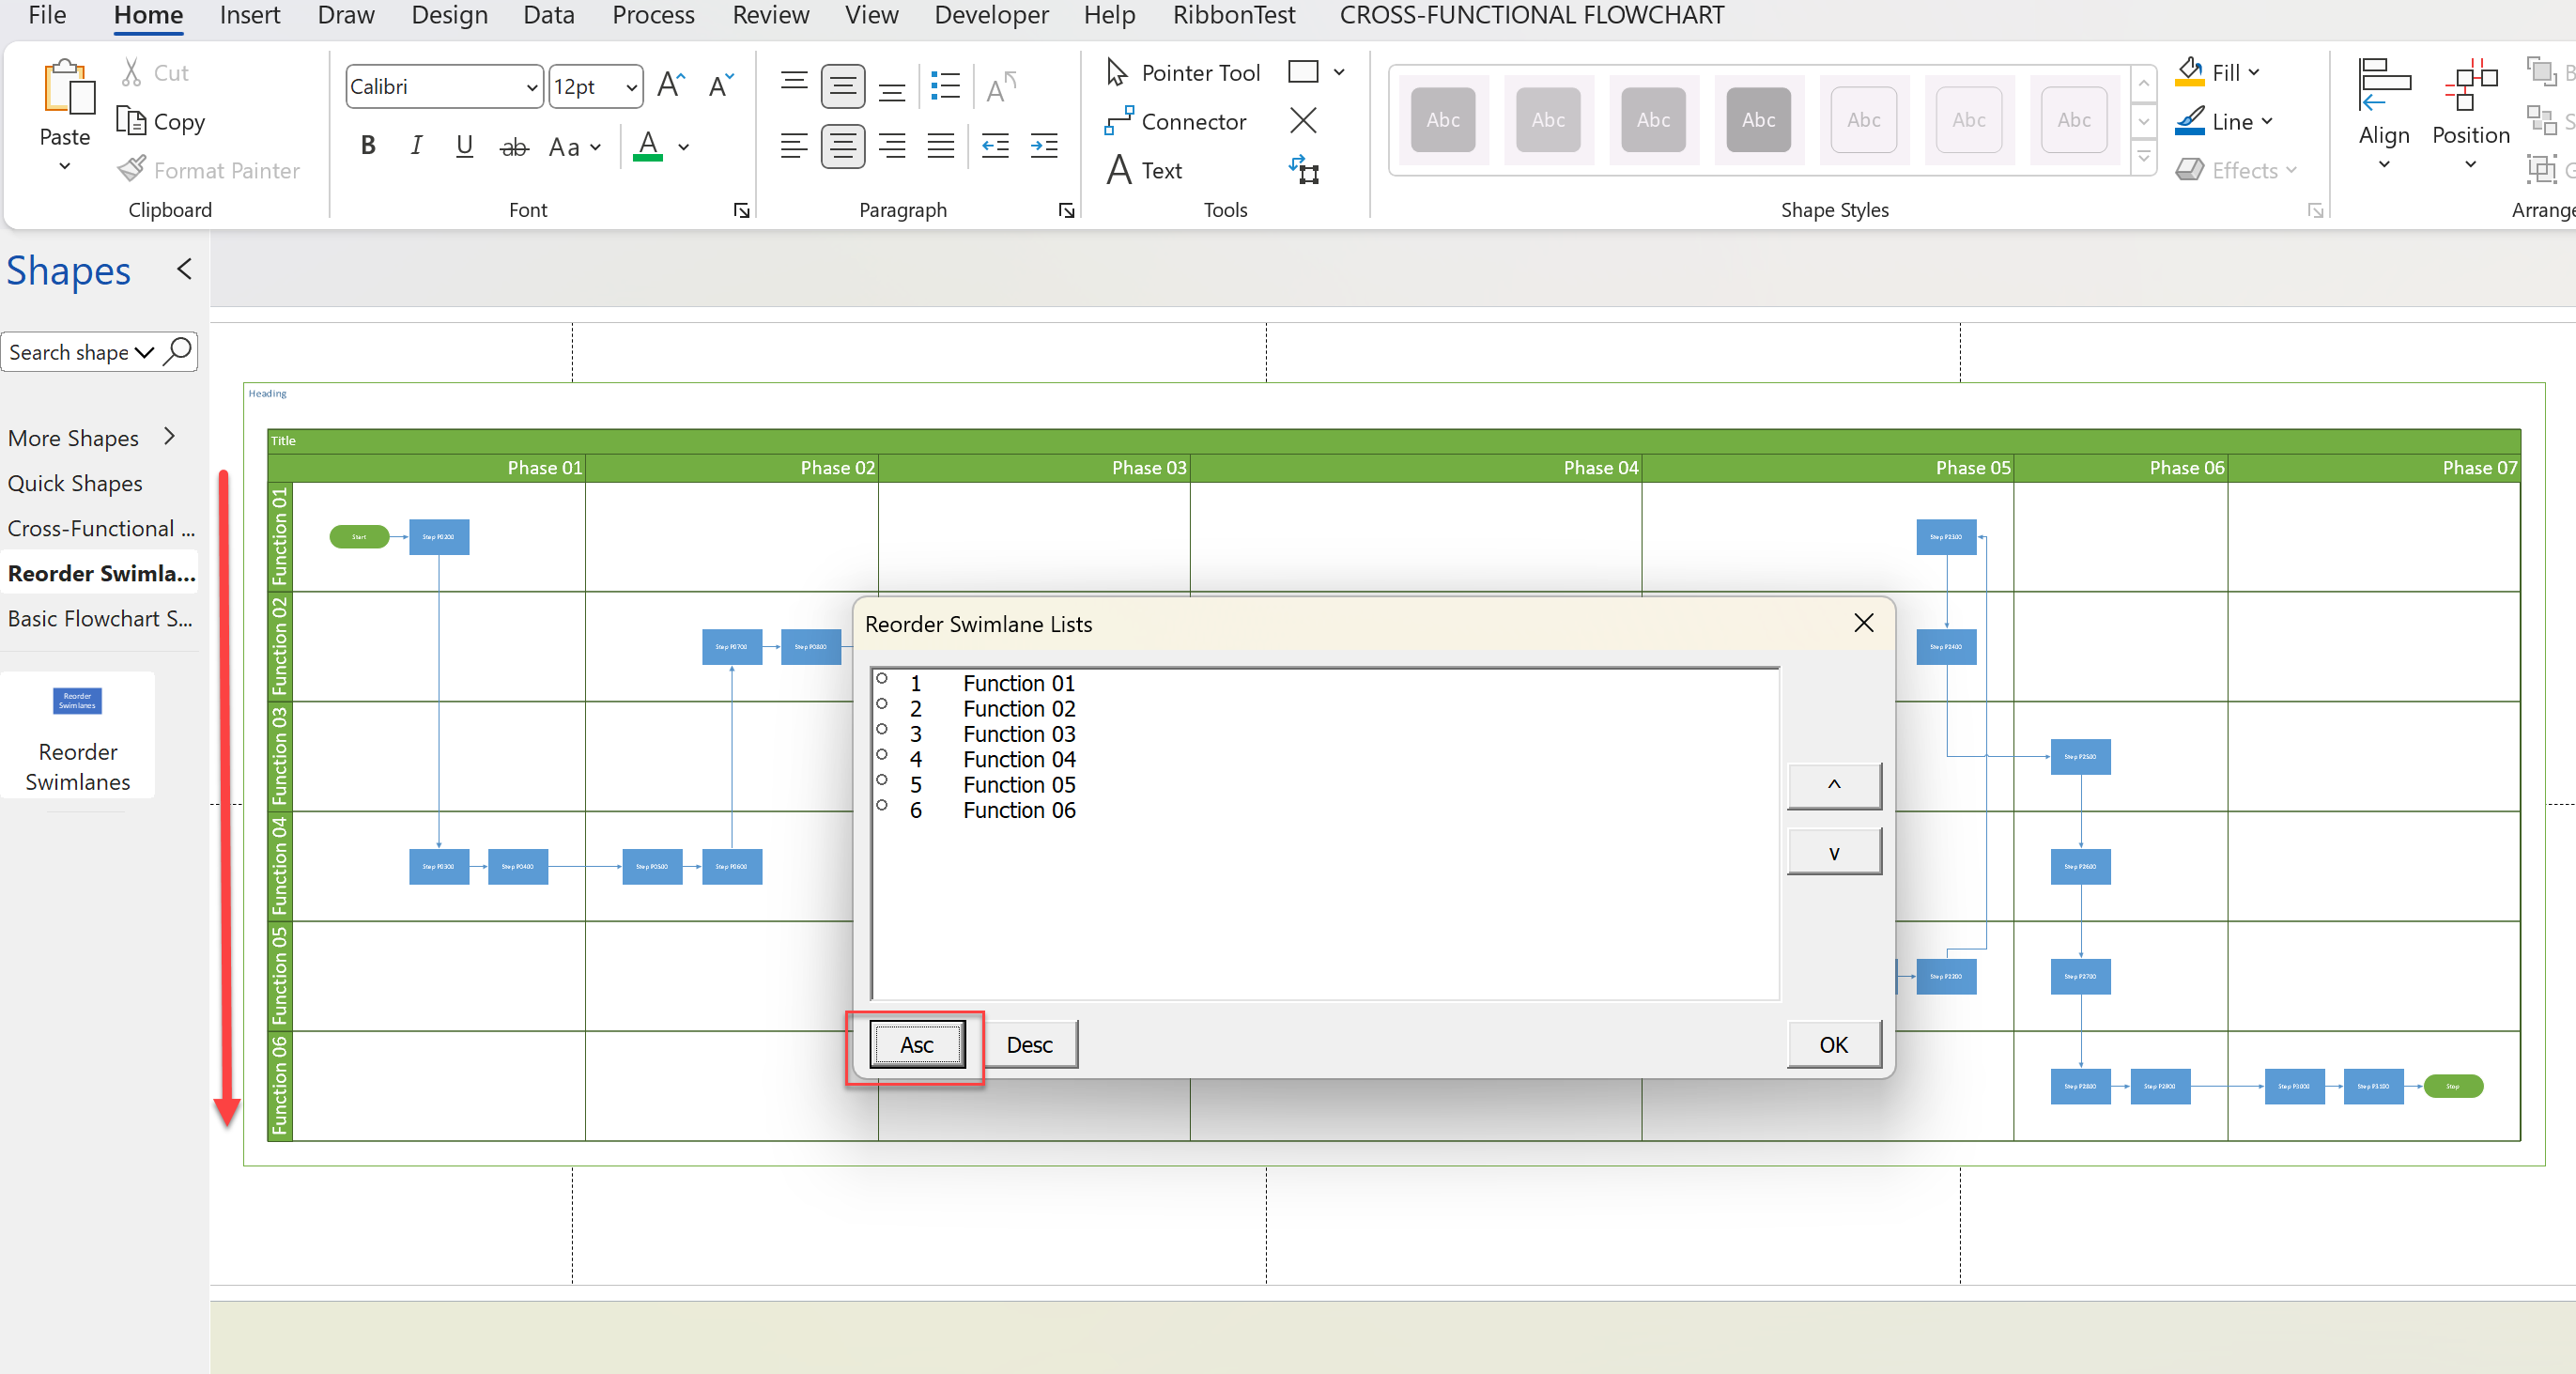
Optimize Visio Flowcharts: Swimlane Reordering Tips
Microsoft Visio desktop Plan 2 and Professional editions provides the ability to create and synchronize cross-functional flowcharts between the diagram and an Excel table. This is great, and widely used for many types of processes. The Excel table normally has a Function / Swimlane column that contains text that becomes labels on the swimlane containers,…
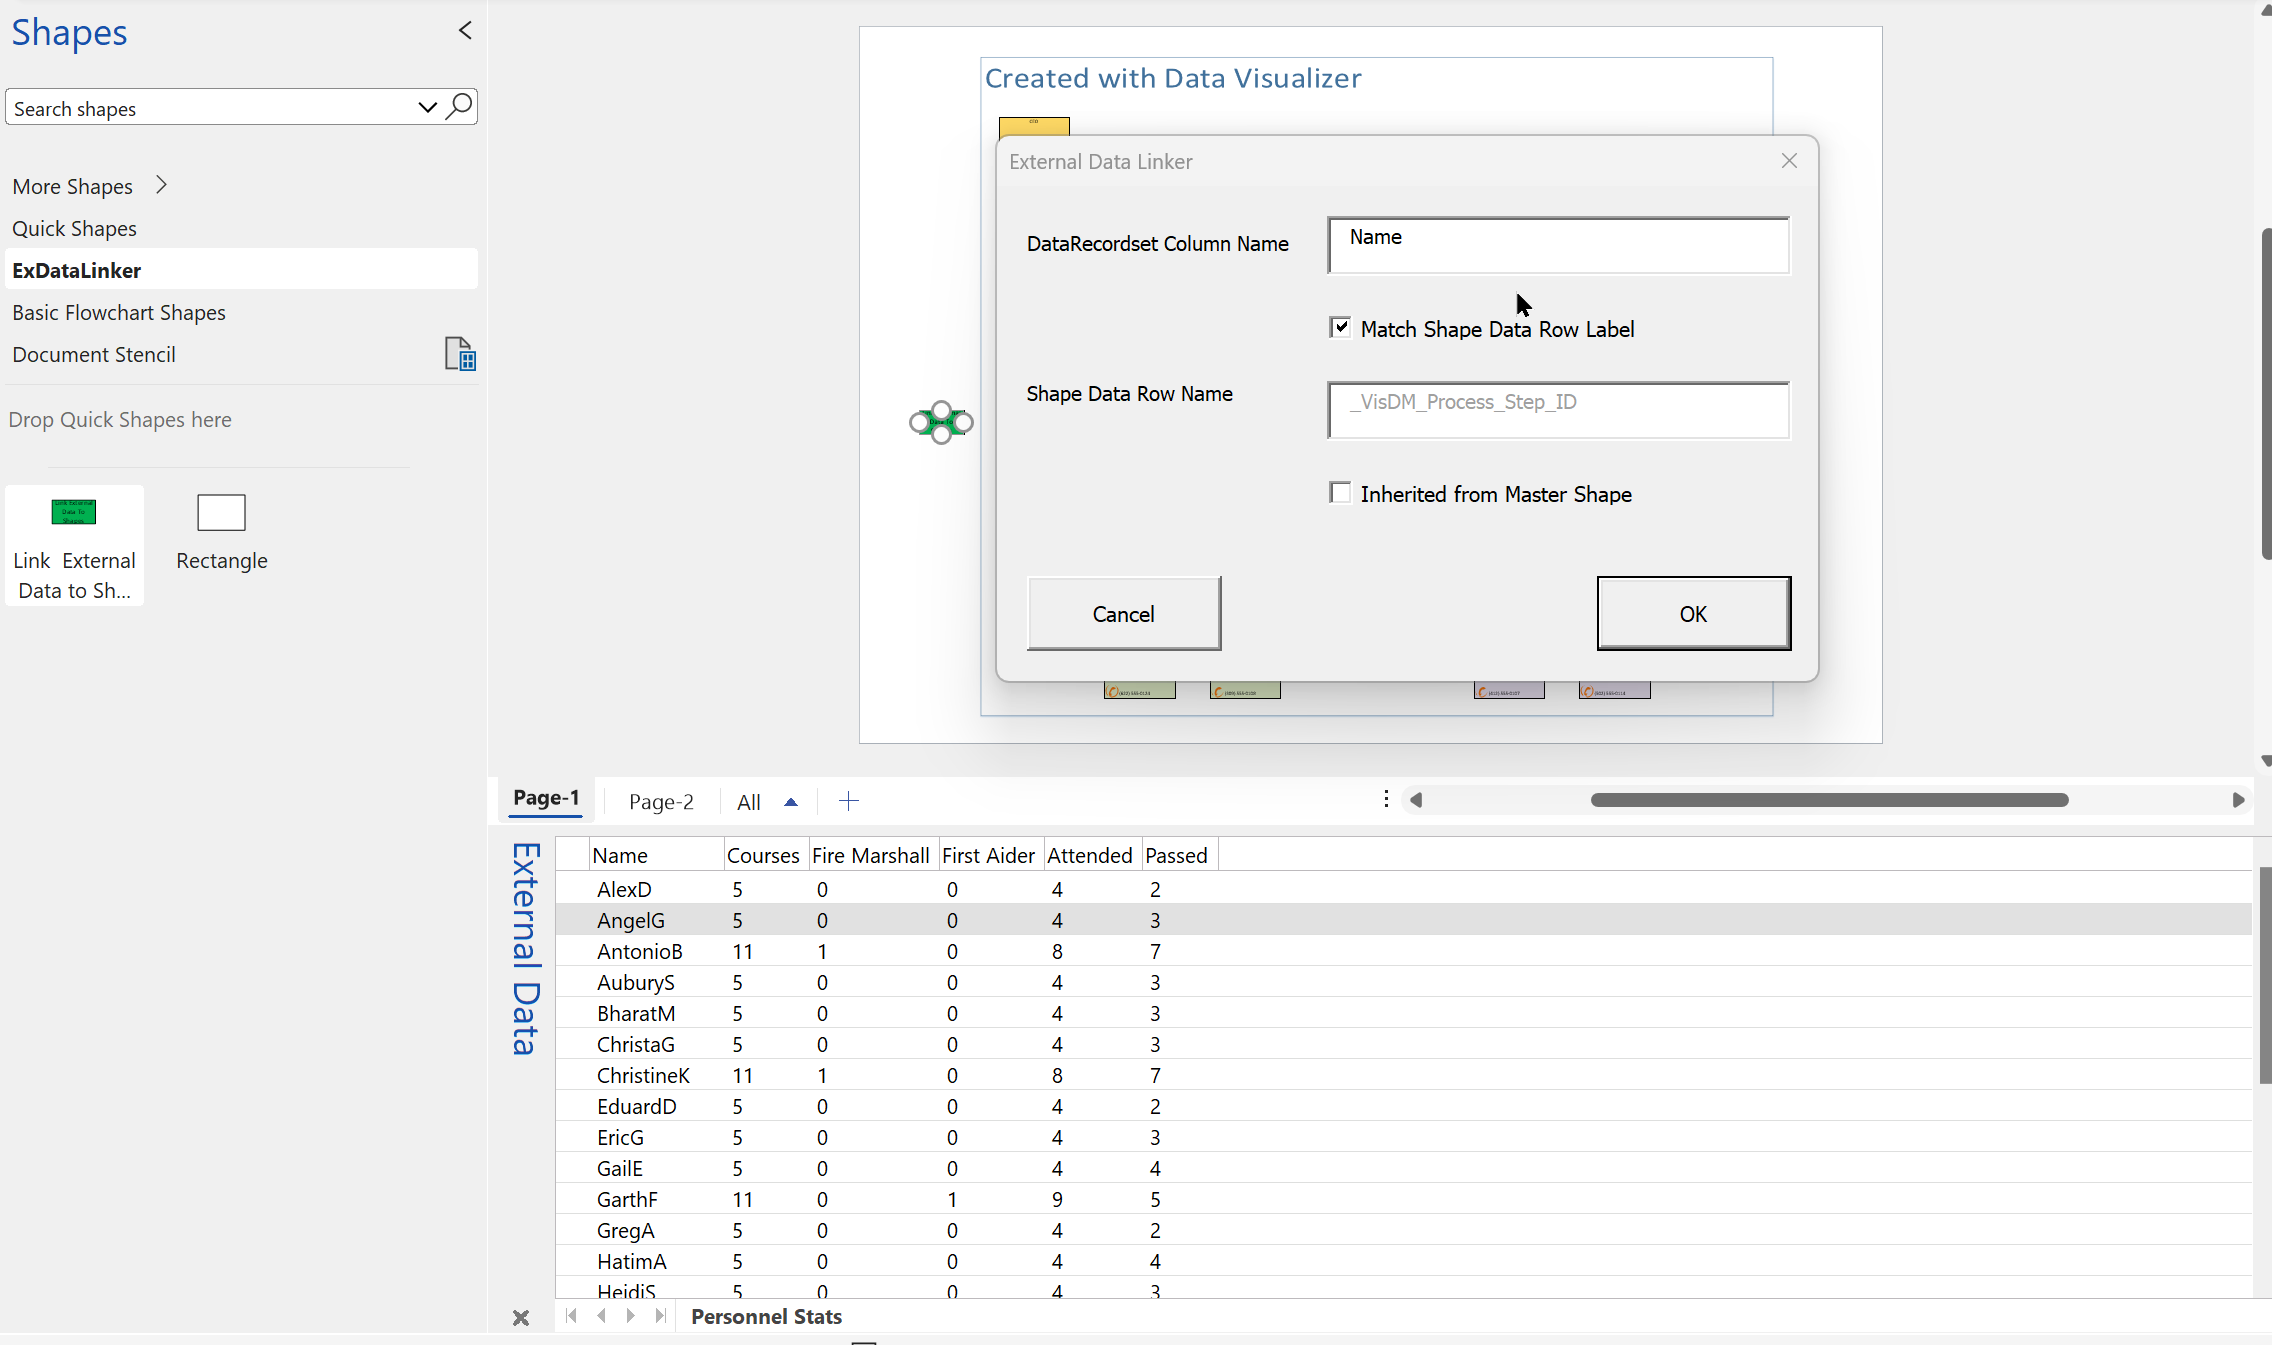
Linking Data to Shapes in Visio after using Data Visualizer
Data Visualizer (DV) in Visio Plan 2 (Data | Create from Data | Create ) is great because it provides a way of automatically creating a diagram from data, but it also prevents some of the other data-linking features in Visio from being used. This is because DV wants to take control of the data…

My new book on Visualizing Processes with Microsoft Visio has launched
Back in the early 1990s, there was an application called ABC Flowcharter that was the market leader for diagramming business flowcharts, but some of the brains behind Aldus PageMaker saw an opportunity to create something smarter, and left to write the Visio product, with the stated aim to overtake ABC Flowcharter within 2 years. They…
Pushing Data Visualizer in Visio beyond its limits
My last post was about some of the lessons learnt when trying to push Data Visualizer to its limits, but this one has some ways of overcoming these limitations. The main lesson learnt is that DV binds the shapes within the DV container shape, CFF Data Visualizer, and controls some of the ShapeSheet cells that…

Teams Tuesday Podcast Recording about Visio
I am delighted to share the link to my recent demonstration and conversation with fellow MVP Peter Ward about Visio in Teams. We discussed more than just Visio … and I look a bit like Max Headroom! (more…)
Binding Visio and Excel with Data Visualizer
I re-vamped some of my content about the Visio Data Visualizer add-in for Excel in my last post, so I thought I should expand a bit more on the Data Visualizer feature in Visio for Desktop (Visio Plan 2) and Excel for Desktop. I have described it in detail in previous posts, but I never…
I am a big fan of VDV and use it for process mapping and extracting the meta data – diagrams are finally not dead data. This meta data in turn can be aggregated so you can see how many scenarios you have (e.g. Excel Power Query)- what’s common and what’s different. I also like to compare current state w future state and create test documents from the mapped processes. It is an underrated powerful tool. Should be in every ERP project tool kit.