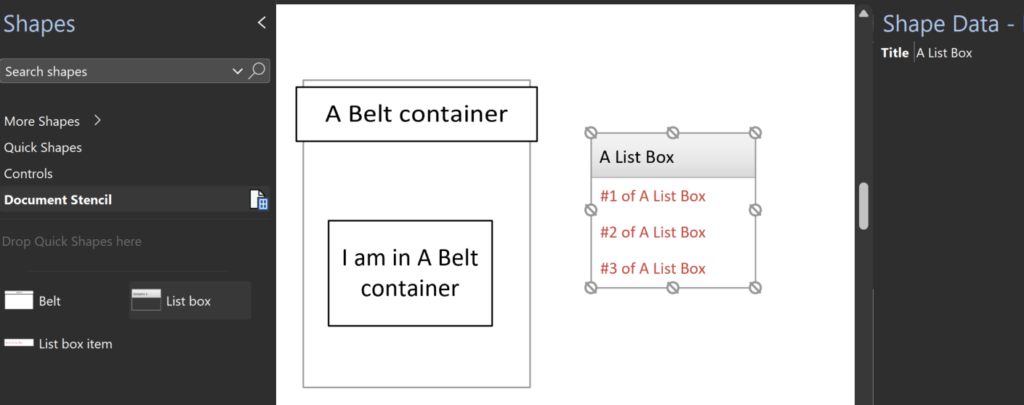
Microsoft Visio has a useful Structured Diagramming concept that consists of Containers, Callouts and Connectors. The first of these features make it possible for shapes to know what they are contained within, as a better option to grouping shapes together. Grouping can hide or break the grouped shapes smartness, so Visio provides two ways of allowing shapes to be members of one or more containers. There are a few built-in Container shapes that can be added with the Insert / Diagram Parts / Container gallery, but shape developers can also create their own. Member shapes can be positioned anywhere within the container. There is a second type of container, List, that provides the ability to have ordered member items. There is no ribbon command to add these, but there are a number of these special shapes provided in the OOTB Visio stencils. For example, dragging and dropping a List box shape from the Software and Database / Software / Controls stencil will automatically add three List box item shapes to it.
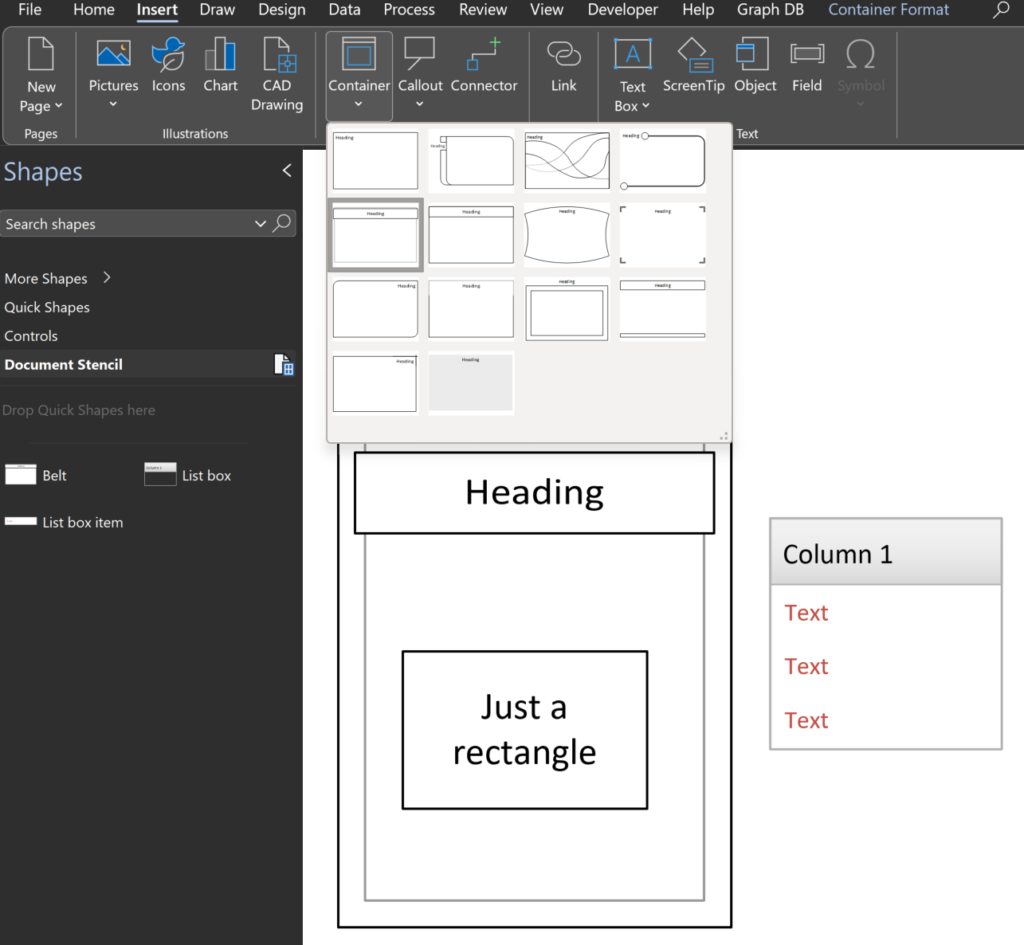
There is a dedicated ribbon tab, Container Format, that appears when you select a container shape, which provides some extra commands, but I want to demonstrate how a member shape can reference data in its container shape in the ShapeSheet. I edited the Belt and List box masters in the Document Stencil above by adding a Title Shape Data row. Of course, I also ticked the Master Properties / Behavior / Match master by name on drop option to prevent Visio creating duplicate masters. I also ticked this for List box item master because I want to edit that too.
First, I simply added a Shape Data row to each master, but made them read-only so that they displayed the text in the heading shape of each.
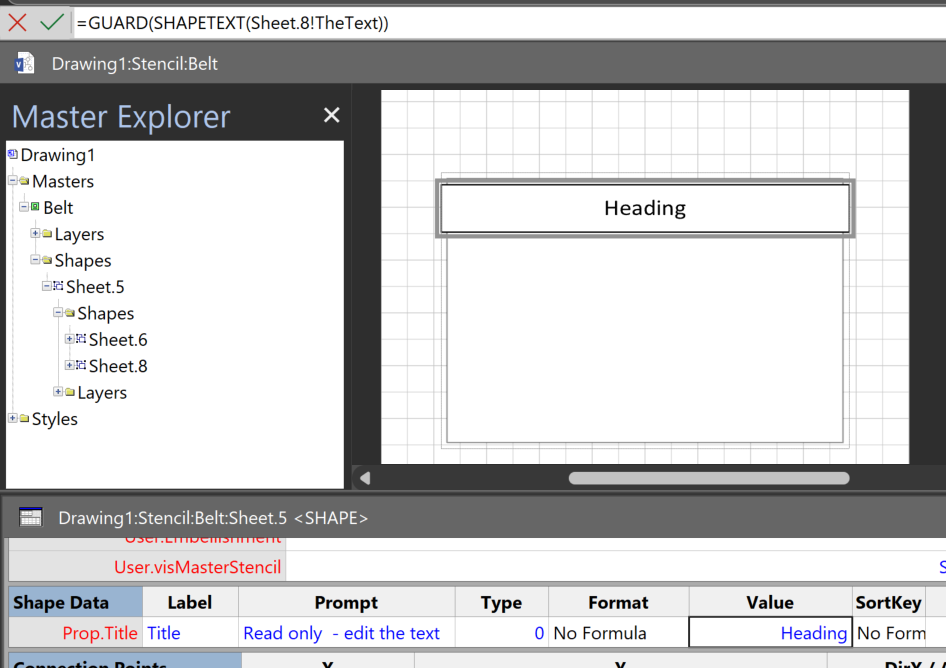
The Belt master’s heading shape is Sheet.8, so the Prop.Title.Value cell formula is:
=GUARD(SHAPETEXT(Sheet.8!TheText))
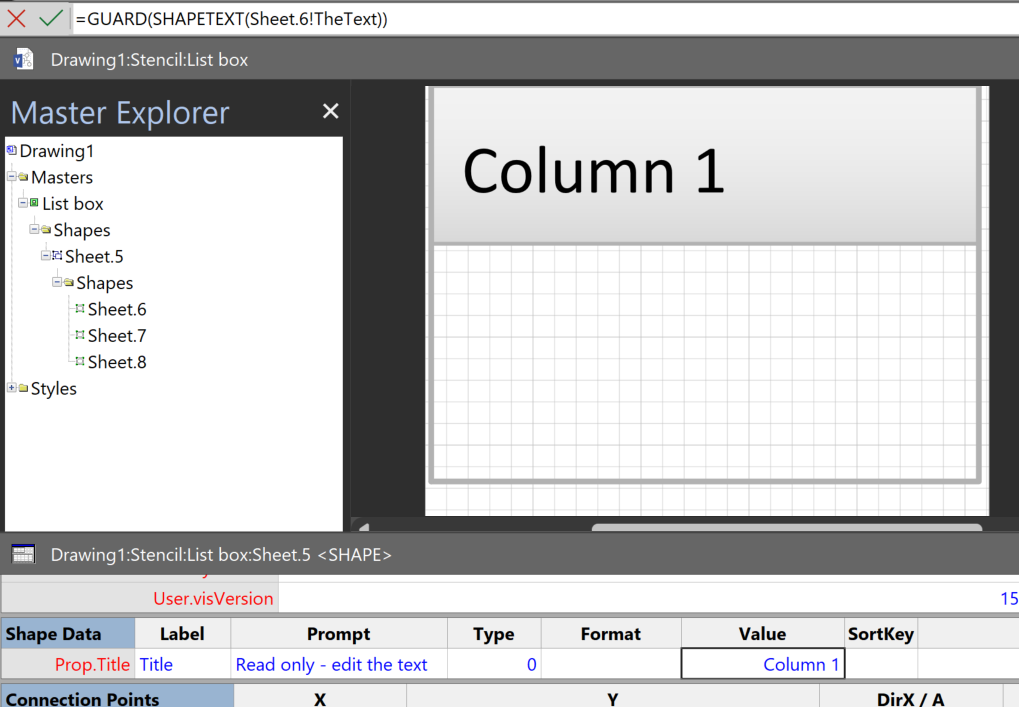
The List box master’s heading shape is Sheet.6, so the Prop.Title.Value cell formula is:
=GUARD(SHAPETEXT(Sheet.6!TheText))
Next, I edited the text of the List box item master by using Insert / Field:
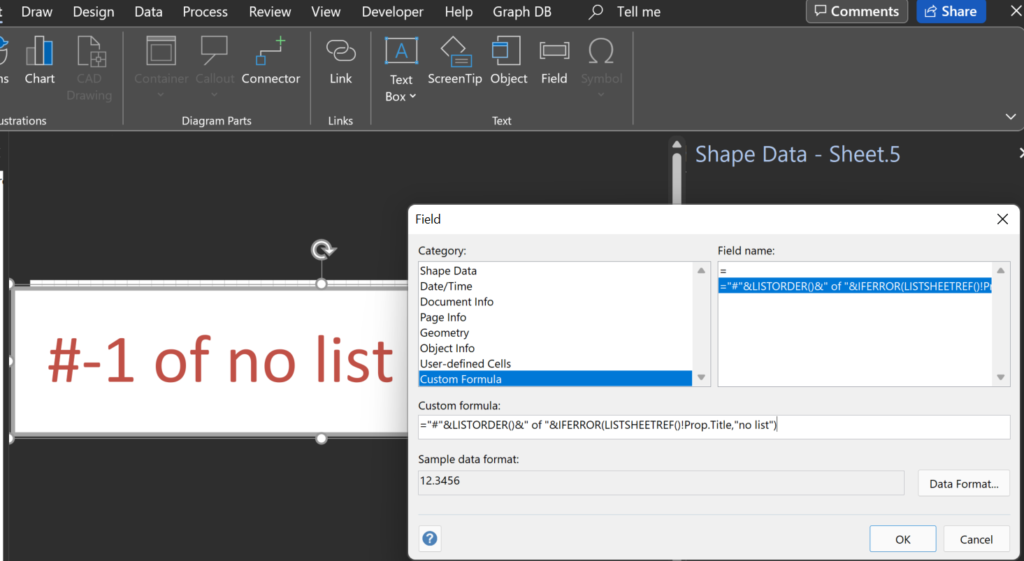
The following formula will either display the position of the item within its List container, or it will display that it is #0 of no list.
="#"&LISTORDER()&" of "&IFERROR(LISTSHEETREF()!Prop.Title,"no list")
The LISTORDER() function will return the position in the list, and LISTSHEETREF() function gets a reference to it. The ISERROR(…) function provides the fallback value if the specified cell does not exist in the referenced list container, or if there is no list container at all. The list container could also make use of the LISTMEMBERCOUNT() function if you wanted to display that.
The rectangle shape text was also edited to display the Title Shape Data of its container.
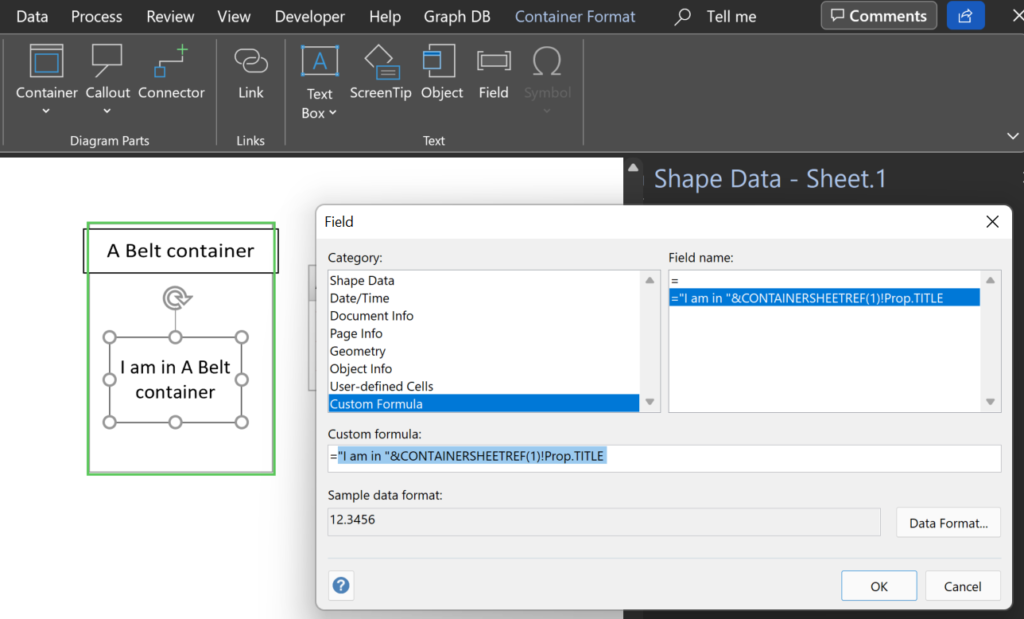
This is the simplest form of the CONTAINERSHEETREF(…) function, because it simply references the first container it is within:
"I am in "&CONTAINERSHEETREF(1)!Prop.TITLE
Of course, the CONTAINERSHEETREF(…) expression could also be enclosed within an IFERROR(…) function, to handle the case where there is no container. In addition, the CONTAINERSHEETREF(…) function has an optional second argument to filter the collection by a named shape category. There is also a CONTAINERCOUNT() function to get the total number of containers that a shape is within, and a CONTAINERMEMBERCONT() function for a container to get the number of members that it has.
Note that I had to re-drop a List box item shapes to use the new text formulas automatically.
These functions are also used extensively in Cross-Functional Flowchart diagrams, where multiple container shapes (swim-lanes) are found within a list shape. All of this functionality works in Visio for Web, so there is no excuse on making smart shapes for everyone!

Creating Boolean Context Menus in Visio
Over the many, many years that I have been creating Microsoft Visio solutions, I have had to create numerous right-mouse context menus for shapes to control their Shape Data values. Over that time, patterns emerge, so this article is highlighting three different appearances for simple Boolean values, otherwise known as True/False or Yes/No values, and…
A visual exploration of Penrose Tiling in Visio
Maybe it is because I used to be a building architect, but I have always been fascinated by the relationship between numbers and visualisations. Perhaps the most famous one is the Golden Ratio which has been used as the basis of many building designs and art pieces. It is often recognised to create a harmony…
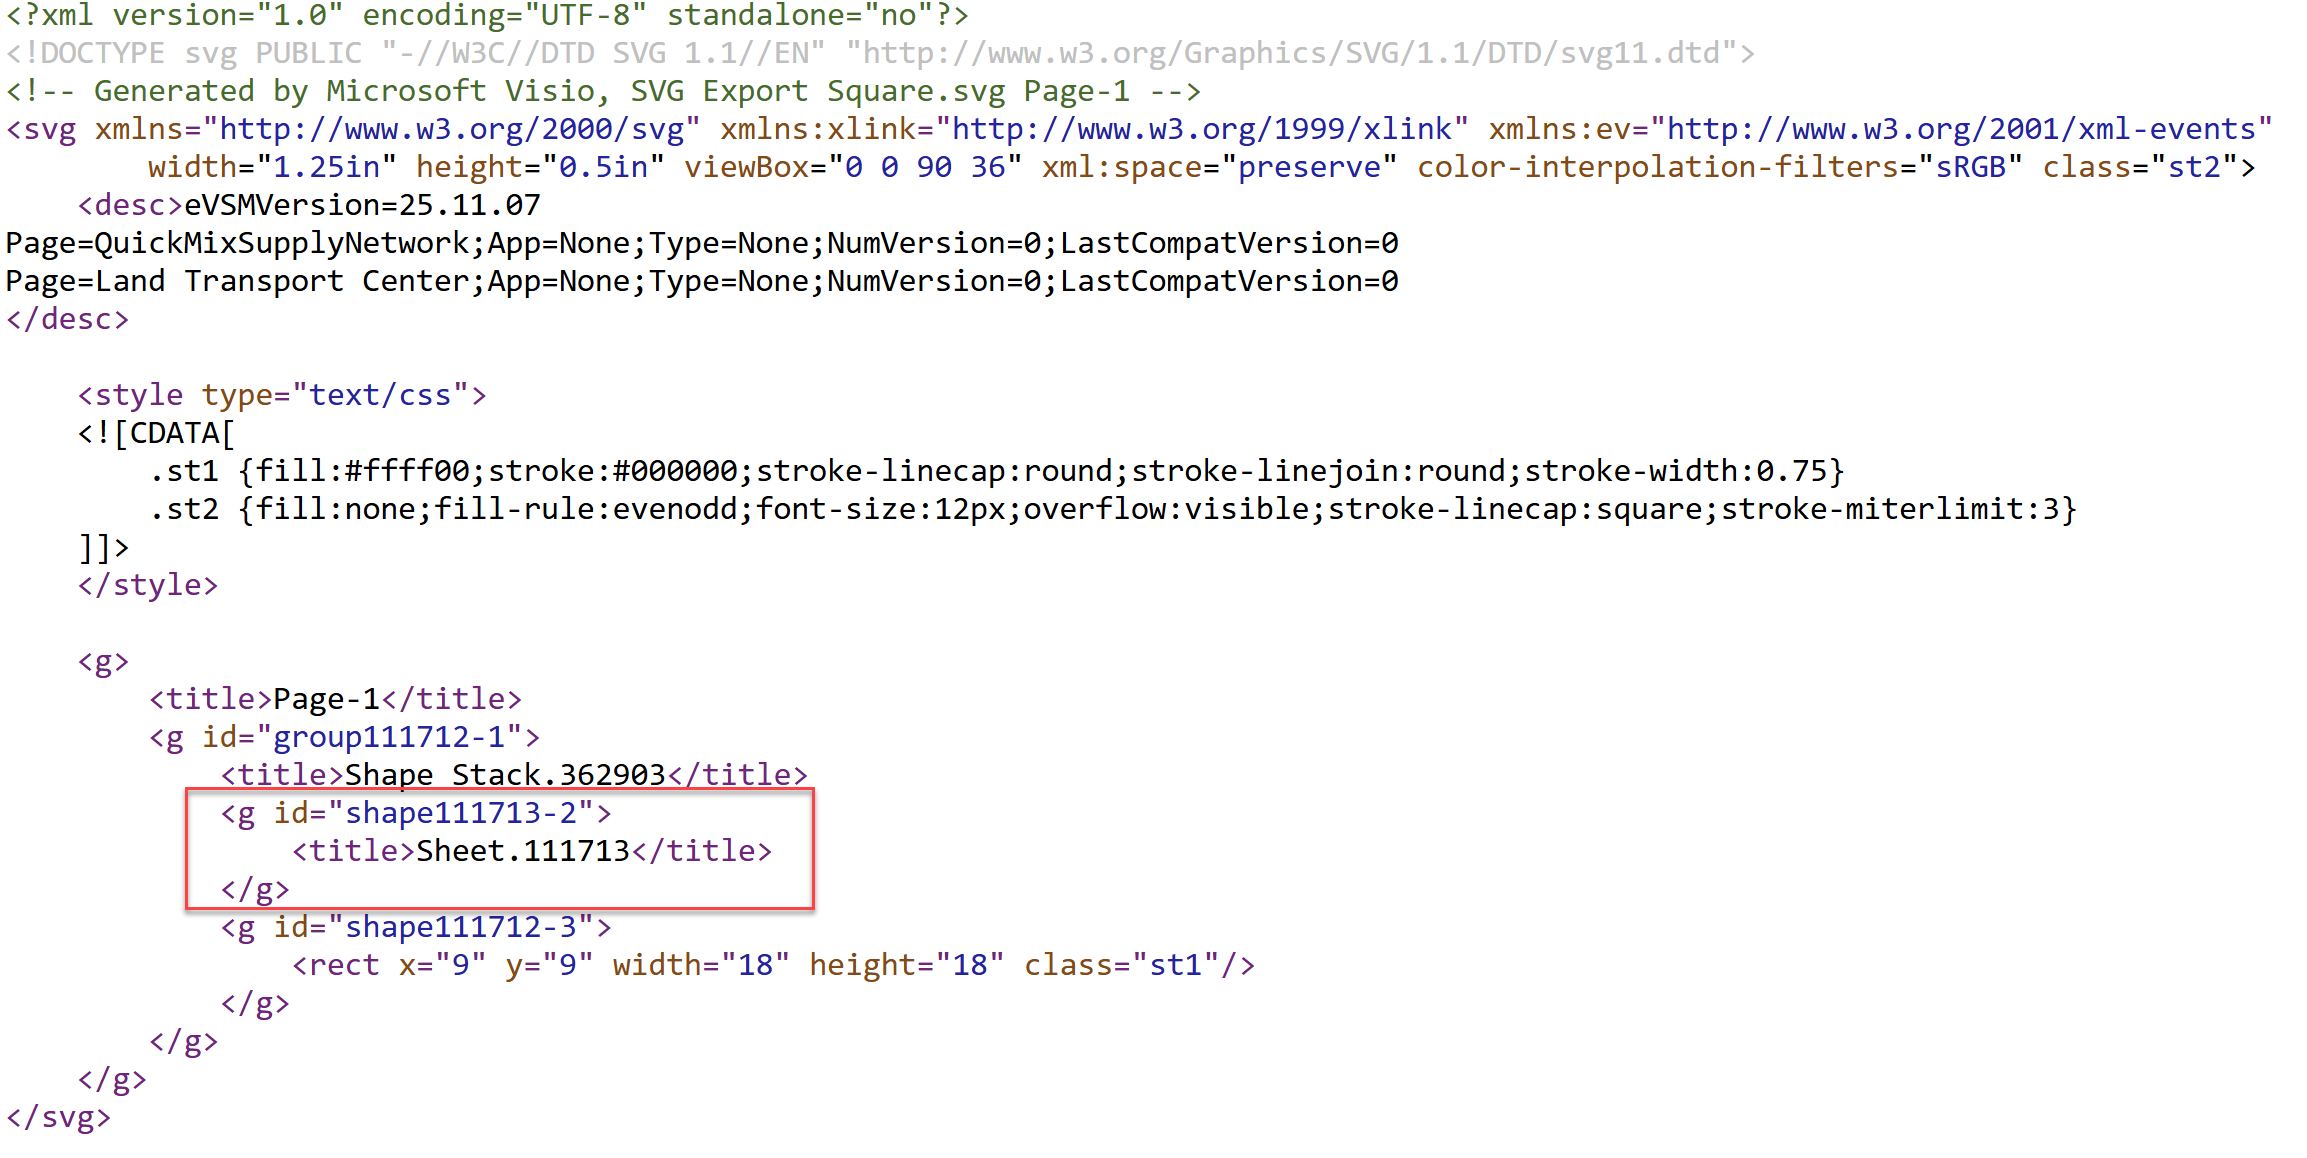
How SVG in Visio can cause a Shape.BoundingBox(…) error
I have used Visio’s Shape.BoundingBox(…) for many, many years and I cannot ever recall it failing, but I have now managed to create some shapes that cause it to error. This caused many hours of confusion, so I nearly abandoned using the method, until I discussed it with my fellow Visio MVP, John Goldsmith (see…

Jumping between Shapes in Visio
Many Visio diagrams get quite large, and sometimes it is useful to provide the ability to jump to another shape quickly in the same document, either on a different page or on the same one. Although there is an add-on provided in desktop Visio that is used by the Off-Page Reference shape provided in the…
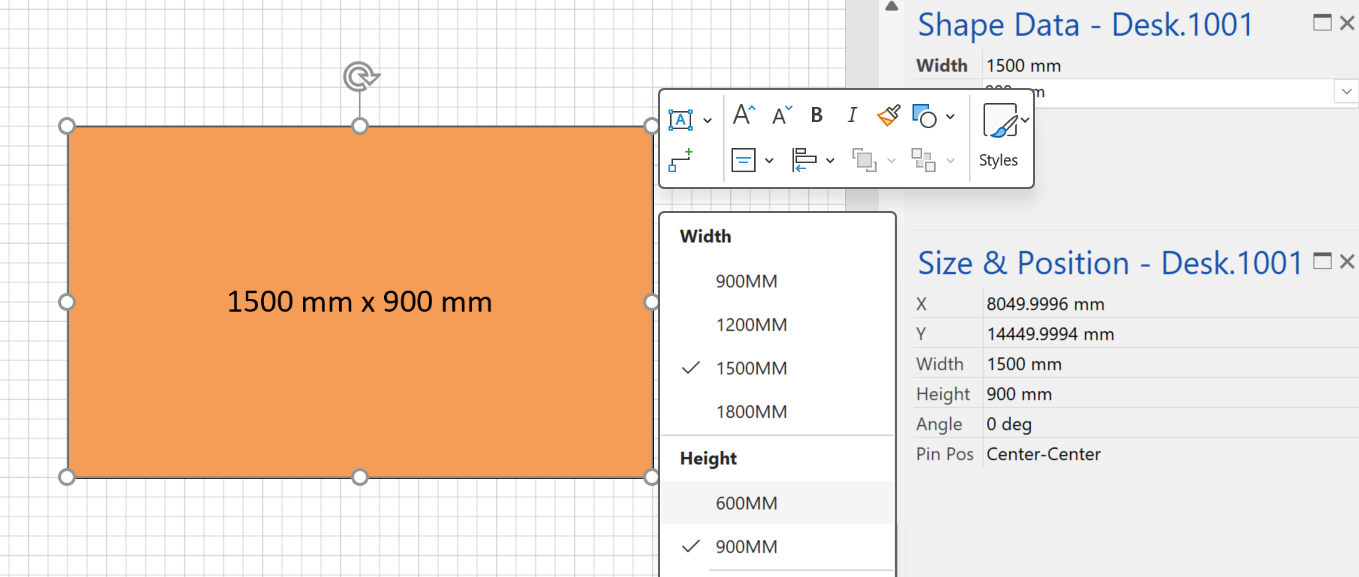
Fixing dimensions of 2D shapes
I am often asked what makes Visio unique and makes it stand out from the crowd, especially in today’s online world. Well, I think there are many reasons, but one of them is the ability to create scaled drawings with parametric components of specific dimensions. This was crucial for my adoption of Visio back in…
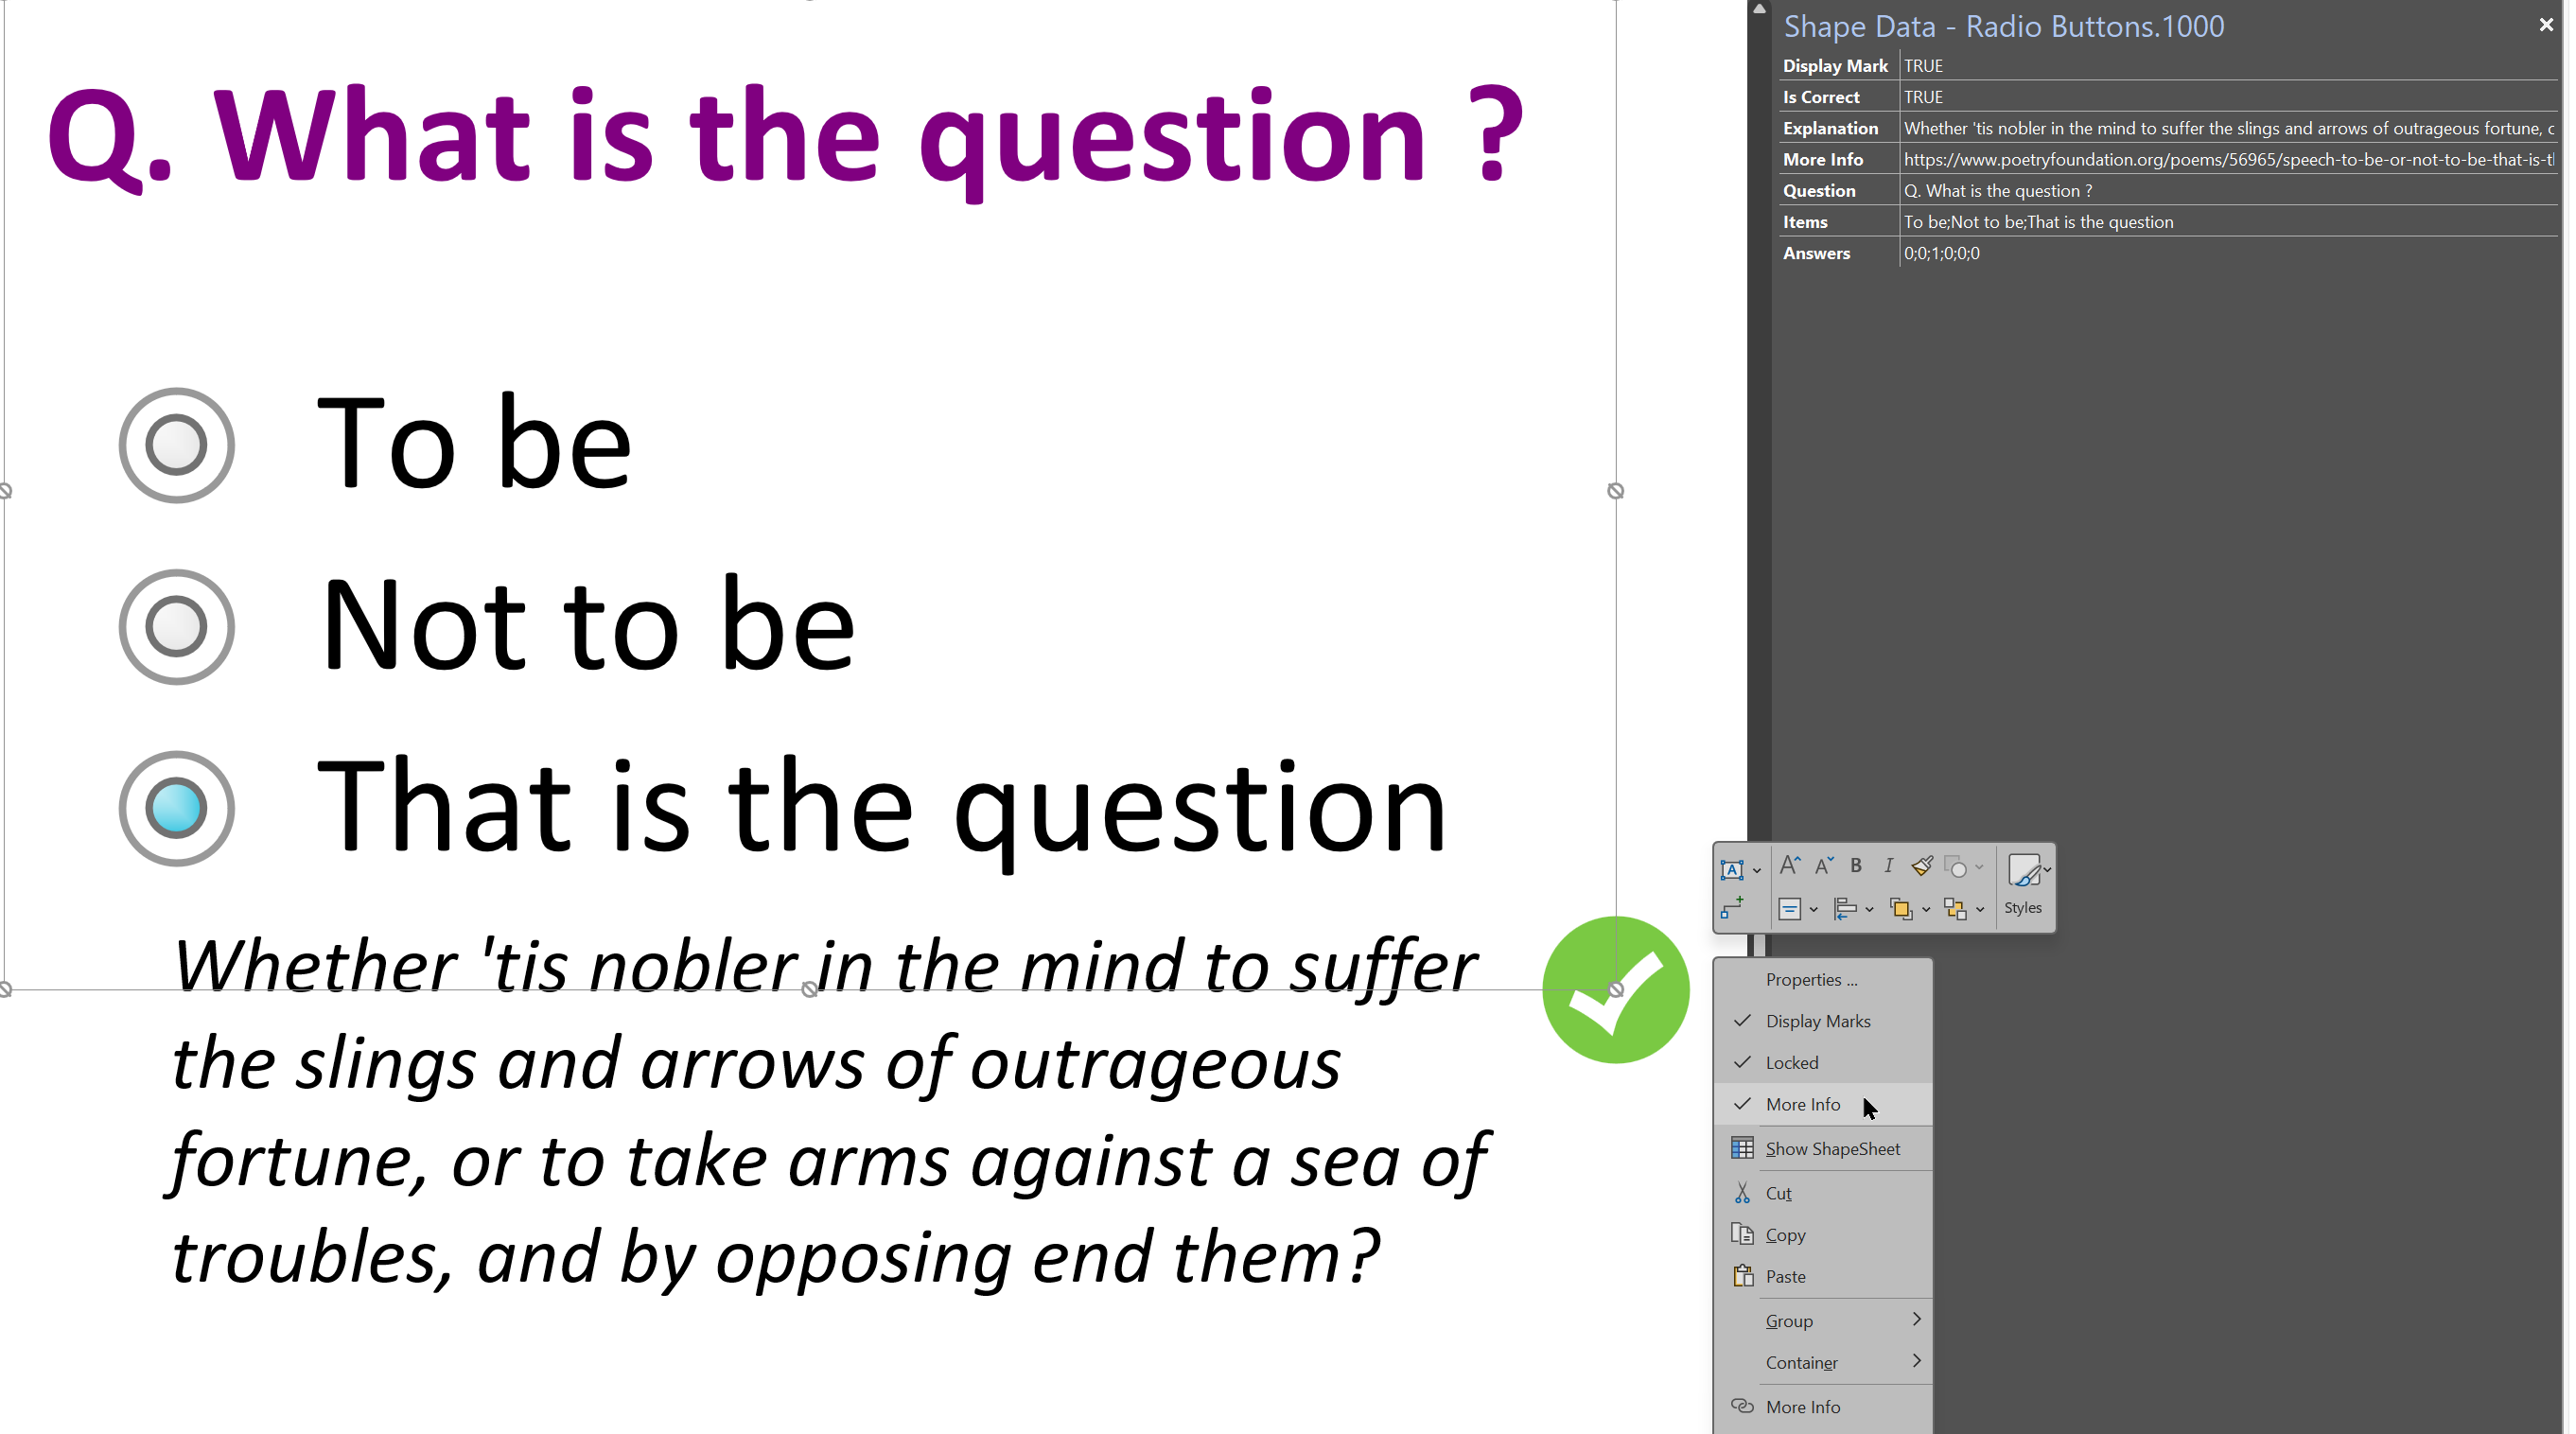
Smart Radio Buttons and Check Boxes in Visio
A recent project requires an interactive tutorial within Microsoft Visio desktop where a lot of the questions need a single answer using radio buttons, or multiple-choice answers using check boxes. I thought that this would be a great use of the list containers capability because the questions and answers could be part of the container…
Hi David,
please, if you can, tell me what book or tutorial I should buy to learn how to make a business process simulation in Microsoft Visio. After I map the processes and highlight the cost and time elements in Shape Data, I need Visio to automatically calculate the costs, times and other characteristics of a process from Start to End.
Thanks
Calculation from Start to End depends upon the route taken through the process. You can build in many types of calculation into Shape Data, but are you trying to calculate all of the different options?
Hi David,
I have tried to find a solution to have a page with 5 text boxes that then auto update the 5 text boxes of 25 pages, I have tried the solution – (Displaying Text from one Visio Shape in Another)
It also sometimes works on all sides, but sometimes it fails on some of the pages.
Could the above video be used with some fixes to update text boxes over 25 pages –
(Synchronizing Visio Shape Fill Color (or almost any cell) across pages)
Or du you have at better solution ?
Thanks
/Jan E Jensen
I often have data stored in the DocumentSheet User-defined Cells or Shape Data rows. These values can be accessed by Master shapes and Page shapes whereever they are.
Mostly I update the values in the DocumentSheet from code, but sometimes use the SETATREF(…) function from shape Shape Data rows to provide a UI.