I was going to title this “When is a truth not a truth?” because I have found that Visio can sometimes refuse to apparently update the displayed value in a cell, even though it has been changed. However, this was, in this instance, down to a misunderstanding of the formula evaluation events on my part. Take the scenario where you have some data that you want to be available to all pages and all shapes in the Visio document. There are some built-in Document Properties in Visio that are accessible to all pages and shapes using ShapeSheet functions ( eg TITLE(), SUBJECT(), COMPANY(), Categories / CATEGORY(), Tags / KEYWORDS(), Comments / DESCRIPTION(), Author / CREATOR(), MANAGER() and HYPERLINKBASE()). However, Visio does not have custom Document Properties like the other Office applications. Instead, Visio allows for the addition of User-Defined Cells and Shape Data rows in the DocumentSheet of the document. These can be uniquely named, and Shape Data rows can be given a data type (of sorts), a label, prompt and format.
These values can be accessed via a ShapeSheet function from anywhere within the document, which ensures that you only have one version of the truth. However, there is no non-developer user-interface to edit these DocumentSheet Shape Data values in Visio, so what do you do? And how can you be sure that you are always seeing these centralised values correctly?
I created the following master shape to test how this can be done. It is a group shape that contains a single StartDate Shape Data row, which is used to edit or view the date in the similarly named Shape Data row in the DocumentSheet. For good measure, I also added a similarly named Shape Data row to the page, so the Shape Data window in the page could also be used. I then used Insert / Field to display the values in the ShapeSheet, PageSheet and DocumentSheet:
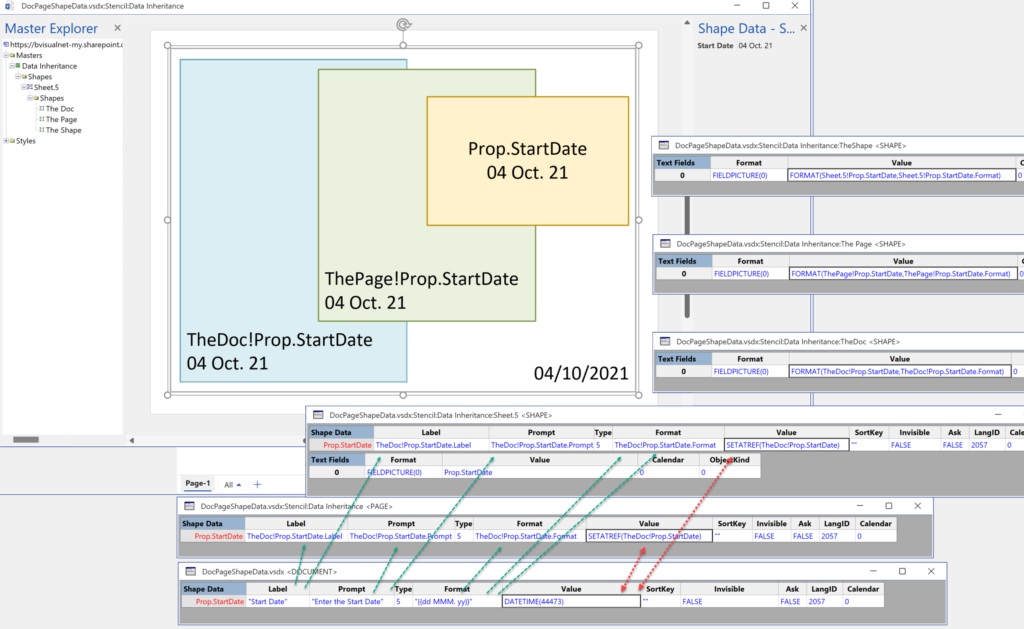
The easiest way to provide a user-interface to the Shape Data rows of the DocumentSheet is to create a shape that contains the same rows, but the Label, Prompt, Type, Format, etc gets the values from the same cells in the DocumentSheet by using the TheDoc! prefix, eg:
=TheDoc!Prop.ShapeData.Label
This is not suitable for the Value cell because the user needs to edit this in the UI, and all other references to the value need to get the latest value.
Date fails to display correctly
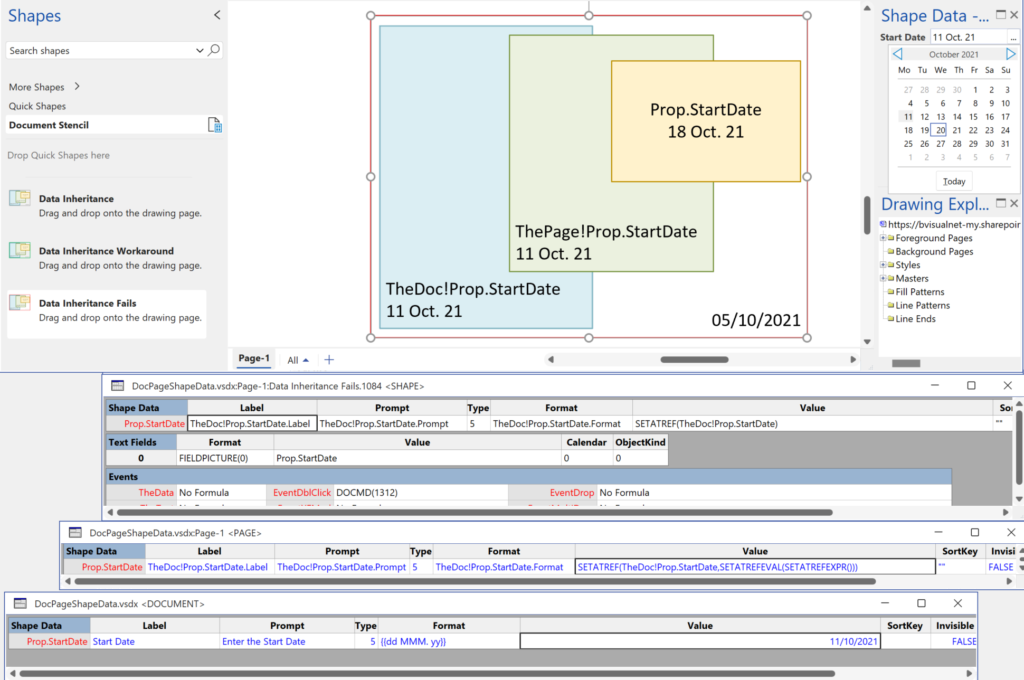
Initially, I merely used the SETATREF(…) function in the Value cell of the Prop.StartDate row of the master shape.
=SETATREF(TheDoc!Prop.StartDate)
This function will push the value to the target cell, in this case the Prop.StartDate.Value cell in the DocumentSheet. However, I soon noticed that displayed values from the ShapeSheets and the PageSheet did not always show the value correctly. Indeed, the shape is selected in the following screenshot, and the Shape Data window shows that the value is the 11 Oct. 21, but the group shape display 5/10/2021 (UK short date format), and the sub-shape displays 18 Oct. 21! If I move the shape, then the sub-shape display automatically updates to show the correct date.
So, there has to be a way of ensuring that the correct values are displayed. I found two, one is probably the official way, and the other is my workaround.
The Official Way
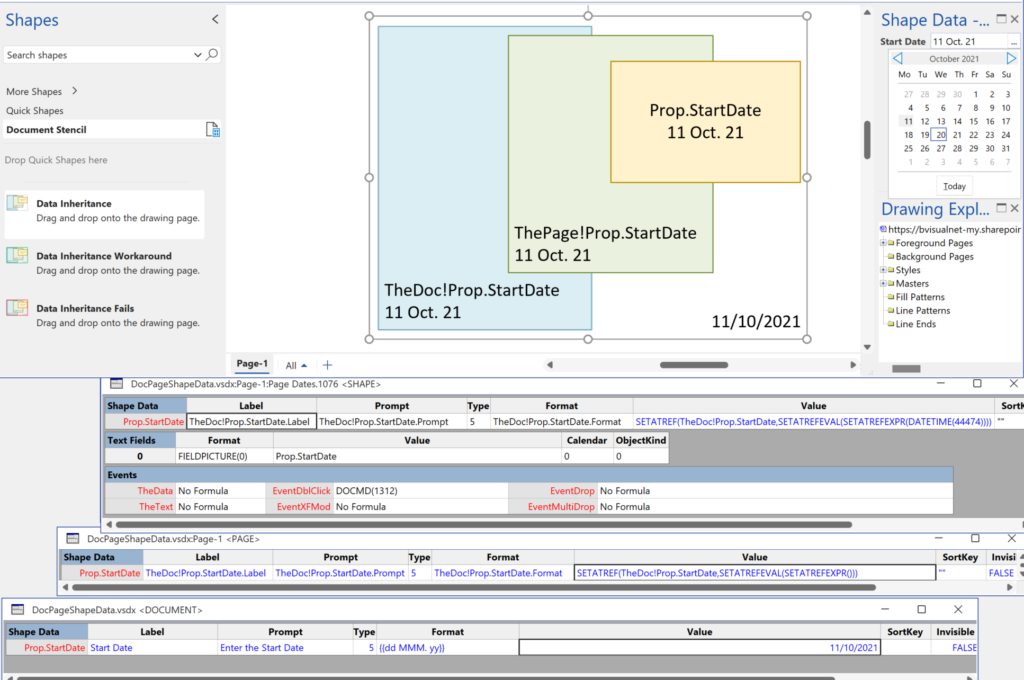
The official way, if you study the SETATREF(…) function guide, is to use SETATREFEVAL(…) and SETATREFEXPR(…) functions the second argument. This forces the cell to be evaluated before assigning the value to the target cell, so the formula becomes:
=SETATREF(TheDoc!Prop.StartDate,SETATREFEVAL(SETATREFEXPR()))
However, this does force the value to become local, as can be seen by the blue colour of the formula in the Prop.StartDate.Value cell in the following screenshot:
The Workaround
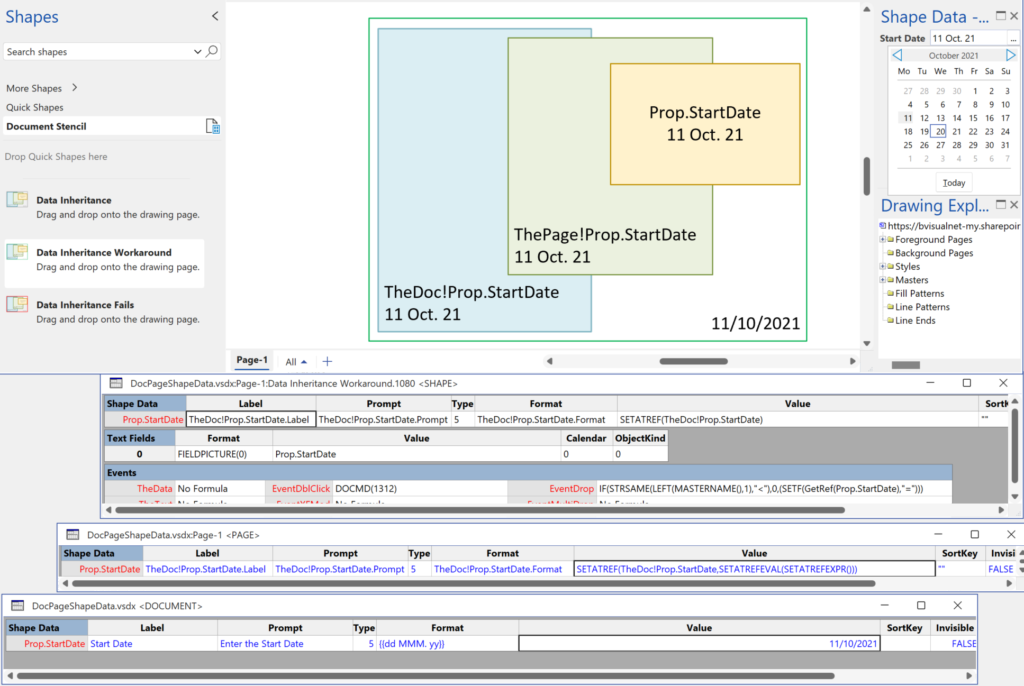
Another option, which I have used, is to force the cell to re-inherit the formula from the master when it is dropped onto the page. This can be achieved with the following formula in the EventDrop cell:
=IF(STRSAME(LEFT(MASTERNAME(),1),"<"),0,SETF(GetRef(Prop.StartDate),"="))
The purpose of the IF() part is to only act when the shape is dropped on the page, not when the master edit window is open, otherwise pushing the “=” formula into the Prop.StartDate.Value cell will force it to re-inherit from the master shape cell. (Note that the .Value cell is the default, so it does not need to be specified).
Notice that the Value cell is still black, which means that it is inherited from the master shape cell:
Post script
I still feel that it is wrong for Visio to not update the display to match the actual value in a cell, and especially as the documentation says that SETATREF(…) does support the Shape Data rows.

Creating Boolean Context Menus in Visio
Over the many, many years that I have been creating Microsoft Visio solutions, I have had to create numerous right-mouse context menus for shapes to control their Shape Data values. Over that time, patterns emerge, so this article is highlighting three different appearances for simple Boolean values, otherwise known as True/False or Yes/No values, and…
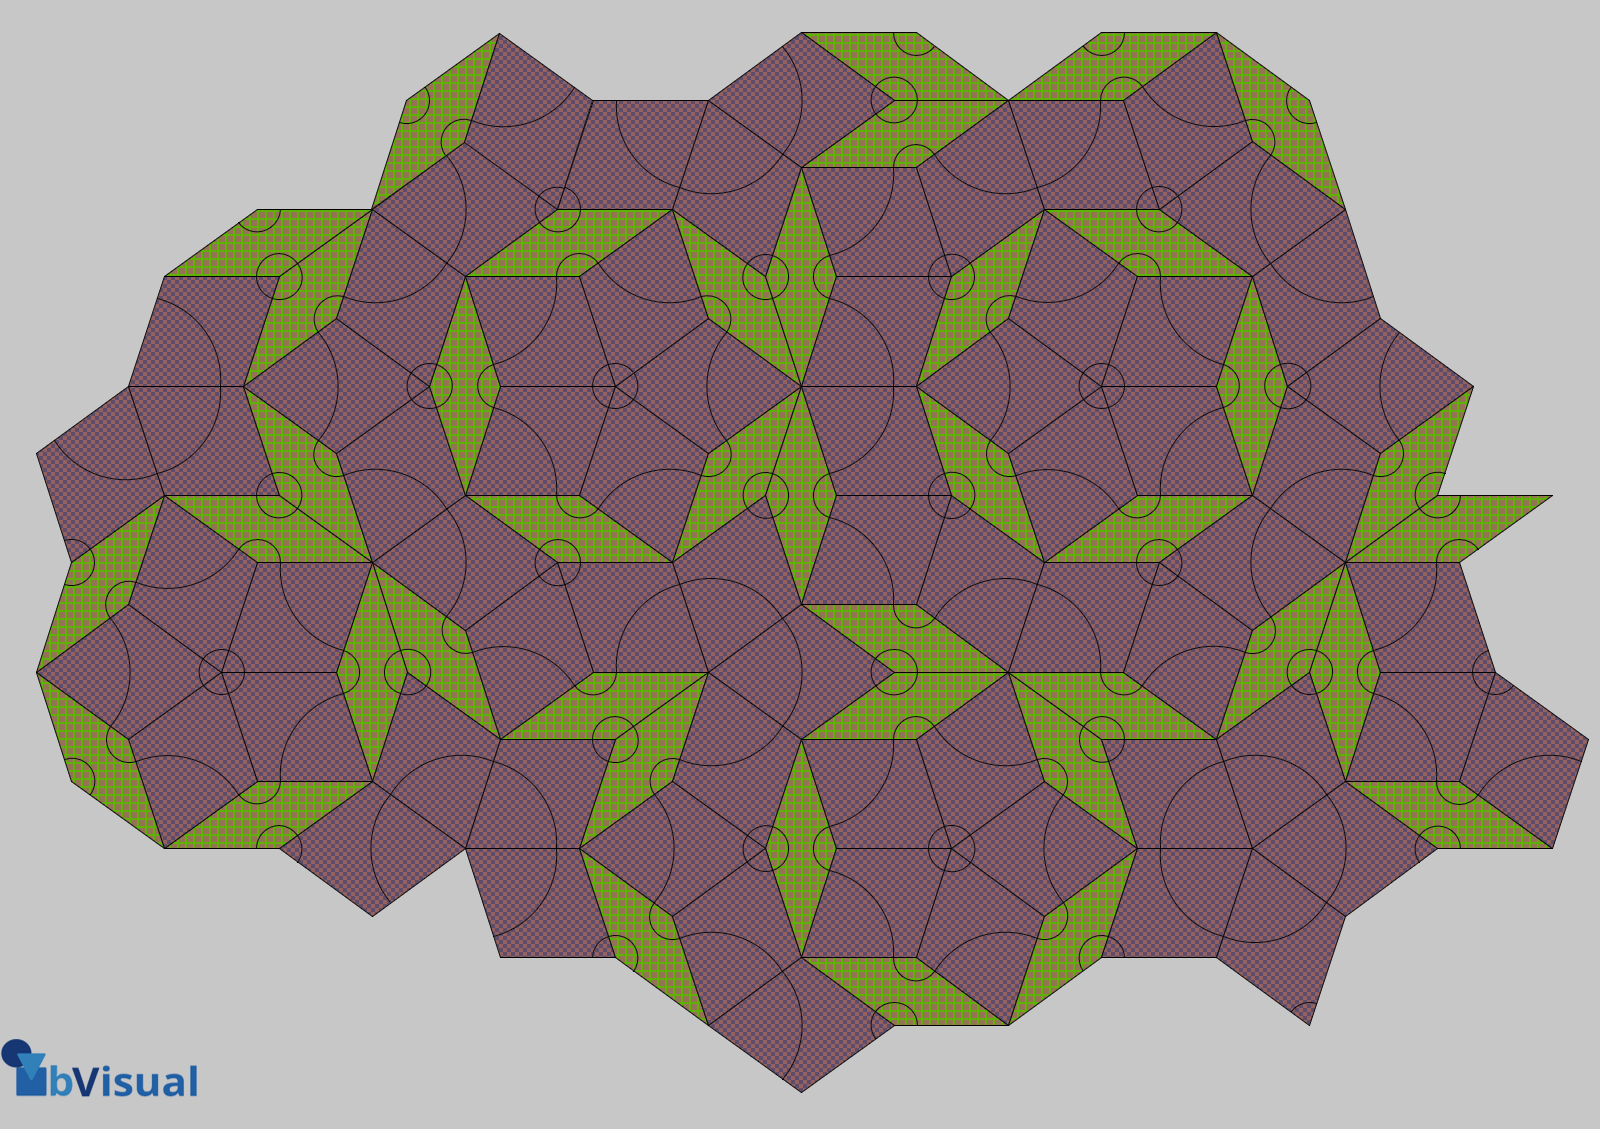
A visual exploration of Penrose Tiling in Visio
Maybe it is because I used to be a building architect, but I have always been fascinated by the relationship between numbers and visualisations. Perhaps the most famous one is the Golden Ratio which has been used as the basis of many building designs and art pieces. It is often recognised to create a harmony…
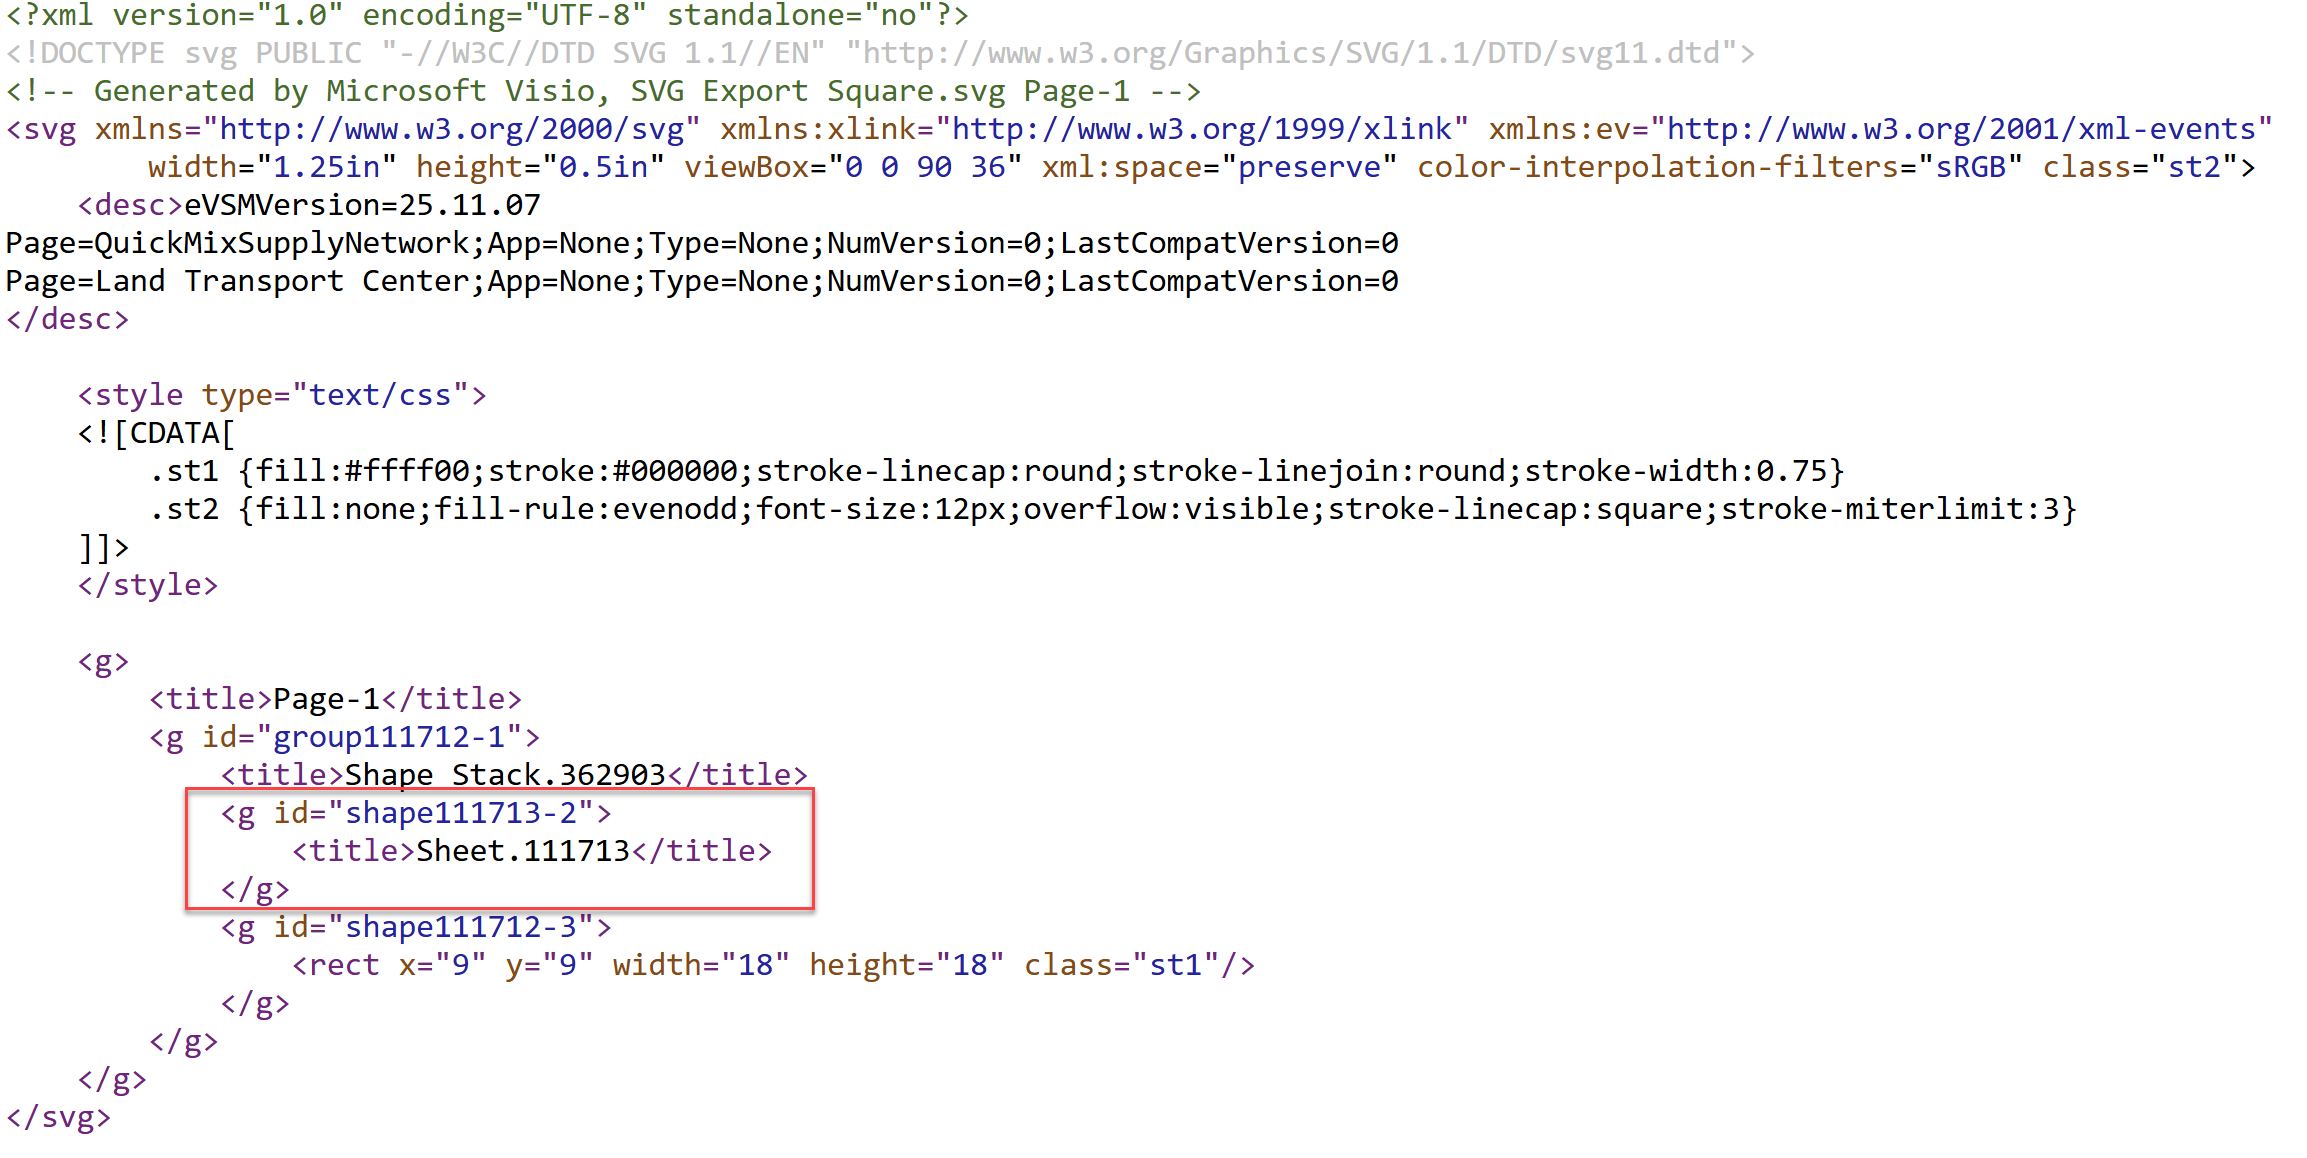
How SVG in Visio can cause a Shape.BoundingBox(…) error
I have used Visio’s Shape.BoundingBox(…) for many, many years and I cannot ever recall it failing, but I have now managed to create some shapes that cause it to error. This caused many hours of confusion, so I nearly abandoned using the method, until I discussed it with my fellow Visio MVP, John Goldsmith (see…

Jumping between Shapes in Visio
Many Visio diagrams get quite large, and sometimes it is useful to provide the ability to jump to another shape quickly in the same document, either on a different page or on the same one. Although there is an add-on provided in desktop Visio that is used by the Off-Page Reference shape provided in the…
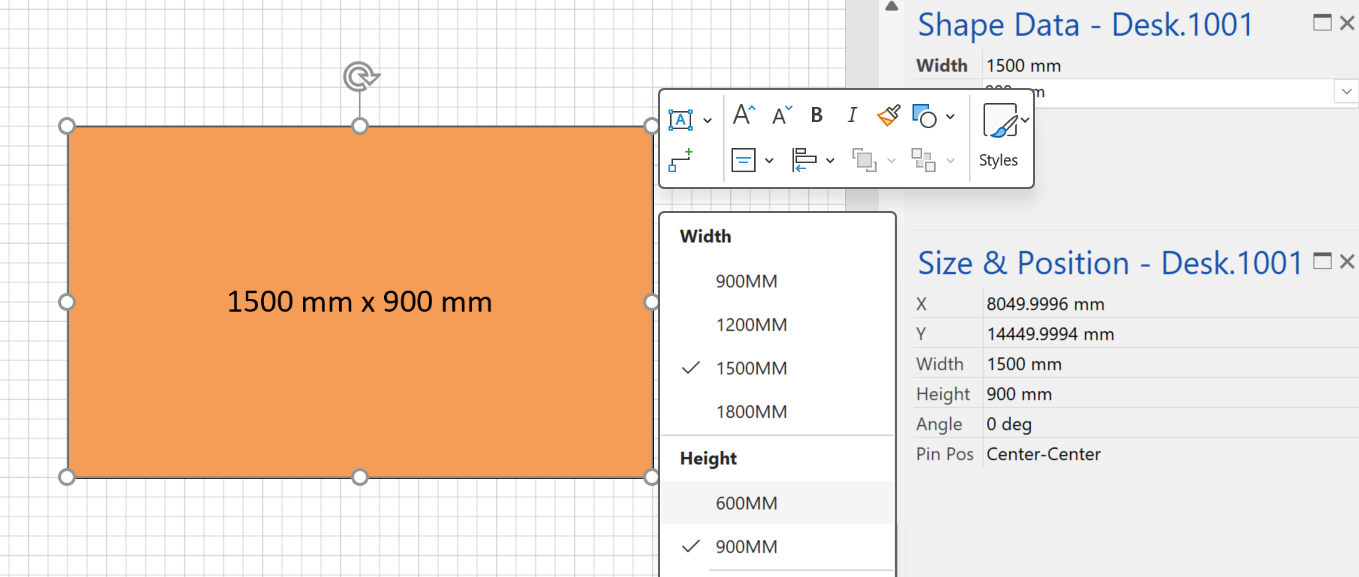
Fixing dimensions of 2D shapes
I am often asked what makes Visio unique and makes it stand out from the crowd, especially in today’s online world. Well, I think there are many reasons, but one of them is the ability to create scaled drawings with parametric components of specific dimensions. This was crucial for my adoption of Visio back in…
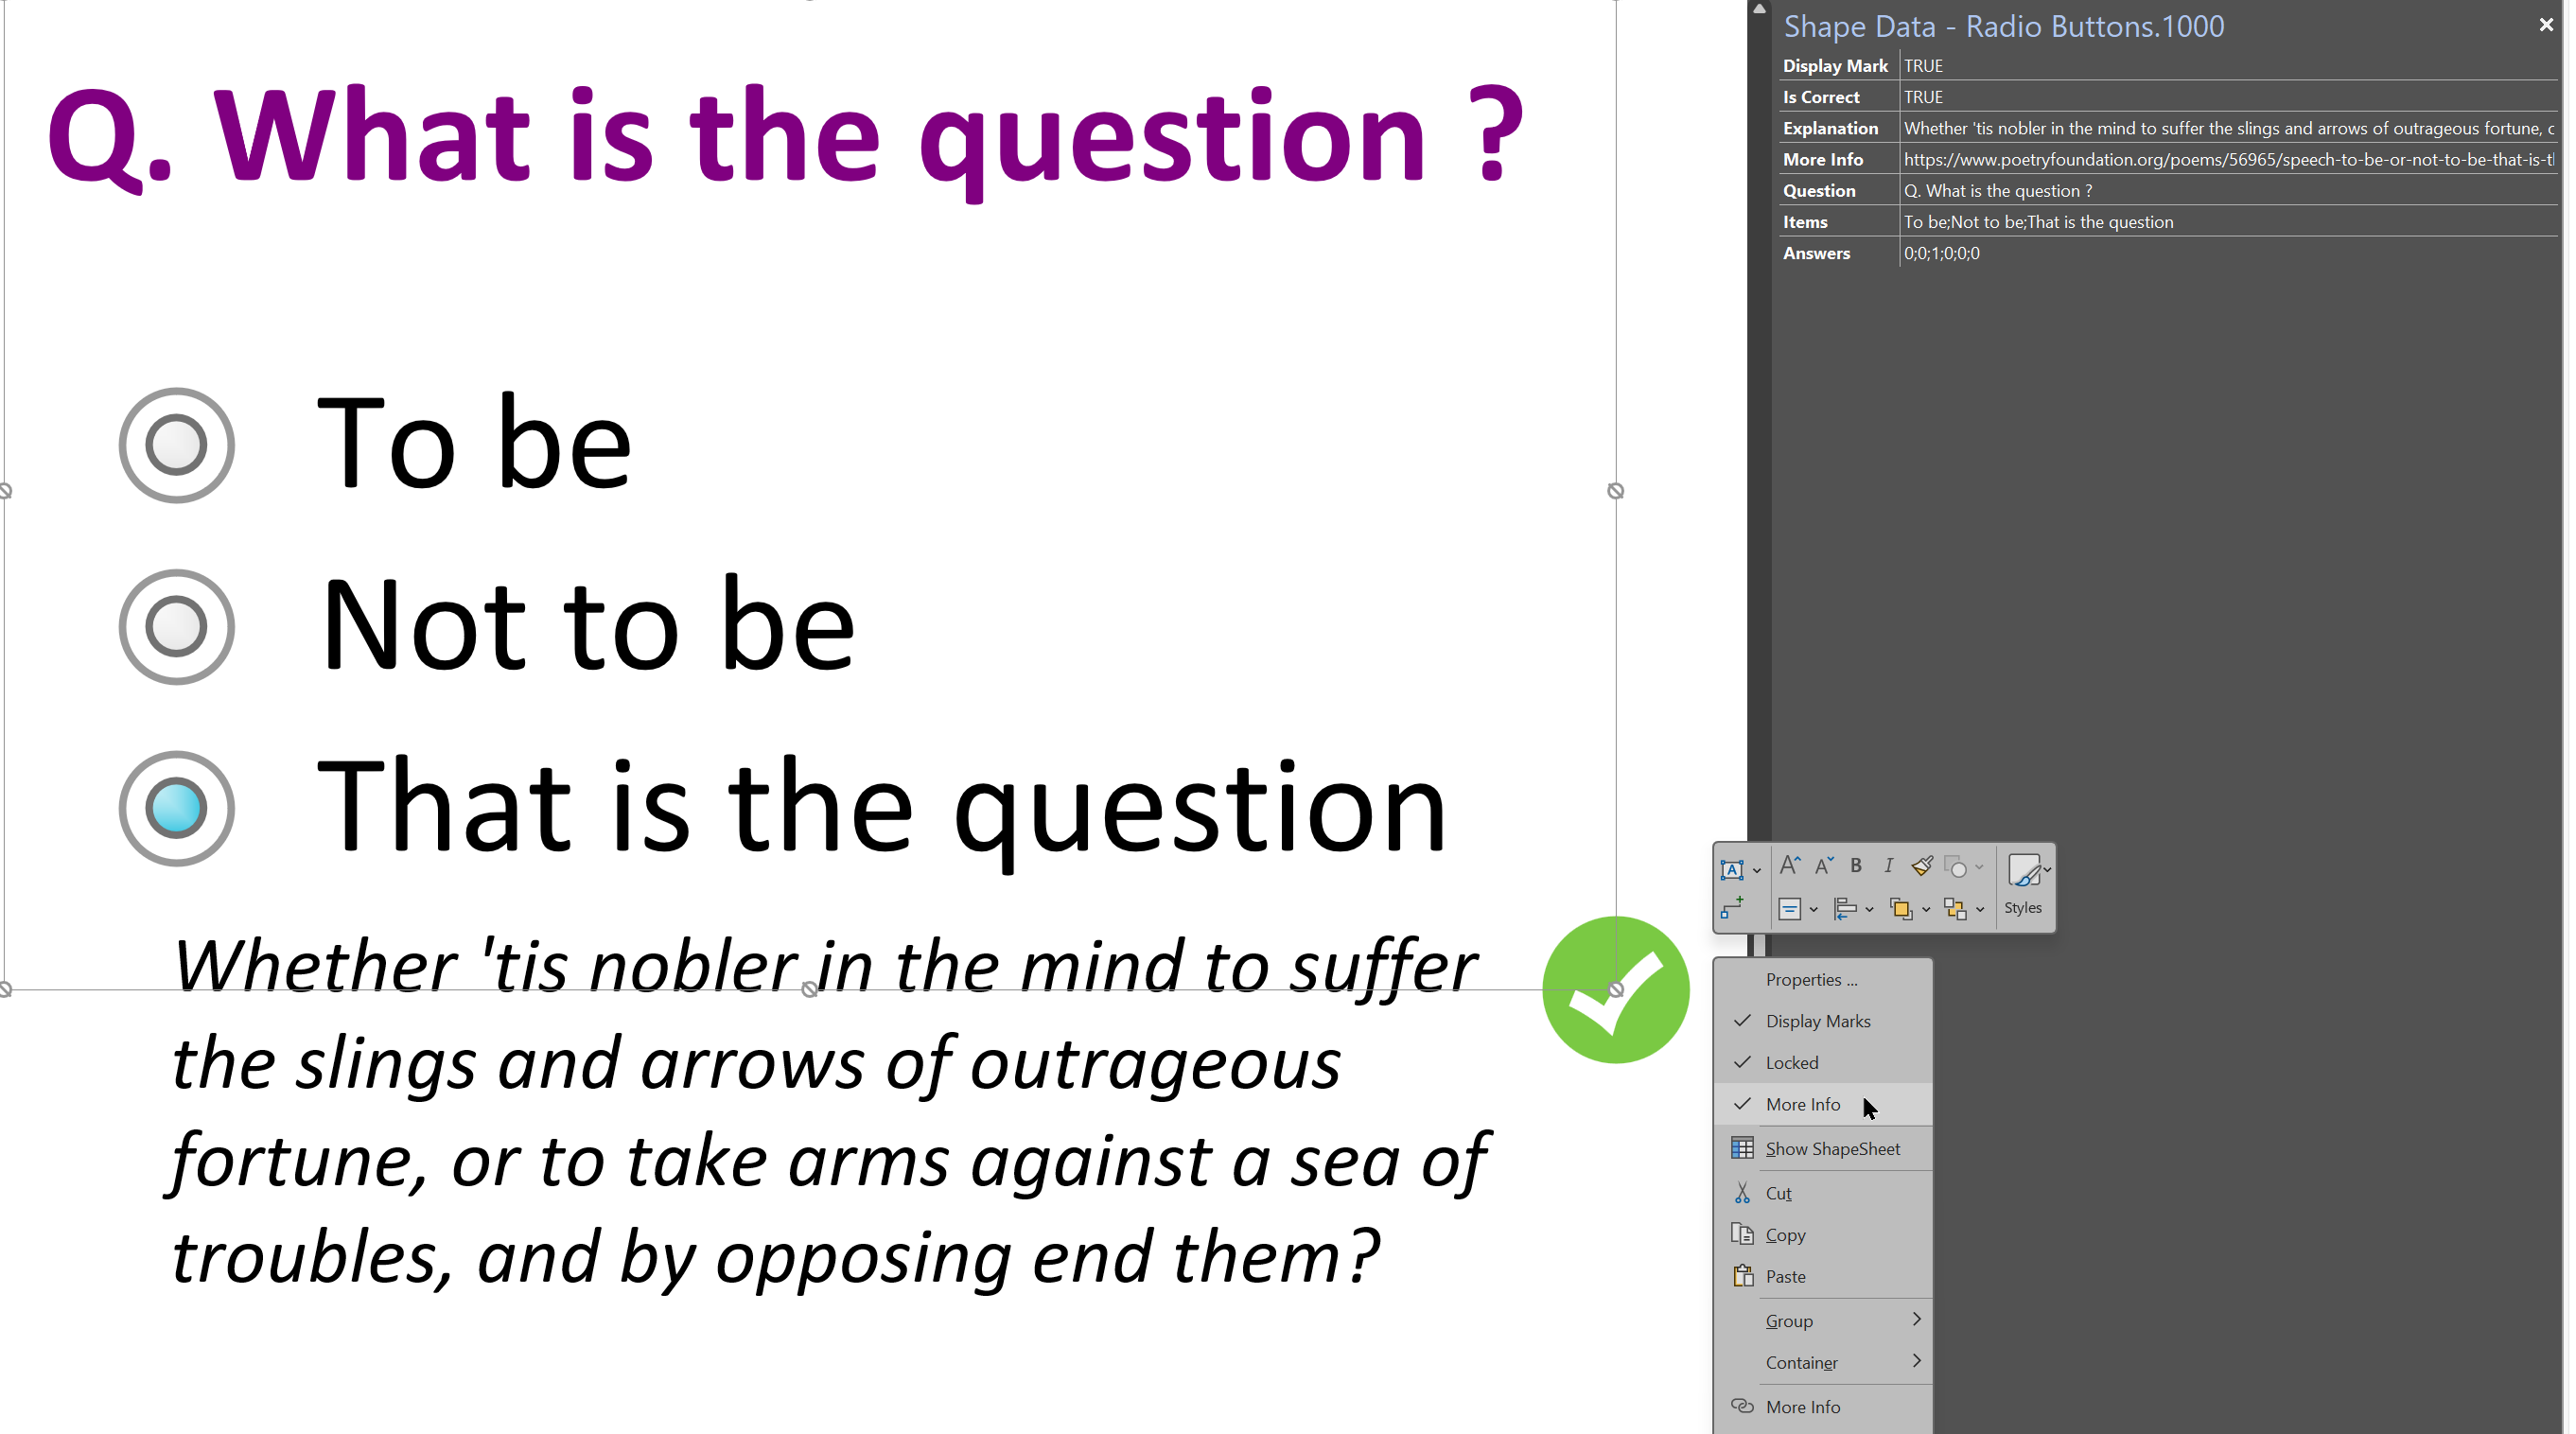
Smart Radio Buttons and Check Boxes in Visio
A recent project requires an interactive tutorial within Microsoft Visio desktop where a lot of the questions need a single answer using radio buttons, or multiple-choice answers using check boxes. I thought that this would be a great use of the list containers capability because the questions and answers could be part of the container…
Leave a Reply
You must be logged in to post a comment.