• Skip to main content
  • Skip to primary sidebar
  • Skip to footer

bVisual

  • Home
  • Services
    • How Visio smartness can help your business
    • Visio visual in Power BI
    • Visio Consulting Services
    • Visio Bureau Services
    • Visio Training and Support Services
  • Products
    • Visio Shape Report Converter
    • SS Plus
    • LayerManager
    • visViewer
    • Metro Icons
    • Rules Tools for Visio
    • The Visio 2010 Sessions App
    • Multi-Language Text for Visio
    • Document Imager for Visio
    • multiSelect for Visio
    • pdSelect for Visio
  • Case Studies
    • Case studies overview
    • Using Visio in Education for GIS
    • Visualizing Construction Project Schedules
    • Visio Online Business Process Mapping
    • Nexans Visio Template
    • CNEE Projects, WorldCom
    • Chase Manhattan Bank
  • News
    • Recent news
    • News archive
  • Resources
    • Articles➡
      • ShapeSheet Functions A-Z
      • Comparing Visio for the Web and Desktop
      • Customising Visio Shapes for the Web App
      • Key differences between the Visio desktop and web apps
      • Using the Visio Data Visualizer in Excel
      • Using Visio in Teams
      • Creating Visio Tabs and Apps for Teams with SharePoint Framework (SPFx)
      • Designing Power Automate Flows with Microsoft Visio
      • Innovative uses of Visio Lists
    • Webcasts ➡
      • Visio in Organizations
      • My session and other Visio sessions at MSIgnite 2019
      • Power up your Visio diagrams
      • Vision up your Visio diagrams
      • The Visio 2010 MVP Sessions
    • Visio Web Learning Resources
    • Books➡
      • Visualize Complex Processes with Microsoft Visio
      • Mastering Data Visualization with Microsoft Visio
      • Microsoft Visio Business Process Diagramming and Validation
      • Visualizing Information with Microsoft Visio
  • Blog
    • Browse blog articles
    • Visio Power BI articles
    • Visio for Web articles
    • A history of messaging and encryption
  • About us
    • About bVisual
    • Testimonials
    • Bio of David Parker
    • Contact Us
    • Website Privacy Policy
    • Website terms and conditions
    • Ariba Network
You are here: Home / Visio / Visio 2016 / Visio in PowerBI for viewing personnel hierarchies and locations

Published on January 4, 2018 by David Parker

Visio in PowerBI for viewing personnel hierarchies and locations

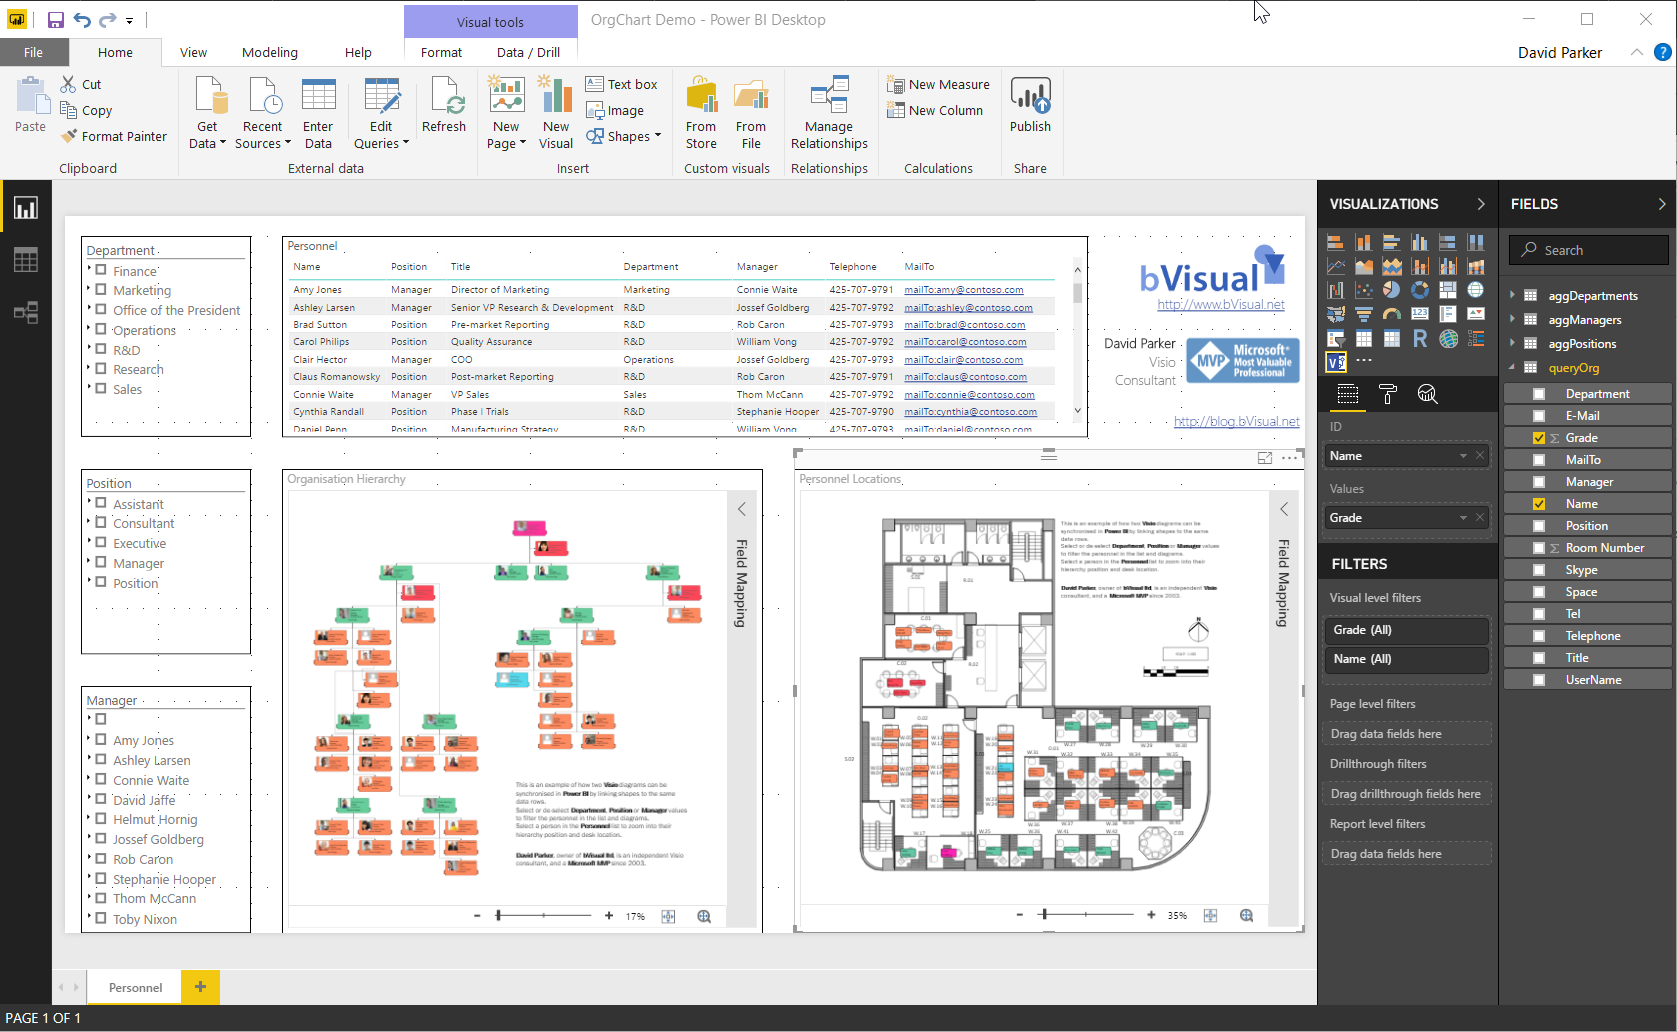
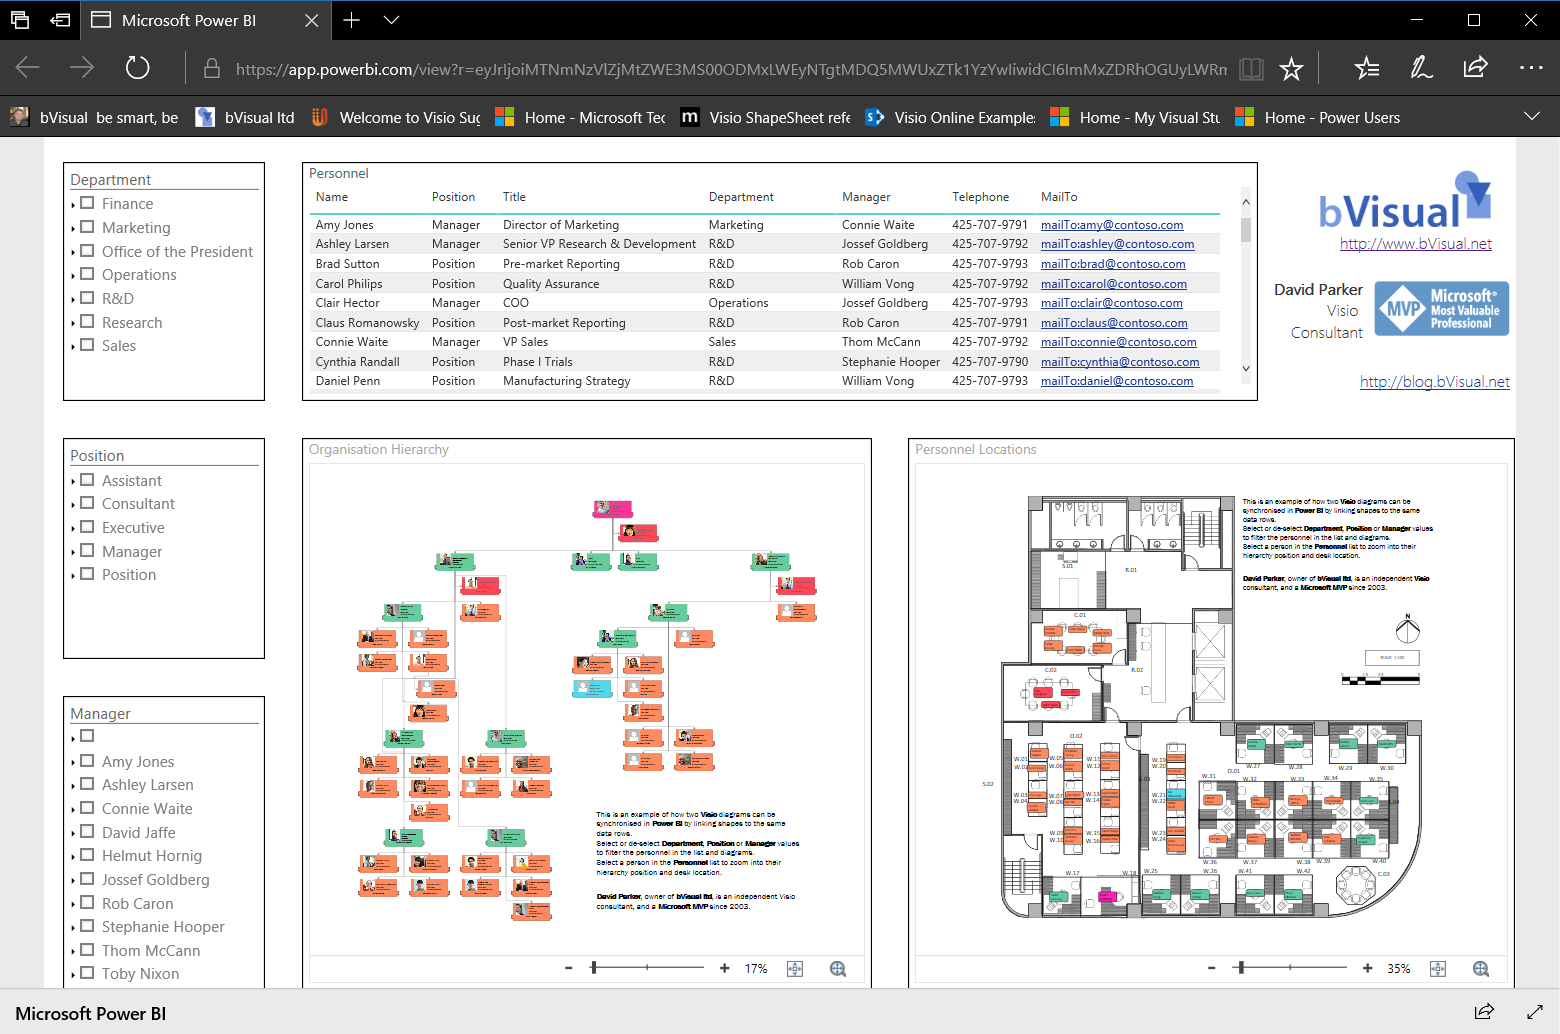
My last article, Aliasing Data Columns for #Visio Organization Chart Wizard , mentioned the slight anomalies in the default Shape Data rows for the Organization Chart shapes and the Resources / Person shape. This prompted me to create an alternative view of the same data that can be linked to the Person shapes on a floor plan, and then to use the preview Visio Custom Visual in Power BI to display both views of personnel synchronised by the same data. This demonstrates how easy it is to create an effective dashboard for locating personnel locations and their position within an organisational hierarchy at the same time!

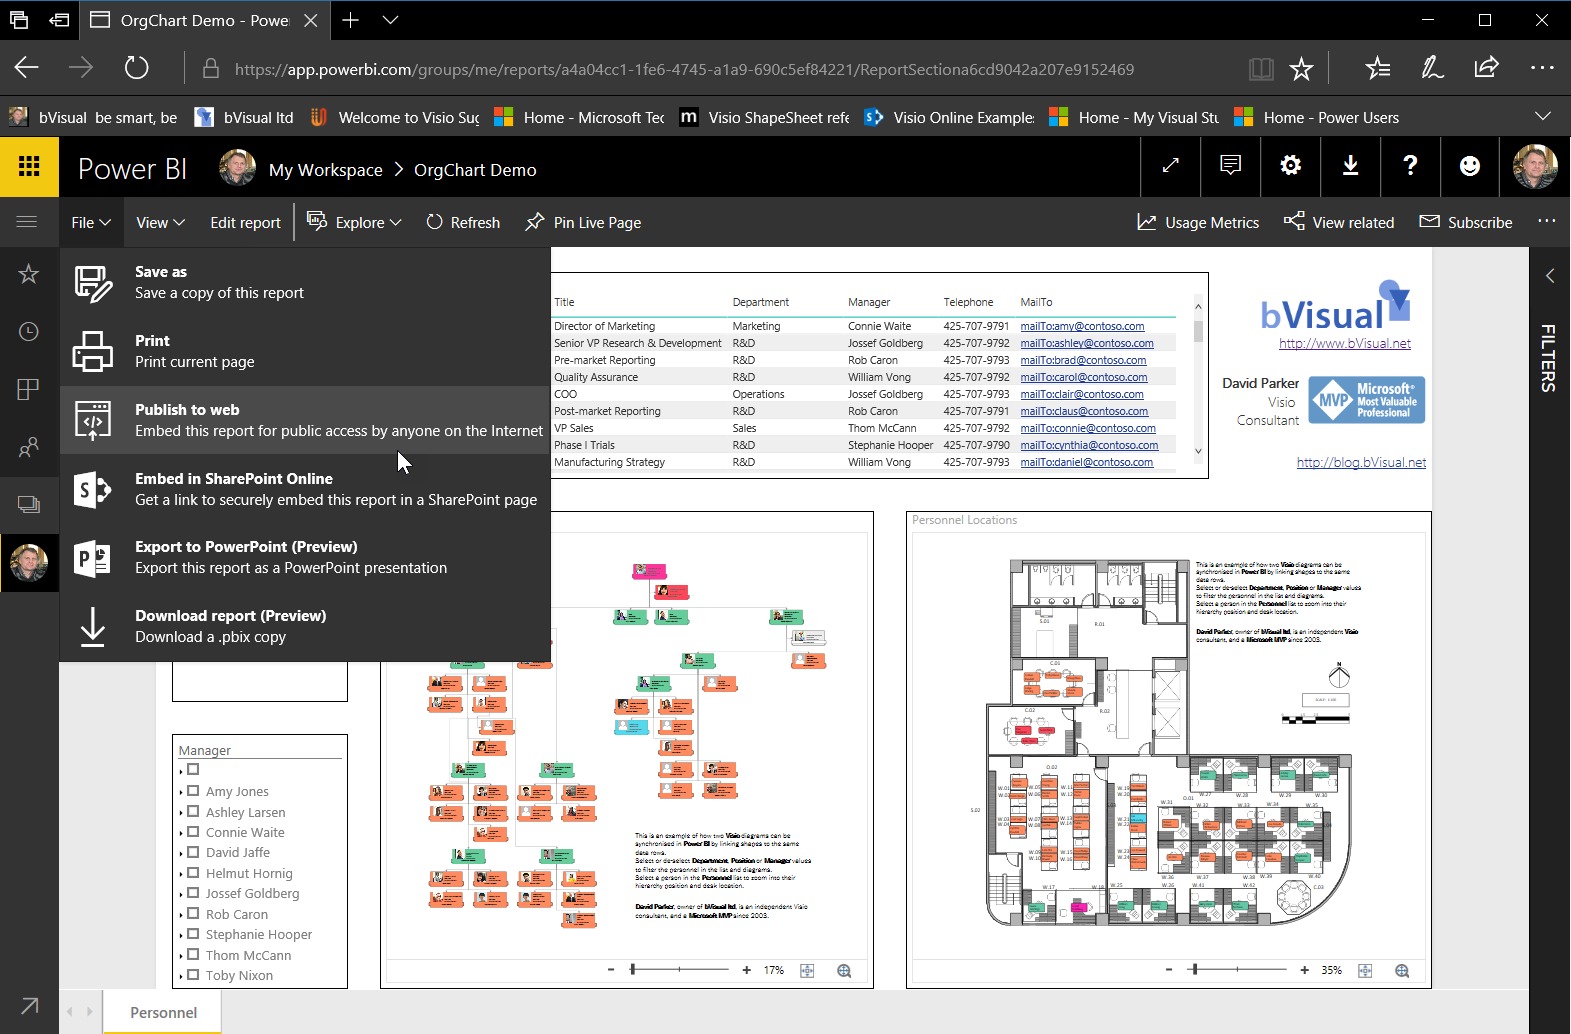
View the Power BI report online : Org Chart and Personnel Locations in PowerBI
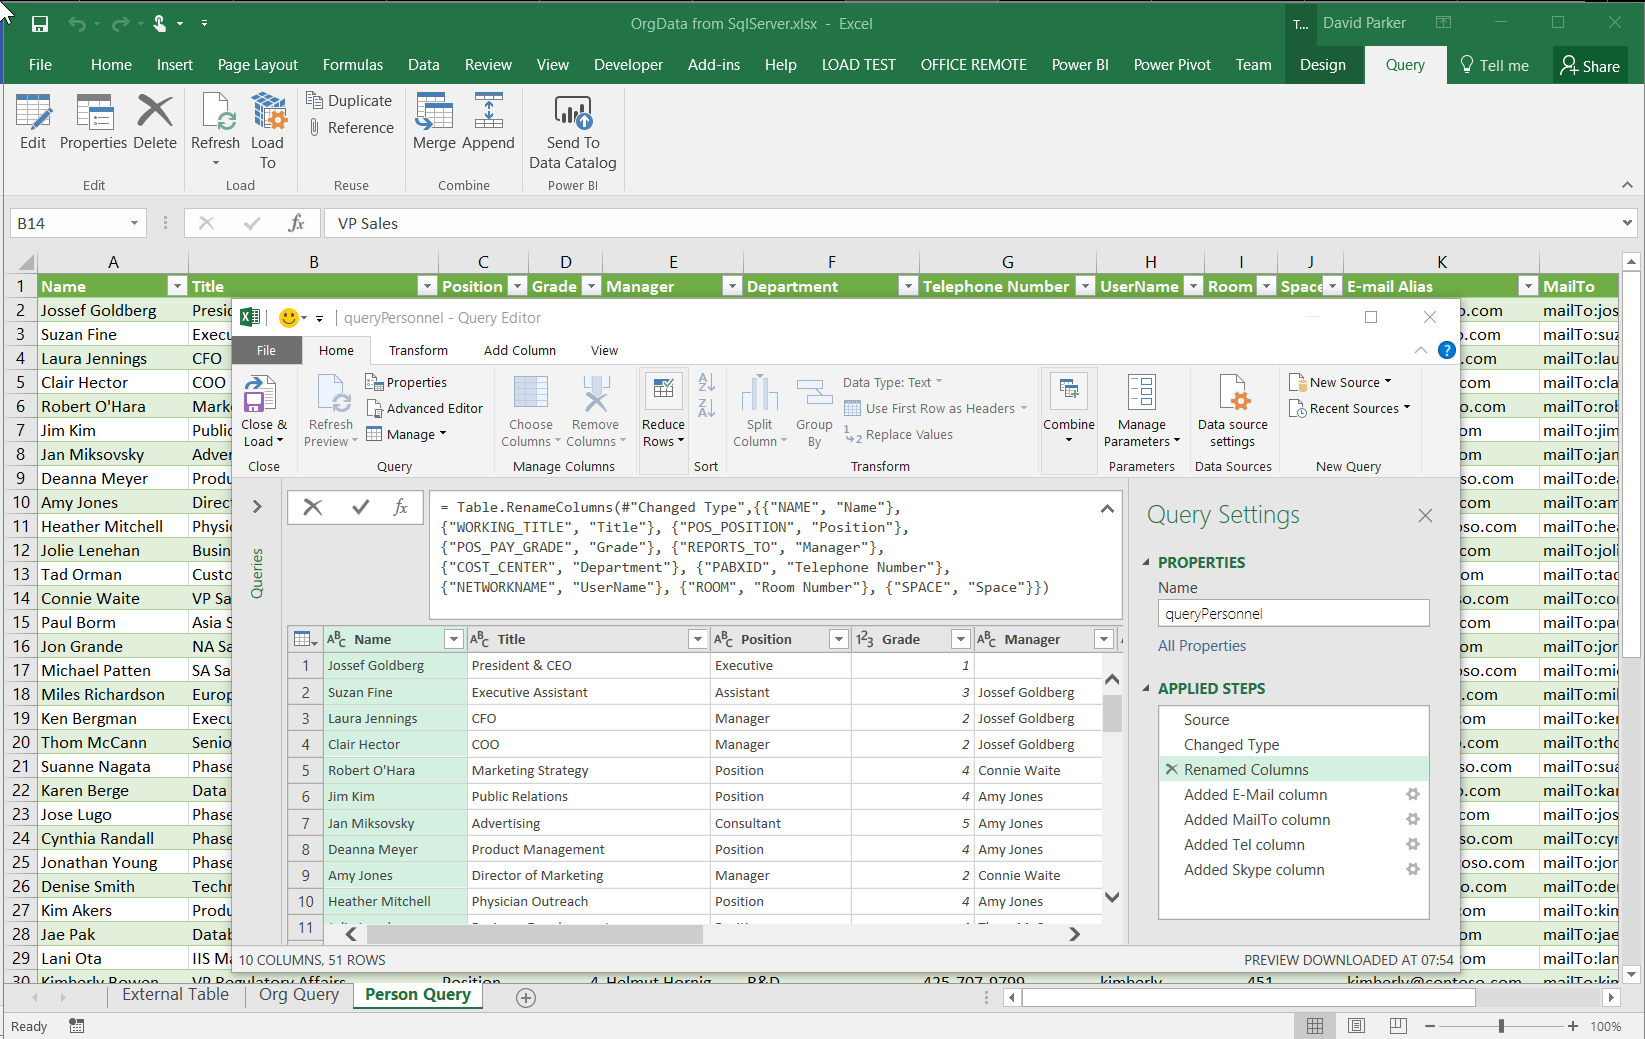
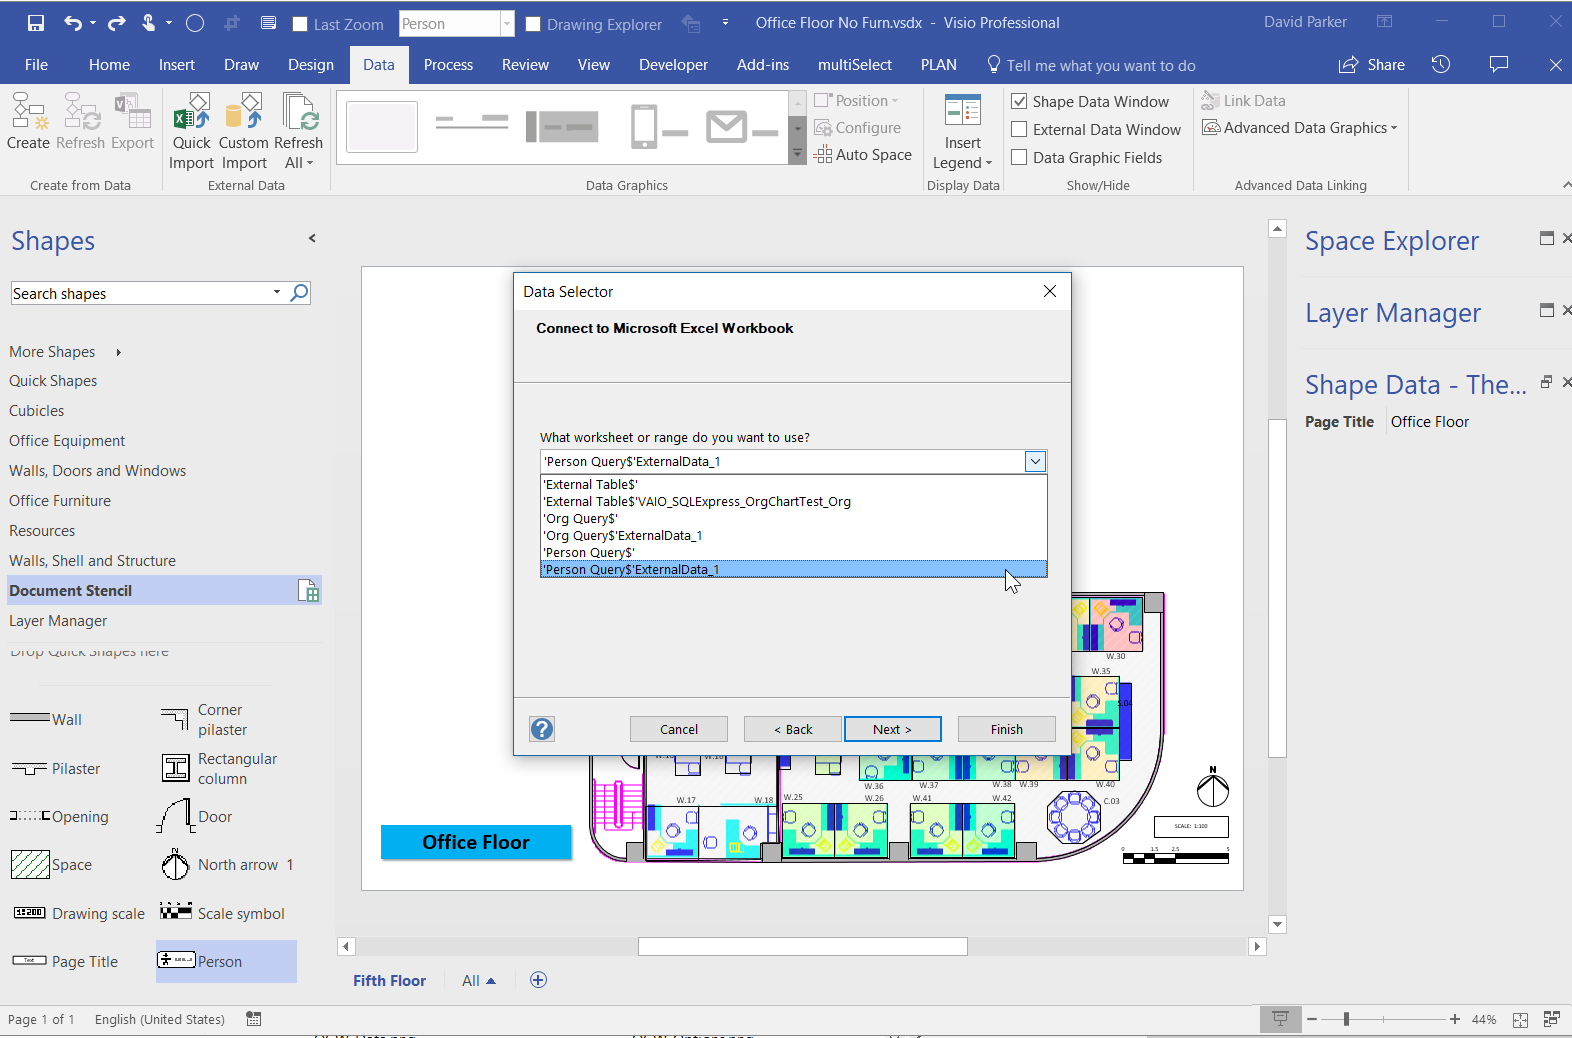
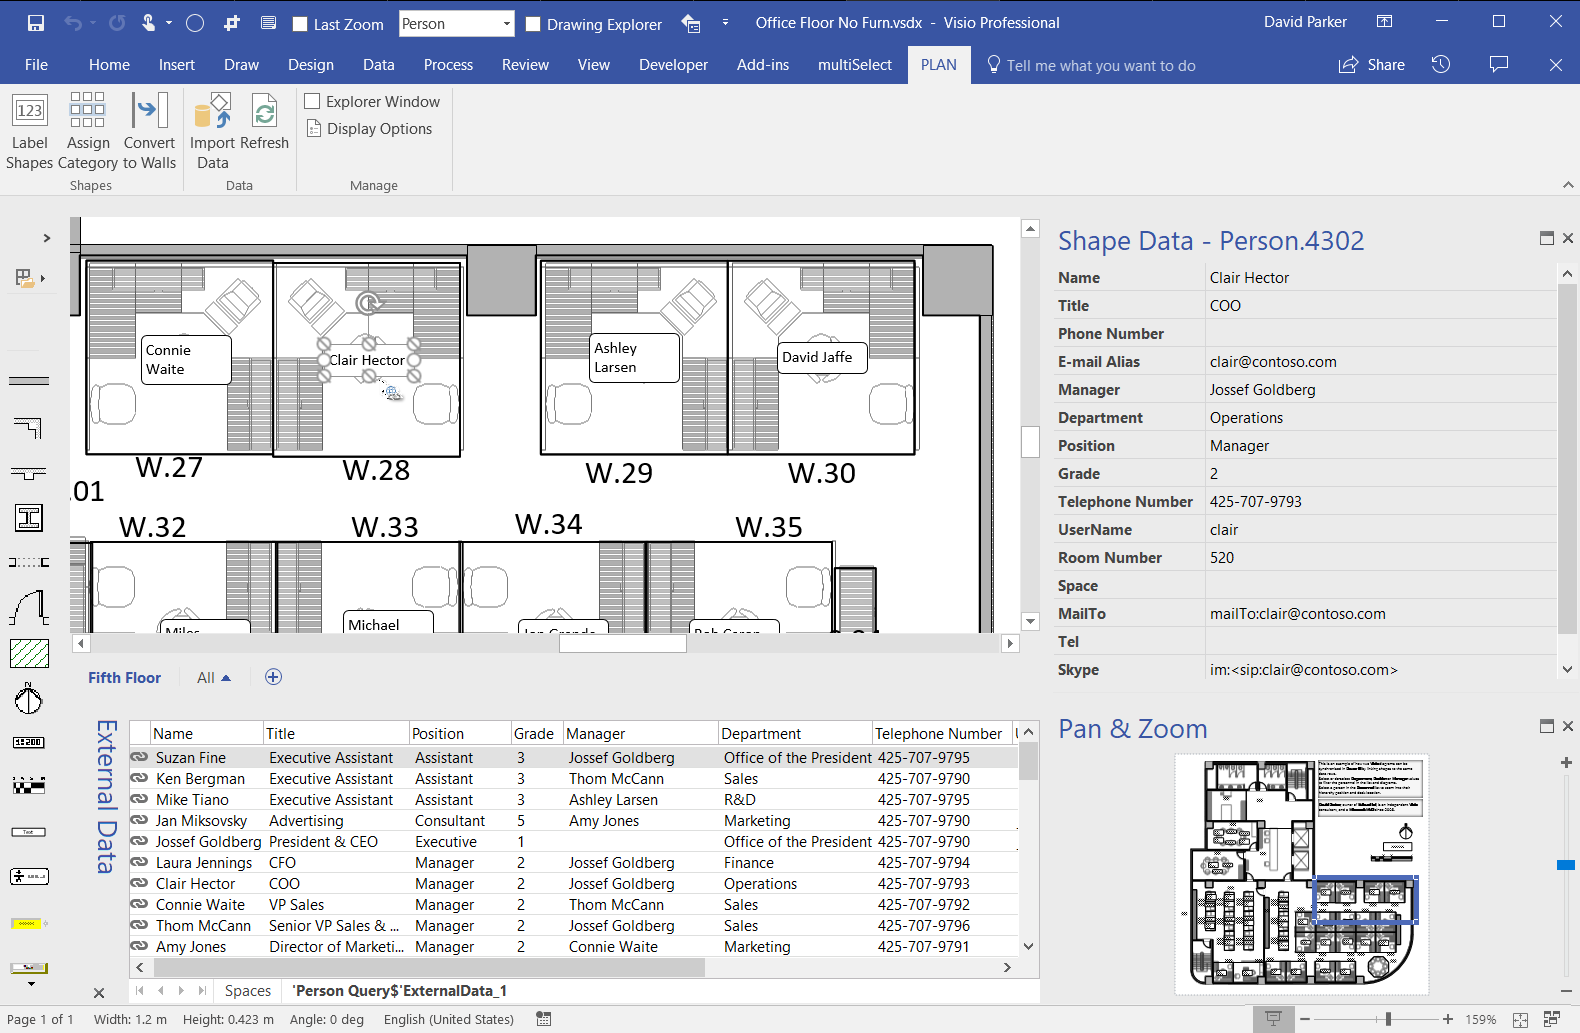
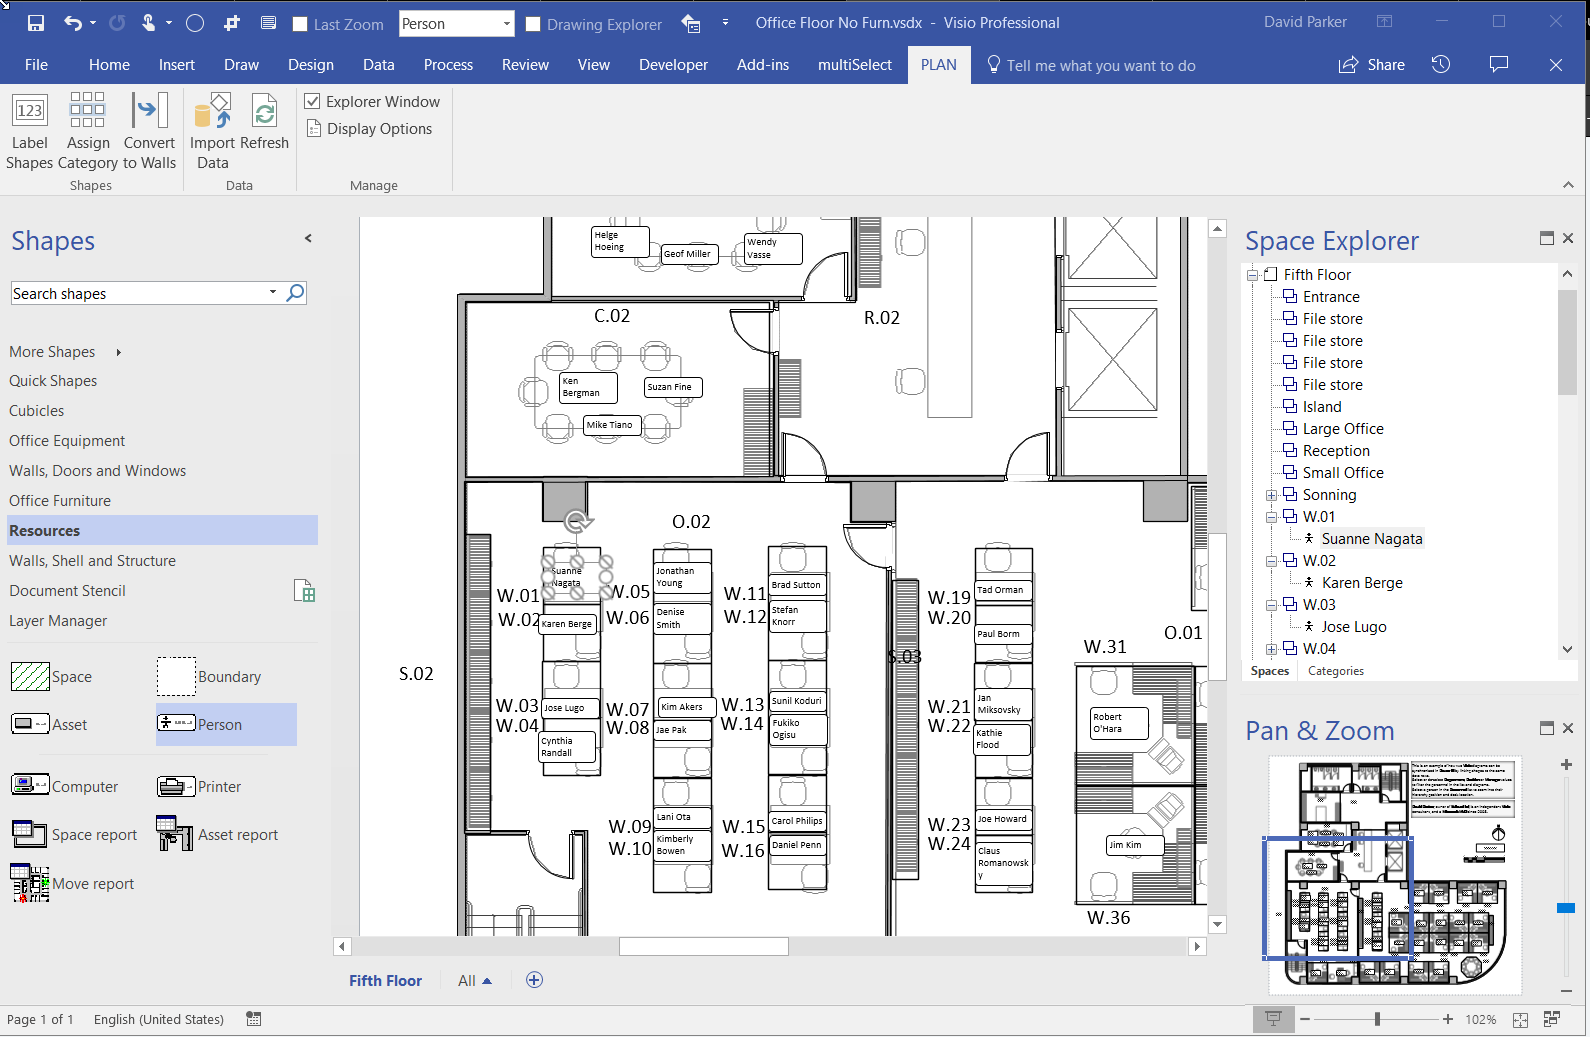
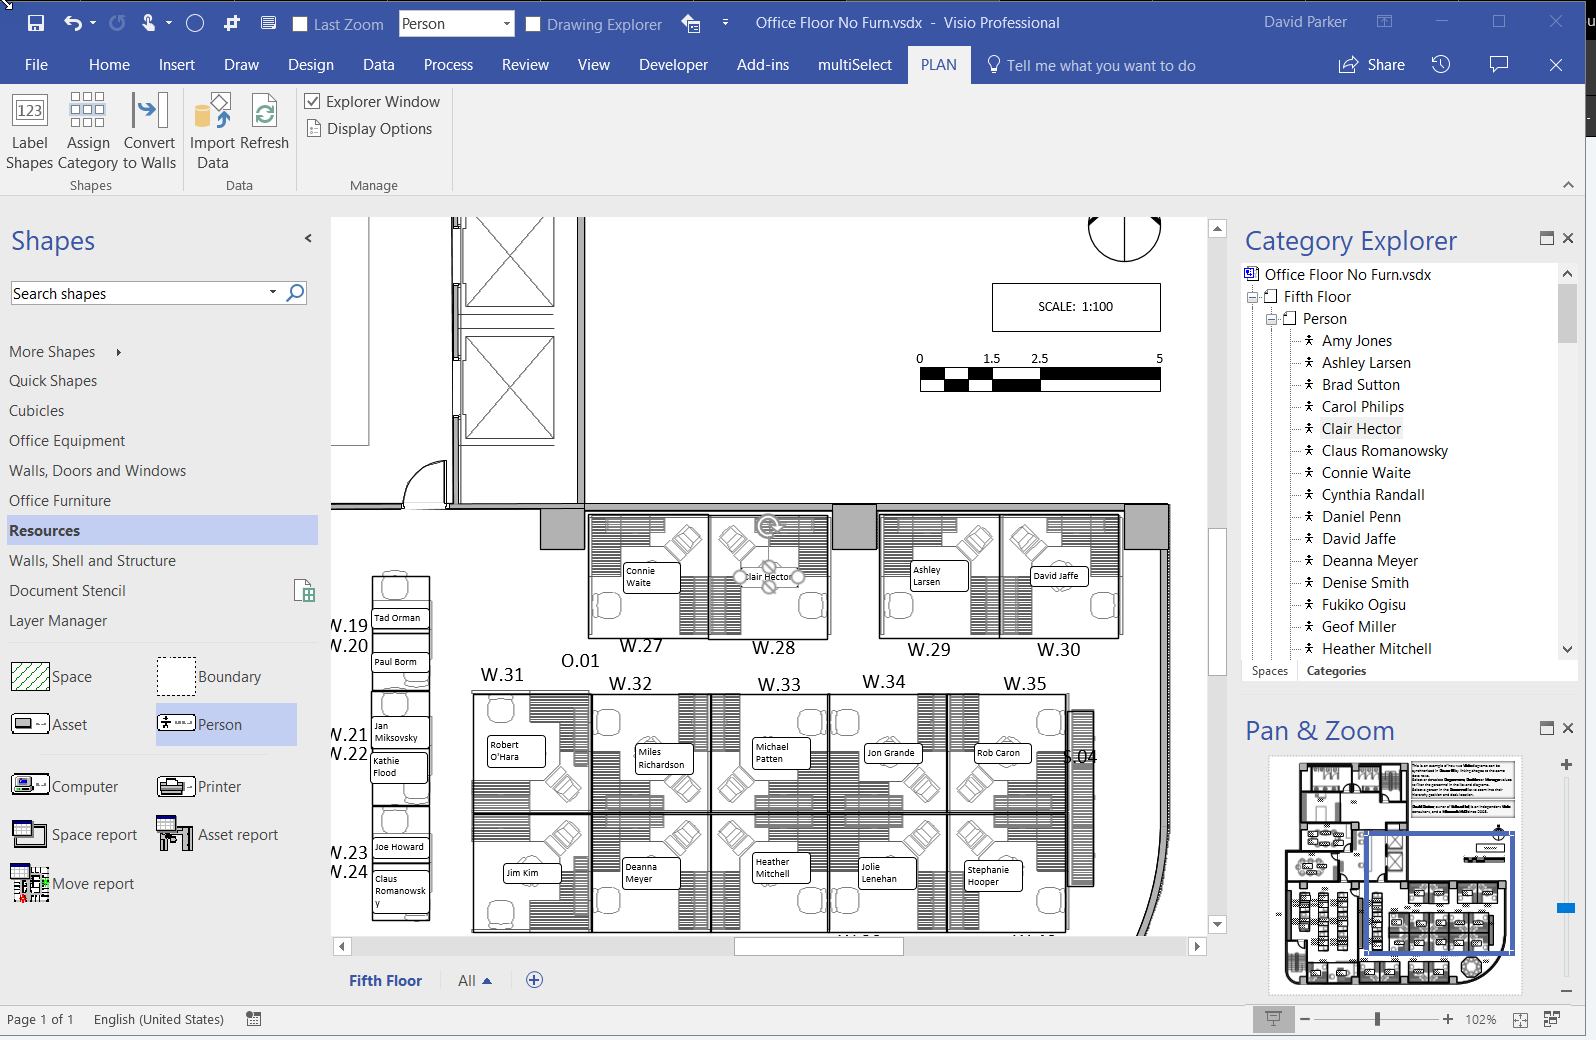
I duplicated the queryOrg in PowerQuery in Excel, as queryPersonnel, and slightly modified the naming of columns to match the Resources / Person master Shape Data row labels, as described in the previous article. I could then add data-linked Person shapes to the floor plan into the Space shapes that I had already added to it. These Space Plan add-on to Visio also includes Space and Category Explorer window which can be used to find a person by their name or by their location.
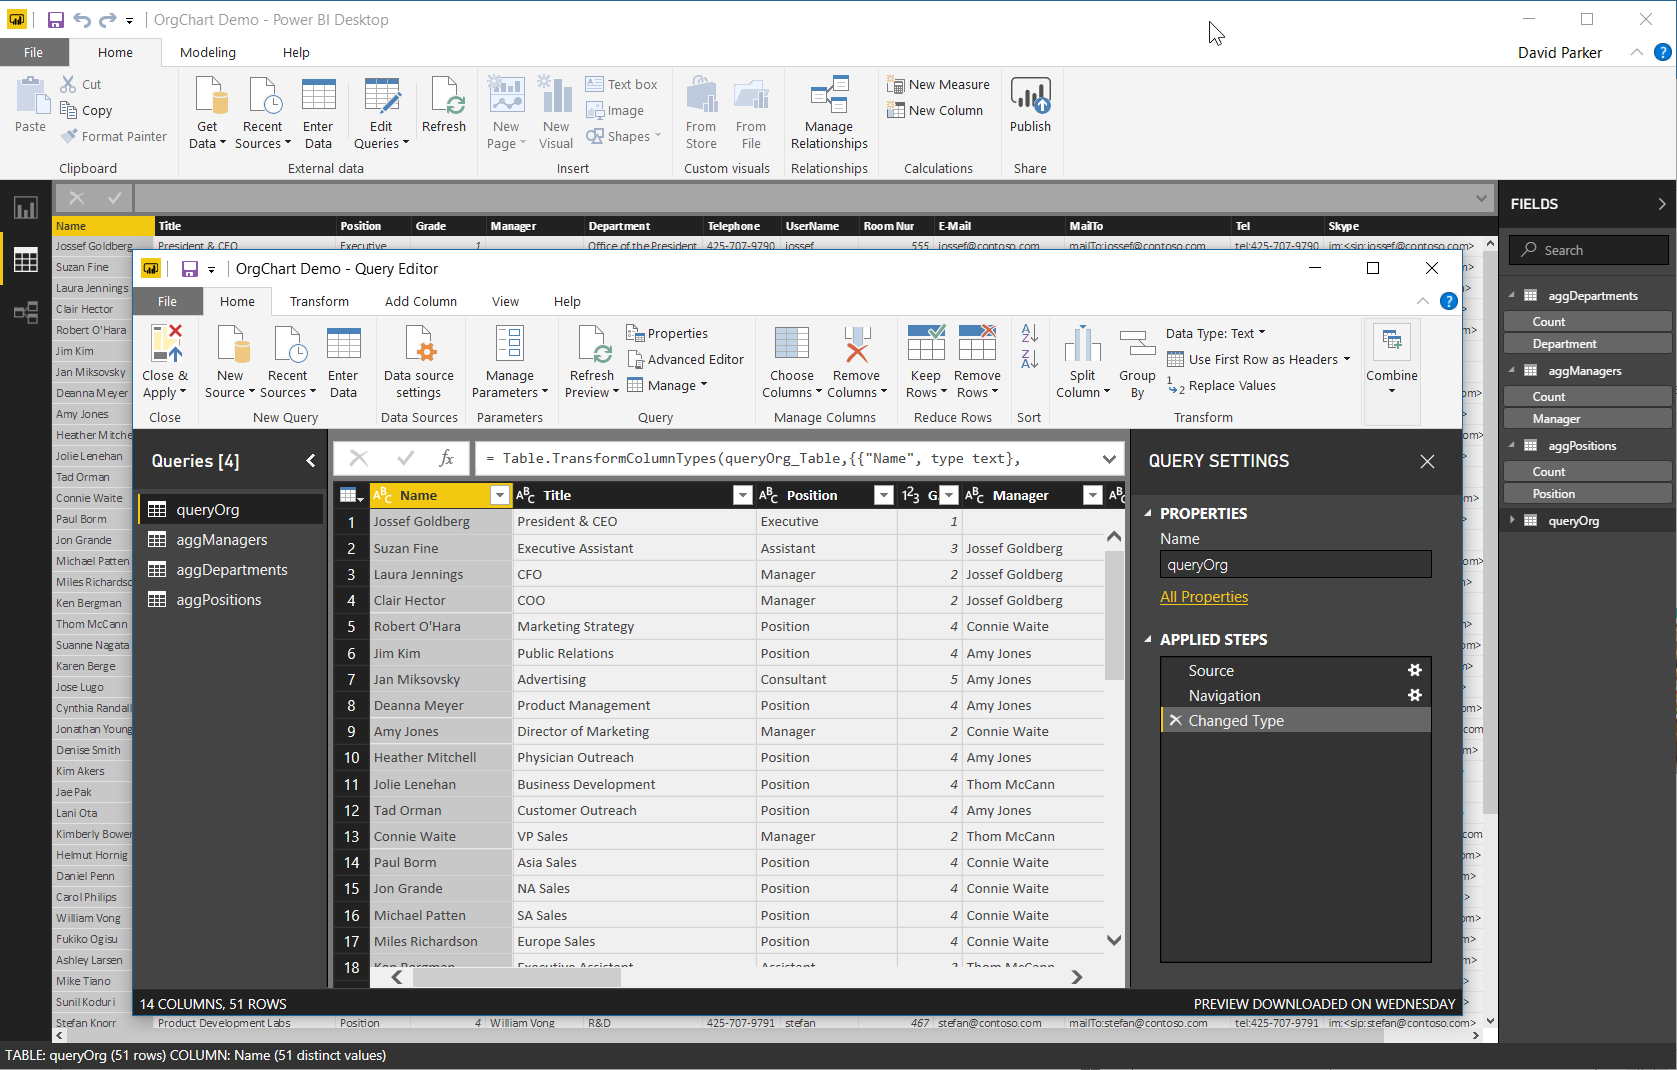
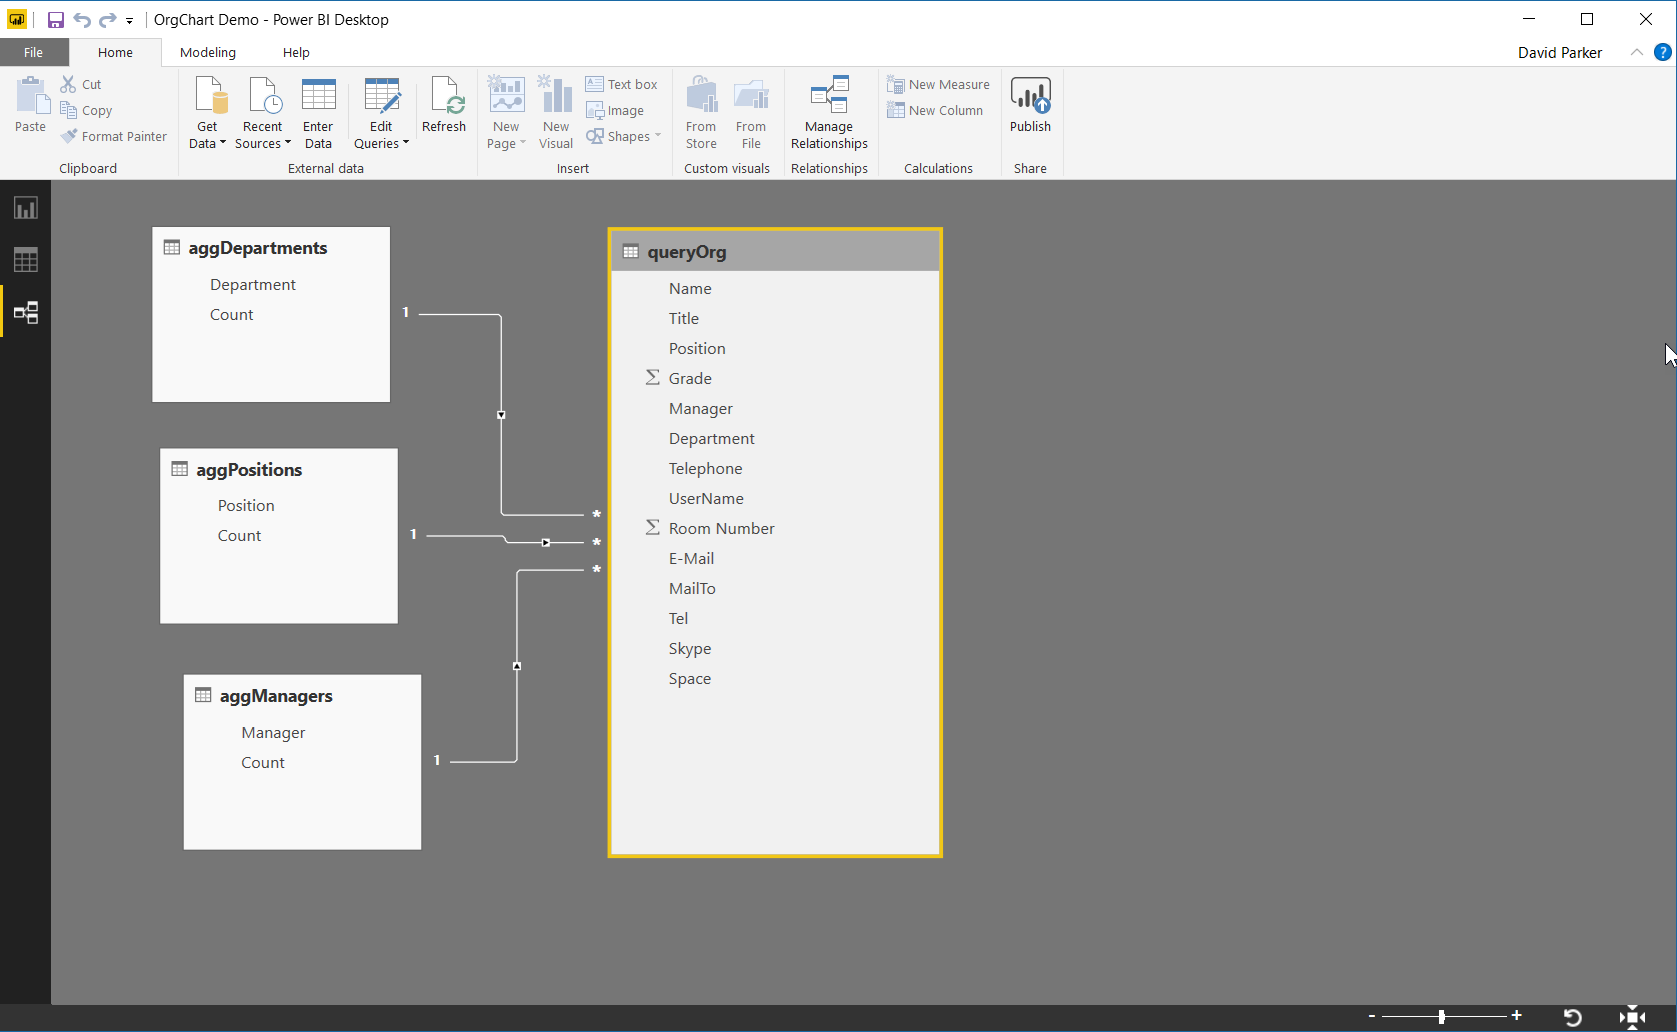
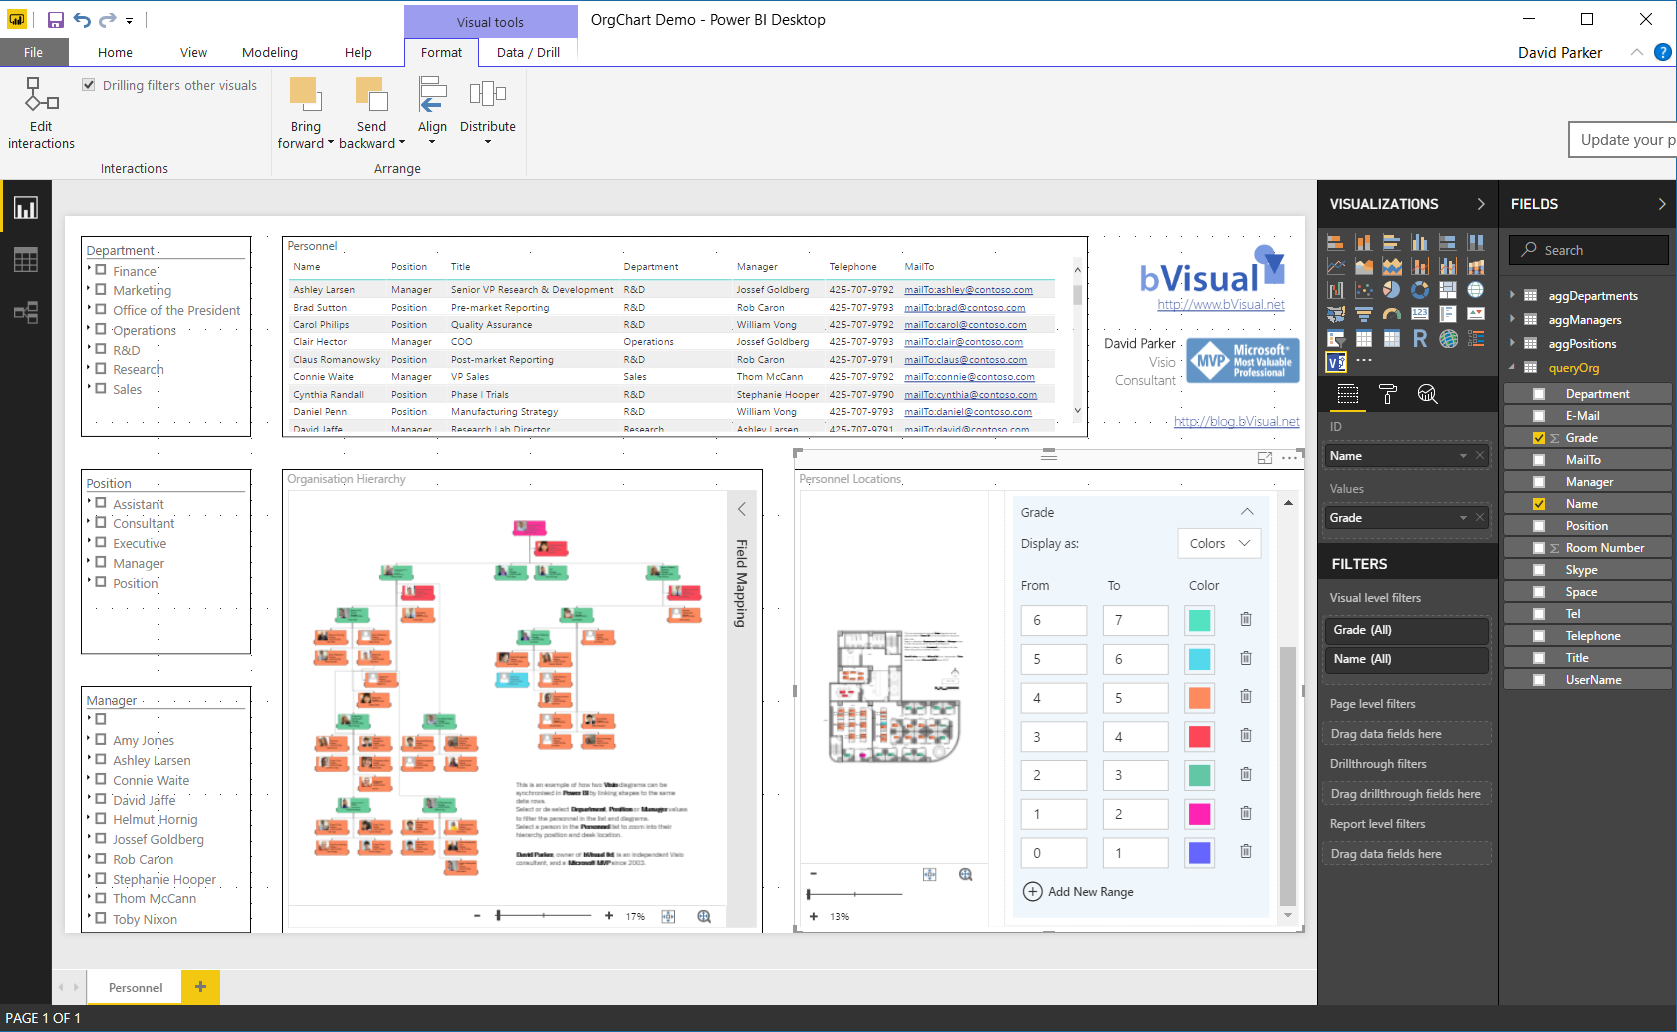
I used Power BI Desktop edition to get the queryOrg query from the Excel workbook, and created three aggregating queries for Department, Position and Manager. These were used to provide hierarchy slicers on the report.
I used the Visio Custom Visual and the Hierarchy Slicer from the Store in Power BI in addition to the standard Table visual.
I had to reduce the shape count on my office floor plan drawing, because the preview of the VisioCustom Visual for Power BI has a shape count limitation ( see Add Visio visualizations to Power BI reports for more information). This meant removing all of the furniture shapes that I has added over the top of the embedded CAD file. I also changed the color of the embedded CAD file layers to shades of grey, because I intended to use colors in Power BI. In fact, I grey-scaled all of the Visio shapes in the office plan and the organisation chart to provide greater contrast to the colors in Power BI. The embedded Visio Online visual in Power BI will automatically suppress and Data Graphics (Text Callouts, Icon Sets, Data Bars or Color by Value), but I removed them in the Visio file too because it must delay the display if Visio Online needs to hide them.

One key learning point for me is that the preparation of a Visio file for consumption by Power BI is different than that for printing or normal online viewing.

Related articles:

Aliasing Data Columns for Visio Organization Chart Wizard
Adding clicks to infographics with Visio visual for PowerBI
Visio custom visual preview for PowerBI available for all!
 

Related

Filed Under: Floor Plans, Org Charts, PowerBI, Visio 2016, Visio Online Tagged With: Excel, PowerQuery, Visio

About David Parker

David Parker has 25 years' experience of providing data visualization solutions to companies around the globe. He is a Microsoft MVP and Visio expert.

Reader Interactions

Comments

  1. Wim says

    August 29, 2018 at 9:22 am

    Hi, is it possible to get the User’s Profile data in visio directly from Office 365, instead of importing the data from excel for example. Mainly the user’s picture should come from Office 365. Any change on Office 365 by the end user would reflect immediately in the floor plan or Org Chart in Visio.

    Reply
    • davidjpp says

      November 5, 2018 at 4:50 pm

      Not currently … I did suggest this to the Visio dev. team, so who knows ….

      Reply
  2. Jaime says

    June 11, 2023 at 5:38 pm

    Hello David, it has been very interesting to explore your site and your blog. i’m trying to replicate some of your visio integrations with powerbi because they would be very useful for our company, but i can’t get auto-zoom to work in the visio visualization when i select (filter) data in powerbi; it works very well selecting the data directly in the visio visualization but not the other way around….. do you know how to contact the development team of the visio visualization to ask them this question? I would greatly appreciate any help. James

    Reply
    • David Parker says

      June 23, 2023 at 10:44 am

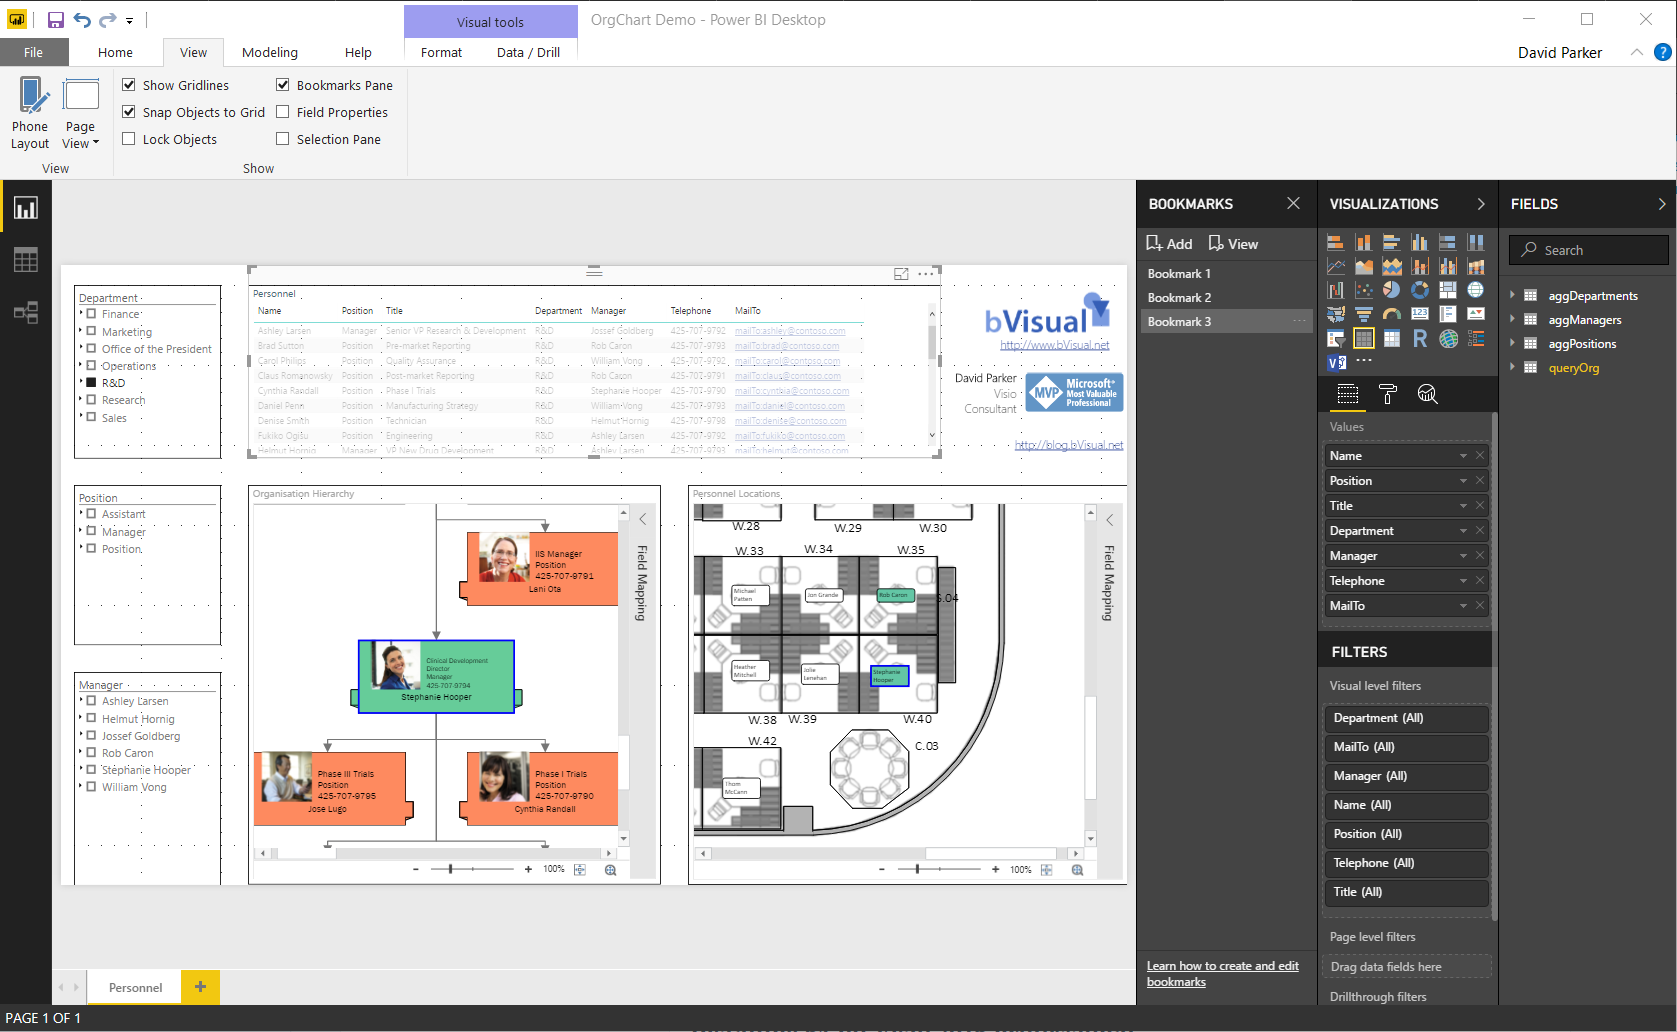
      To get the Visio diagram to zoom in when you select a row in another visual, ensure that that the field added to the Values in the Visualizations tab is set to anything but Don’t summarize !
      In my org chart and desk layout example, I have the Grade field set to Sum for both Visio diagrams.

      Reply

Trackbacks

  1. #PowerApps in #PowerBI with #Visio!!! | bVisual - for people interested in Microsoft Visio says:
    January 6, 2018 at 6:05 pm

    […] PowerApps visual to my example synchronised Org Chart and Desk Layout from my previous article ( #Visio in #PowerBI for viewing personnel hierarchies and locations ) , and recorded a simple selection in the following […]

    Reply
  2. [Références] Power BI en posts – 2018 – Bonjour Joël says:
    January 14, 2018 at 1:53 pm

    […] Visio in Power BI for viewing personnel hierarchies and locations […]

    Reply

Leave a Reply Cancel reply

Your email address will not be published. Required fields are marked *

Primary Sidebar

  • LinkedIn
  • Twitter

Recent Posts

  • Fixing dimensions of 2D shapes
  • Merging Linked Data from Similar Tables
  • Smart Radio Buttons and Check Boxes in Visio
  • Using Button Face Ids in Visio
  • Grid Snapping Revisited

Categories

Tags

Accessibility Add-Ins Connectors Containers Data Export Data Graphics Data Import Data Visualizer Educational Excel GraphDatabase Hyperlinks Icon Sets JavaScript LayerManager Layers Legend Link Data to Shapes Lists MSIgnite MVP Office365 Org Chart PowerApps PowerBI PowerQuery Processes Setup and Deployment Shape Data Shape Design ShapeSheet ShapeSheet Functions SharePoint 2013 SQL Teams Validation VBA Video Visio Visio 2007 Visio for the Web Visio Online Visio Services Visio Viewer Webinar

Footer

bVisual Profile

The UK-based independent Visio consultancy with a worldwide reach. We have over 25 years experience of providing data visualization solutions to companies around the globe.

Learn more about bVisual

  • Amazon
  • E-mail
  • Facebook
  • LinkedIn
  • Twitter
  • YouTube

Search this website

Recent posts

  • Fixing dimensions of 2D shapes
  • Merging Linked Data from Similar Tables
  • Smart Radio Buttons and Check Boxes in Visio
  • Using Button Face Ids in Visio
  • Grid Snapping Revisited

Copyright © 2025 · Executive Pro on Genesis Framework · WordPress · Log in