• Skip to main content
  • Skip to primary sidebar
  • Skip to footer

bVisual

  • Home
  • Services
    • How Visio smartness can help your business
    • Visio visual in Power BI
    • Visio Consulting Services
    • Visio Bureau Services
    • Visio Training and Support Services
  • Products
    • Visio Shape Report Converter
    • SS Plus
    • LayerManager
    • visViewer
    • Metro Icons
    • Rules Tools for Visio
    • The Visio 2010 Sessions App
    • Multi-Language Text for Visio
    • Document Imager for Visio
    • multiSelect for Visio
    • pdSelect for Visio
  • Case Studies
    • Case studies overview
    • Using Visio in Education for GIS
    • Visualizing Construction Project Schedules
    • Visio Online Business Process Mapping
    • Nexans Visio Template
    • CNEE Projects, WorldCom
    • Chase Manhattan Bank
  • News
    • Recent news
    • News archive
  • Resources
    • Articles➡
      • ShapeSheet Functions A-Z
      • Comparing Visio for the Web and Desktop
      • Customising Visio Shapes for the Web App
      • Key differences between the Visio desktop and web apps
      • Using the Visio Data Visualizer in Excel
      • Using Visio in Teams
      • Creating Visio Tabs and Apps for Teams with SharePoint Framework (SPFx)
      • Designing Power Automate Flows with Microsoft Visio
      • Innovative uses of Visio Lists
    • Webcasts ➡
      • Visio in Organizations
      • My session and other Visio sessions at MSIgnite 2019
      • Power up your Visio diagrams
      • Vision up your Visio diagrams
      • The Visio 2010 MVP Sessions
    • Visio Web Learning Resources
    • Books➡
      • Visualize Complex Processes with Microsoft Visio
      • Mastering Data Visualization with Microsoft Visio
      • Microsoft Visio Business Process Diagramming and Validation
      • Visualizing Information with Microsoft Visio
  • Blog
    • Browse blog articles
    • Visio Power BI articles
    • Visio for Web articles
    • A history of messaging and encryption
  • About us
    • About bVisual
    • Testimonials
    • Bio of David Parker
    • Contact Us
    • Website Privacy Policy
    • Website terms and conditions
    • Ariba Network

Data Graphics

Published on April 11, 2012 by David Parker

How to have six icons in a Visio Data Graphic Icon Set

I was recently asked to represent the values of Key Performance Indicators (KPIs) in Visio. Great, I thought, this is just what Visio’s Data Graphic Icon Sets are for! Only trouble was, that there were six possible values for the KPI, but all the example Icon Sets have a maximum of five icons in them. So, I had to come up with a way of displaying six icons …

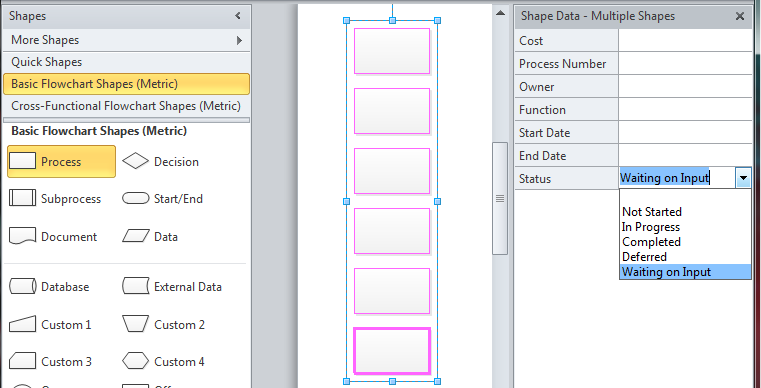
In the following example, I have defined a Shape Data row with a Fixed List type that can have a value from the list “3;2;1;-1;-2;-3”

image

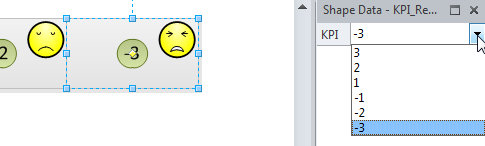
I applied the Faces Icon Set, and set icons for each value, except for –1:

[Read more…] about How to have six icons in a Visio Data Graphic Icon Set

Filed Under: Data Graphics, Shape Data, ShapeSheet Formulas, Visio, Visio 2010 Tagged With: Data Graphics, Icon Sets

Published on January 31, 2011 by David Parker

Using Character Map Symbols as Data Graphic Icons

I attended the ninth DDD on Saturday (see http://developerdeveloperdeveloper.com/ ), and, as usual, there were many interesting presentations. Sam Bourton extolled the virtues of Microsoft Expression Blend for WPF and Silverlight developers (NOT designers note!), and he showed a neat trick to create icons quickly by using Wingding symbols. Basically, he created a text block in Blend, inserted a symbol from one of the three Wingding fonts character maps, then converted the symbol to a path. It struck me that we could do a similar trick in Visio to create Data Graphic Icon Sets cheaply … so here goes…..
In this example, I am using a Process shape from the Basic Flowchart stencil because it has a Status Shape Data row that is defined as a choice from six different values (the first value is an empty text string).

Choice of Values for Status Shape Data row

[Read more…] about Using Character Map Symbols as Data Graphic Icons

Filed Under: Data Graphics, Shape Data, ShapeSheet Formulas, Visio, Visio 2010

Published on April 22, 2010 by David Parker

Displaying the RGB values of Shapes

Everyone knows that you can change the colour of Visio shapes.  Most people know that you can also change the fill pattern too.

image
[Read more…] about Displaying the RGB values of Shapes

Filed Under: Color, Data Graphics, ShapeSheet Formulas, VBA, Visio

Published on June 19, 2008 by David Parker

Enhancing Visio Data Graphics Text Callouts

Visio 2007 Professional introduced the wonderful Data Graphics feature to display Shape Data in a clear visual way, but it is not clear how you may, for example, change the font of even the simplest Graphic Item type, Text Callouts.  In this blog, I’ll show you one method that I employ to vary the appearance of Text Callouts.  The same technique can be used for other Graphic Item types, Icon Sets and Data Bars.

I am using the  the sample IT Asset Management drawing to demonstrate throughout, which can be found in the Samples Template Category.  In this diagram, the server shapes on the topology page use the Topology 1 Data Graphic, which can be seen in the Data Graphics panel.

image
[Read more…] about Enhancing Visio Data Graphics Text Callouts

Filed Under: Data Graphics, Visio

  • « Go to Previous Page
  • Page 1
  • Page 2
  • Page 3
  • Page 4

Primary Sidebar

  • LinkedIn
  • Twitter

Recent Posts

  • Fixing dimensions of 2D shapes
  • Merging Linked Data from Similar Tables
  • Smart Radio Buttons and Check Boxes in Visio
  • Using Button Face Ids in Visio
  • Grid Snapping Revisited

Categories

Tags

Accessibility Add-Ins Connectors Containers Data Export Data Graphics Data Import Data Visualizer Educational Excel GraphDatabase Hyperlinks Icon Sets JavaScript LayerManager Layers Legend Link Data to Shapes Lists MSIgnite MVP Office365 Org Chart PowerApps PowerBI PowerQuery Processes Setup and Deployment Shape Data Shape Design ShapeSheet ShapeSheet Functions SharePoint 2013 SQL Teams Validation VBA Video Visio Visio 2007 Visio for the Web Visio Online Visio Services Visio Viewer Webinar

Footer

bVisual Profile

The UK-based independent Visio consultancy with a worldwide reach. We have over 25 years experience of providing data visualization solutions to companies around the globe.

Learn more about bVisual

  • Amazon
  • E-mail
  • Facebook
  • LinkedIn
  • Twitter
  • YouTube

Search this website

Recent posts

  • Fixing dimensions of 2D shapes
  • Merging Linked Data from Similar Tables
  • Smart Radio Buttons and Check Boxes in Visio
  • Using Button Face Ids in Visio
  • Grid Snapping Revisited

Copyright © 2025 · Executive Pro on Genesis Framework · WordPress · Log in