I attended the ninth DDD on Saturday (see http://developerdeveloperdeveloper.com/ ), and, as usual, there were many interesting presentations. Sam Bourton extolled the virtues of Microsoft Expression Blend for WPF and Silverlight developers (NOT designers note!), and he showed a neat trick to create icons quickly by using Wingding symbols. Basically, he created a text block in Blend, inserted a symbol from one of the three Wingding fonts character maps, then converted the symbol to a path. It struck me that we could do a similar trick in Visio to create Data Graphic Icon Sets cheaply … so here goes…..
In this example, I am using a Process shape from the Basic Flowchart stencil because it has a Status Shape Data row that is defined as a choice from six different values (the first value is an empty text string).
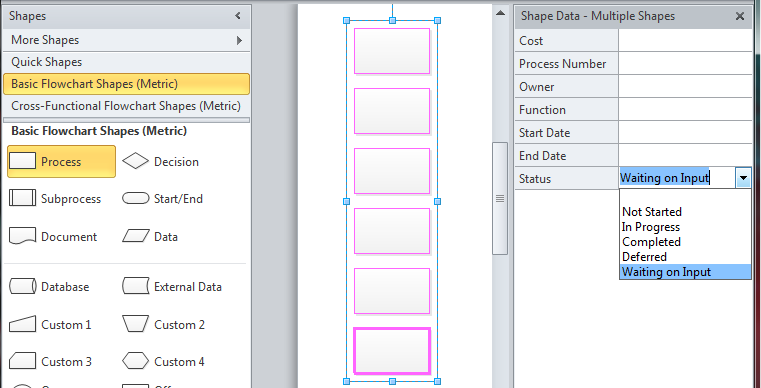
Choice of Values for Status Shape Data row
I placed six Process shapes down on the page, just so that I could see the effect of applying a different value to each one, and then applying a Data Graphic Icon Set. First, I setup a new Data Graphic with just the five non-blank values mapped to icons:
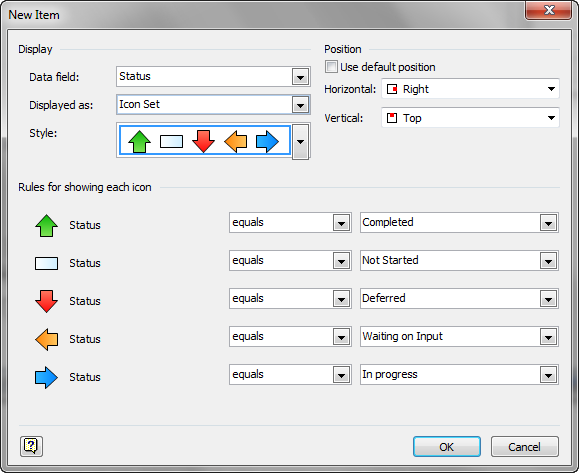
Status values mapped to Trend Arrow icons
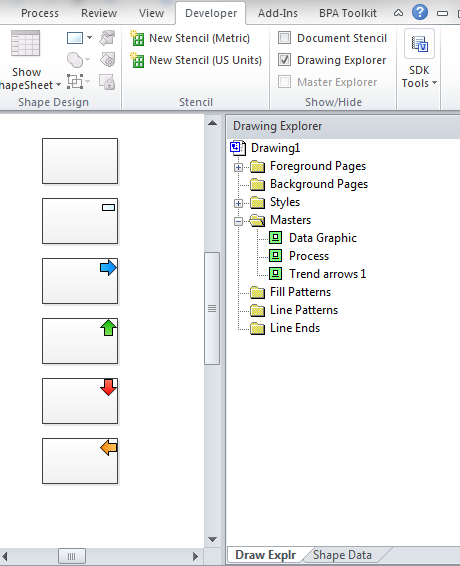
Then I applied the Trend Arrow 1 Icon Set to my six Process shapes, and then opened the Drawing Explorer window (you can turn on Developer Mode from File \ Options \ Advanced ). Then I duplicated the Trend arrows 1 master and renamed it as Symbol icons 1 (just use the right mouse menu in the Drawing Explorer window).
Trend Arrow Icons Applied
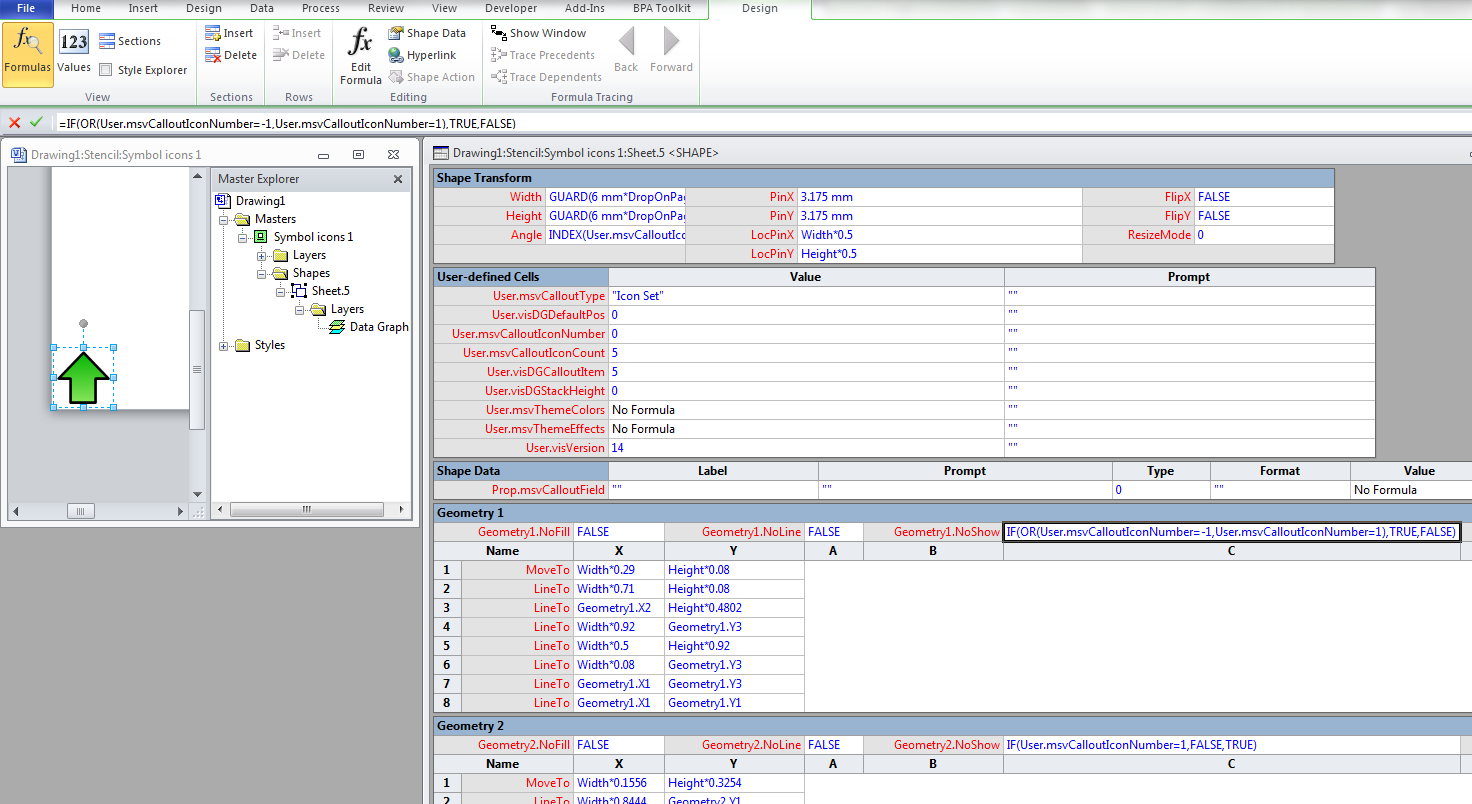
If you edit the Symbol icons 1 master, it will, of course, be identical to the Trend arrows 1 master that we duplicated. Notice that there are a number of User-defined cells, and that there are only 2 Geometry sections. The different rotations and flips of the arrows that you see in the Trend arrow 1 icon set are handled by the formula in the Angle cell. As we will not be requiring our icons to be rotated, I changed the formula from:
=INDEX(User.msvCalloutIconNumber+1,”0 deg;0 deg;0 deg;180 deg;-90 deg;90 deg”)*IF(BITXOR(FlipX,FlipY),1,-1)
to :
=INDEX(User.msvCalloutIconNumber+1,”0 deg;0 deg;0 deg;0 deg;0 deg;0 deg”)*IF(BITXOR(FlipX,FlipY),1,-1)
The Trend Arrows 1 master
I selected the arrow shape, pressed F2 for Text Edit, then used the Insert \ Symbol to select the icons that I wanted. The Wingdings, Wingdings 2 and Wingdings 3 font maps should give you a few to choose from.
In fact, I inserted 5 symbols then formatted each character with the font color of my choosing. This will cause Visio to create a row for each Character, explicitly expressing the Font, Size, Color, etc, values.
The symbols after insertion
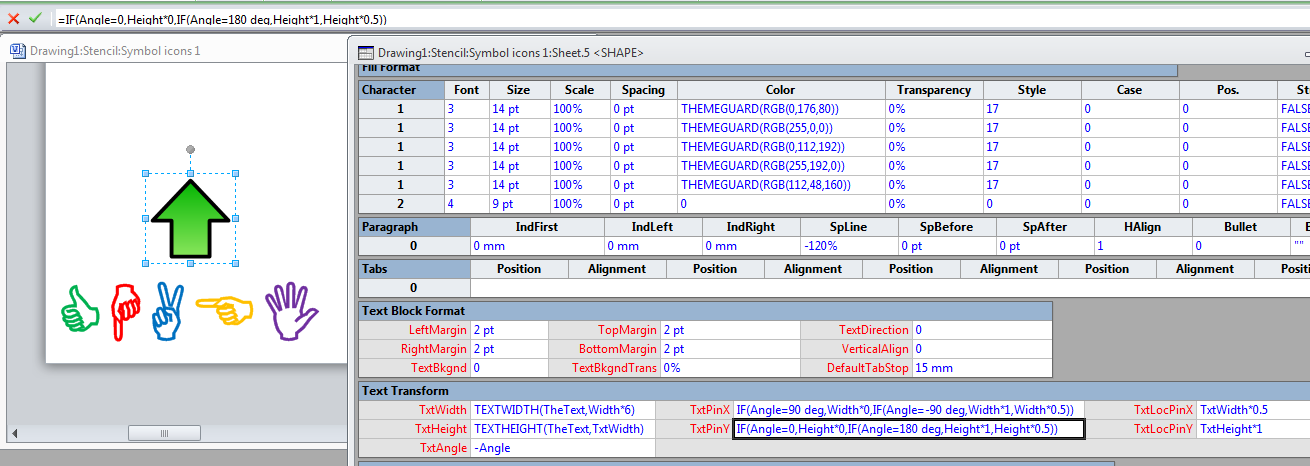
I took this opprtunity to update the formula in the text Transform TextPinY cell from:
=IF(Angle=0,Height*0,IF(Angle=180 deg,Height*1,Height*0.5))
to:
=IF(Angle=0,Height*1,IF(Angle=180 deg,Height*1,Height*0.5))
This change caused the hand symbols to move to be vertically centered. Next, I created 4 new User-defined cells, Character, Font, Size and Color, because I want to display only a single character per matching value. The format of the formula in each of these new cells is similar because they use the number in the User.msvCalloutIconNumber cell to return the required value from a semi-colon separated list. The values for Font, Size and Color can be read from each of the Character rows in order, but the list in the User.Character cell is less obvious. The hand symbols are equivalent to the usual characters in a normal font map, and the formula
=SHAPETEXT(TheText)
returned the string “CHAEI” for the hand symbols that I selected. I put this formula in the Uset.Character.Prompt cell and switched the display to Values mode in order to see this.
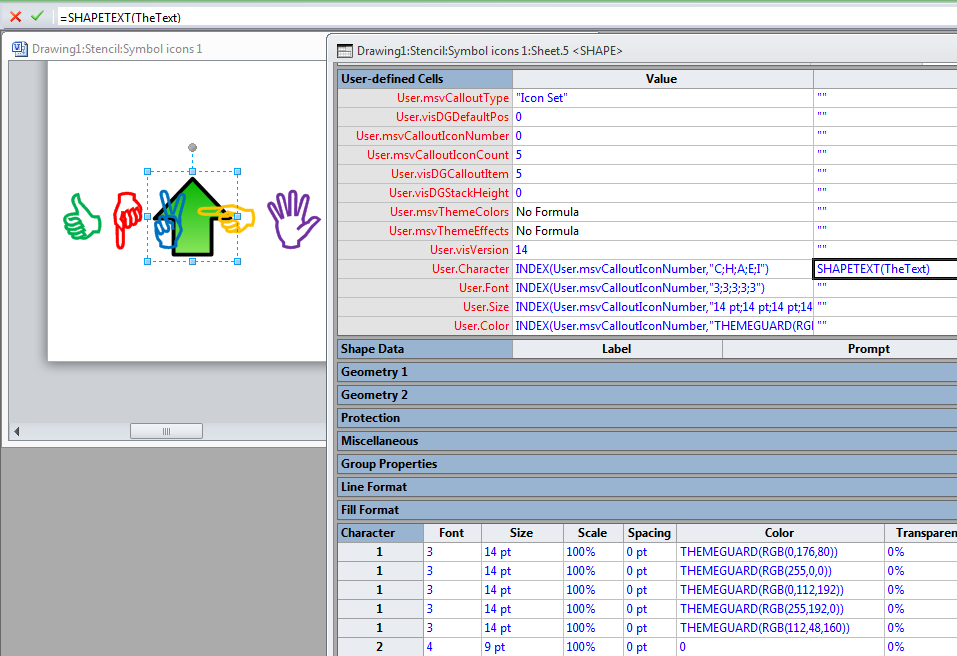
Create some User cells
Now, I could select the whole text block, and Insert \ Field, and select the User-defined cells \ Character field.
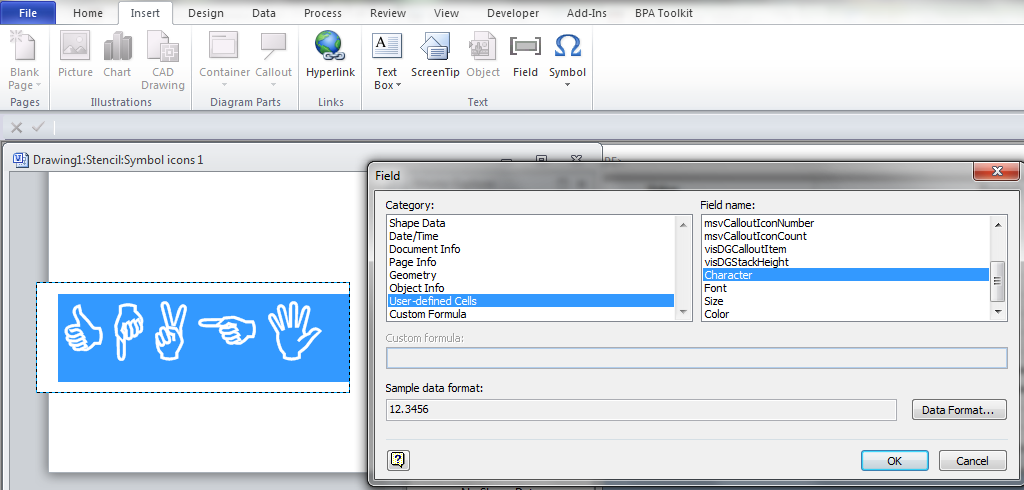
Insert a text field
This will automatically create the Text Fields section, with User.Character as the Value. Also, the rows in the Character section are reduced because 5 characters have been replaced with 1. I then updated the formulae of the Font, Size and Color cells in the first row, to reference the User.Font, User.Size and User.Color cells that I created earlier. The original arrow graphics are no longer required, so I just deleted the two Geometry sections.
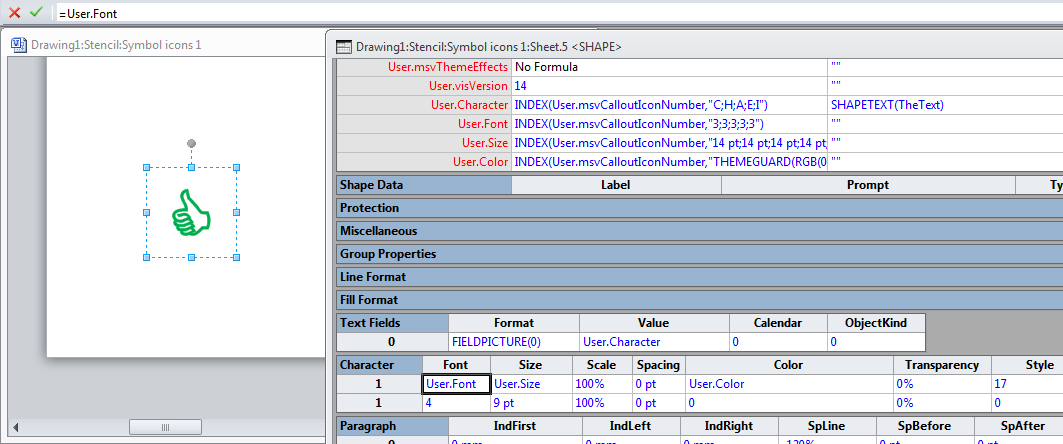
Delete the geometry sections
Finally, I could test the symbols by changing the value in the User.msvCalloutIconNumber cell between 0 to 4 to ensure that the hand changed. Any other value causes no hand to be displayed I then closed the Master edit and applied the new icon set by editing the Data Graphics.
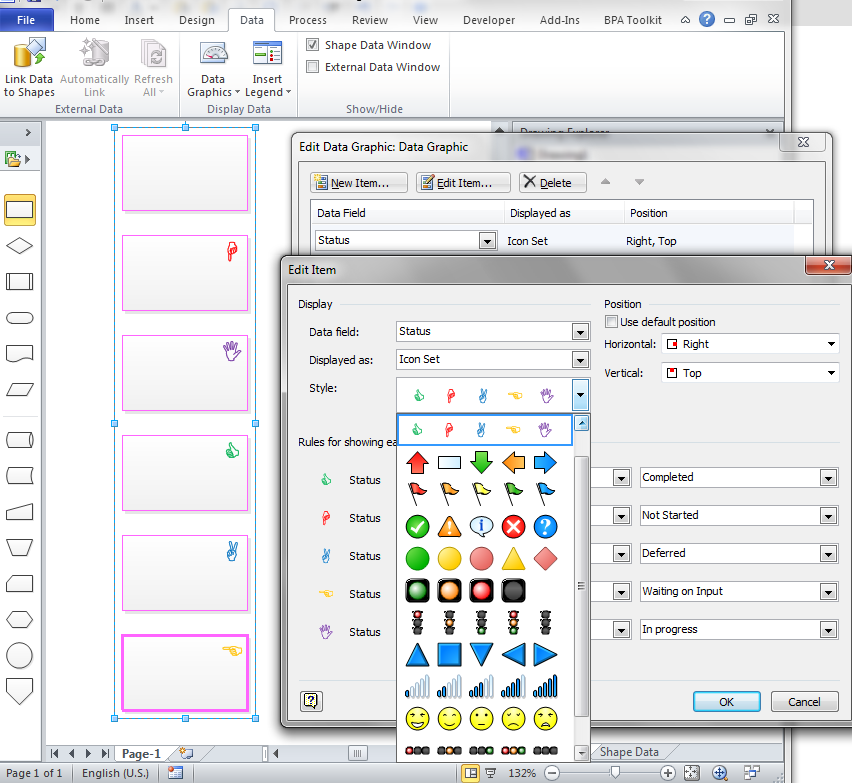
Apply the Symbol Data Icon Set
So, there you are. You can create your own icon sets from any of the symbols in the font maps. Of course, you can just duplicate the new Symbol Icons 1 master to shortcut the steps now!
How can I use Custom Units in format values…? e.g. say I want to show weight in Kgs or temperature in (degree symbol) Celsius? The only prefix/suffix that appears in number formats are currencies, lengths and percentage 🙁
I have written a short blog to answer your question at – http://davidjpp.wordpress.com/2011/10/13/formatting-custom-units-in-visio/