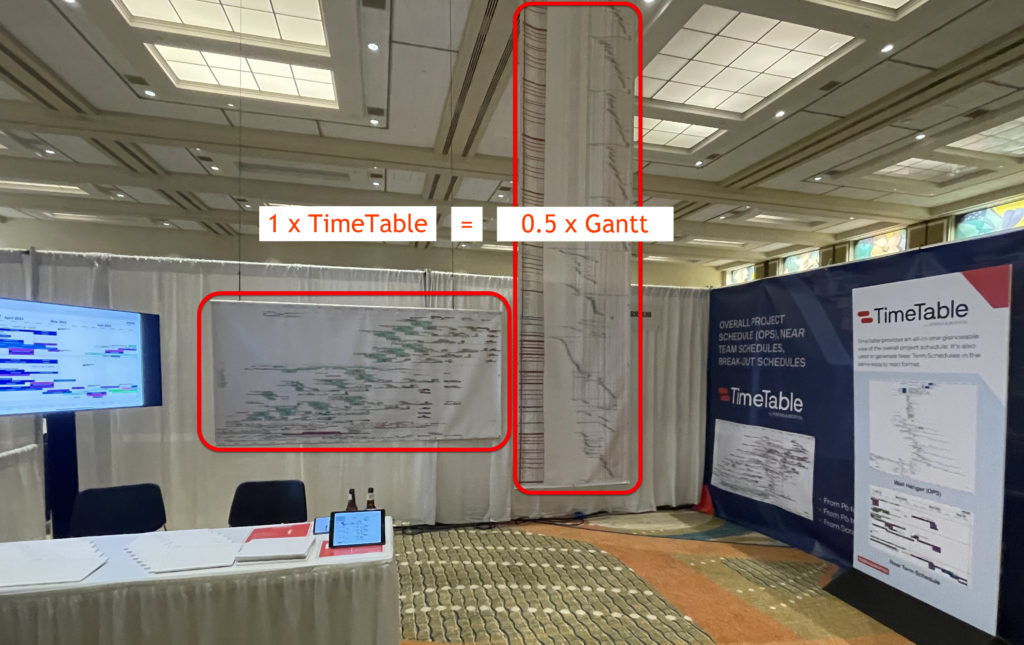
I was privileged to be invited to the biennial Robins & Morton conference in Orlando recently, where I assisted in presenting TimeTable to the hundreds of attendees there. A single wall-hanger (OPS) TimeTable Visio diagram automatically drawn from #OraclePrimaveraCloud data, is a condensed version of the same data printed as a Gantt chart some six times taller, as shown in the image below (there wasn’t enough ceiling height to print all the Gantt):