• Skip to main content
  • Skip to primary sidebar
  • Skip to footer

bVisual

  • Home
  • Services
    • How Visio smartness can help your business
    • Visio visual in Power BI
    • Visio Consulting Services
    • Visio Bureau Services
    • Visio Training and Support Services
  • Products
    • Visio Shape Report Converter
    • SS Plus
    • LayerManager
    • visViewer
    • Metro Icons
    • Rules Tools for Visio
    • The Visio 2010 Sessions App
    • Multi-Language Text for Visio
    • Document Imager for Visio
    • multiSelect for Visio
    • pdSelect for Visio
  • Case Studies
    • Case studies overview
    • Using Visio in Education for GIS
    • Visualizing Construction Project Schedules
    • Visio Online Business Process Mapping
    • Nexans Visio Template
    • CNEE Projects, WorldCom
    • Chase Manhattan Bank
  • News
    • Recent news
    • News archive
  • Resources
    • Articles➡
      • ShapeSheet Functions A-Z
      • Comparing Visio for the Web and Desktop
      • Customising Visio Shapes for the Web App
      • Key differences between the Visio desktop and web apps
      • Using the Visio Data Visualizer in Excel
      • Using Visio in Teams
      • Creating Visio Tabs and Apps for Teams with SharePoint Framework (SPFx)
      • Designing Power Automate Flows with Microsoft Visio
      • Innovative uses of Visio Lists
    • Webcasts ➡
      • Visio in Organizations
      • My session and other Visio sessions at MSIgnite 2019
      • Power up your Visio diagrams
      • Vision up your Visio diagrams
      • The Visio 2010 MVP Sessions
    • Visio Web Learning Resources
    • Books➡
      • Visualize Complex Processes with Microsoft Visio
      • Mastering Data Visualization with Microsoft Visio
      • Microsoft Visio Business Process Diagramming and Validation
      • Visualizing Information with Microsoft Visio
  • Blog
    • Browse blog articles
    • Visio Power BI articles
    • Visio for Web articles
    • A history of messaging and encryption
  • About us
    • About bVisual
    • Testimonials
    • Bio of David Parker
    • Contact Us
    • Website Privacy Policy
    • Website terms and conditions
    • Ariba Network

Power Platform

Published on February 9, 2018 by David Parker

Using Visio and PowerBI with GraphDatabase in SQLServer

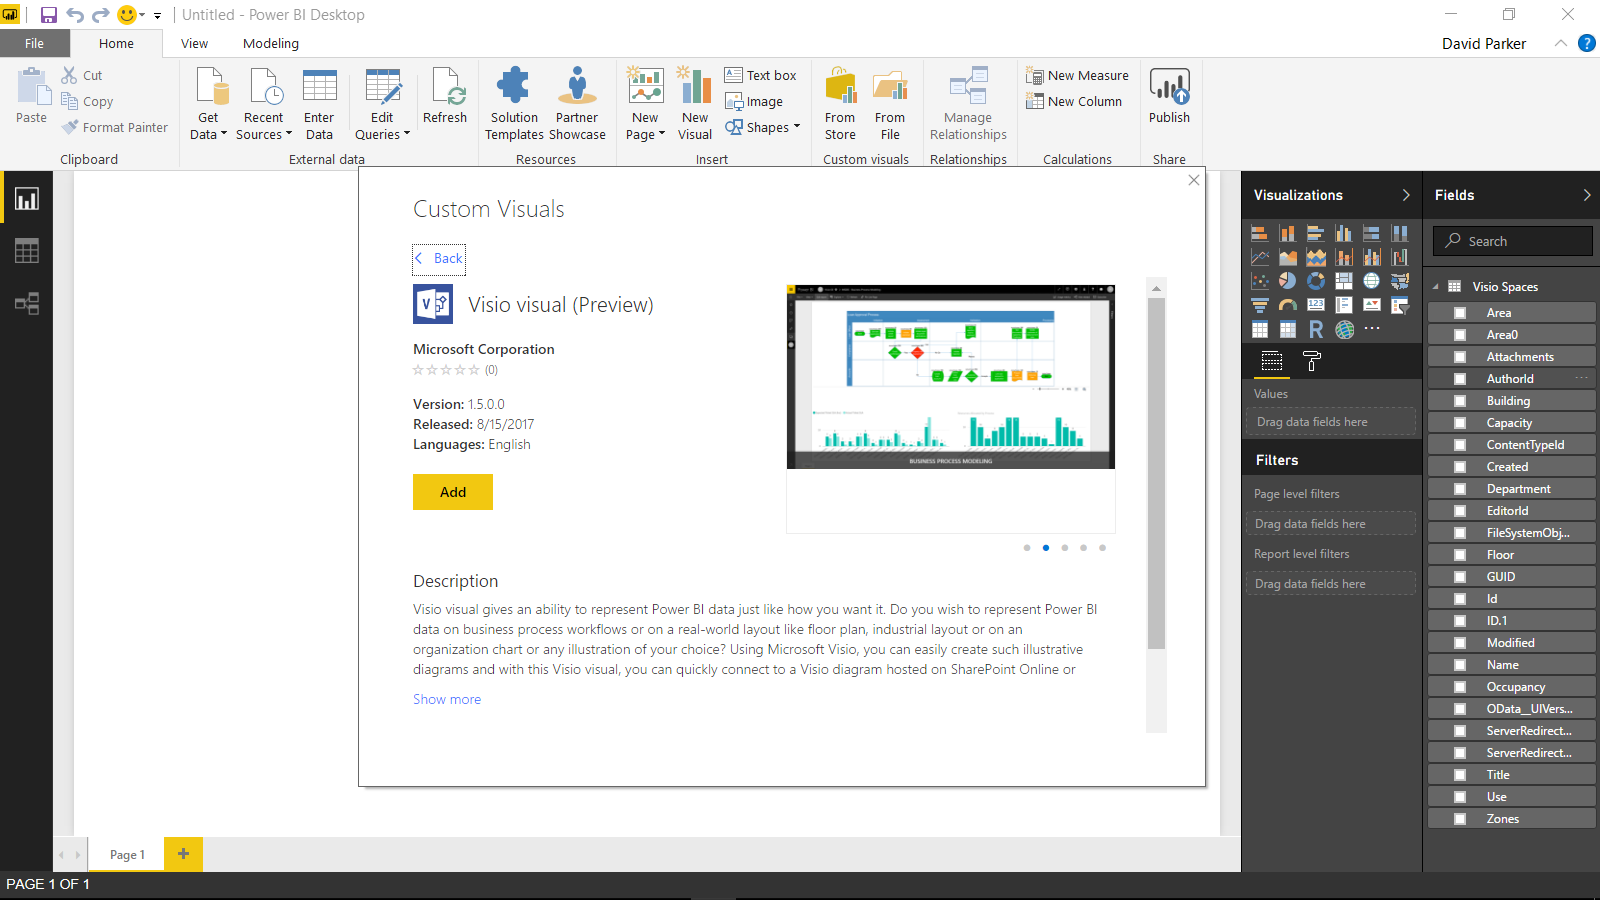
I went to a very interesting inaugural meeting of the South East UK Power BI Group last week. Whilst the presentation by Dr. Subramani Paramasivam was impressive for its ambition, it was the presentation by Andrew Fryer of Microsoft that particularly intrigued me. He introduced us to the world of Graph Databases, such as Neo4J and CosmosDB, but also demonstrated SQL Server 2017’s new Graph table types, called Node and Edge.  He used the latter because solution because he could use example in Power BI using the Force-Directed visual. Well, this SQL Server feature was new to me, and so I was inspired to see if I could use my favourite tool, Visio, to input data into a graph database, and to selectively display parts.

  • Graph Schema
  • Node Master
  • Edge Master


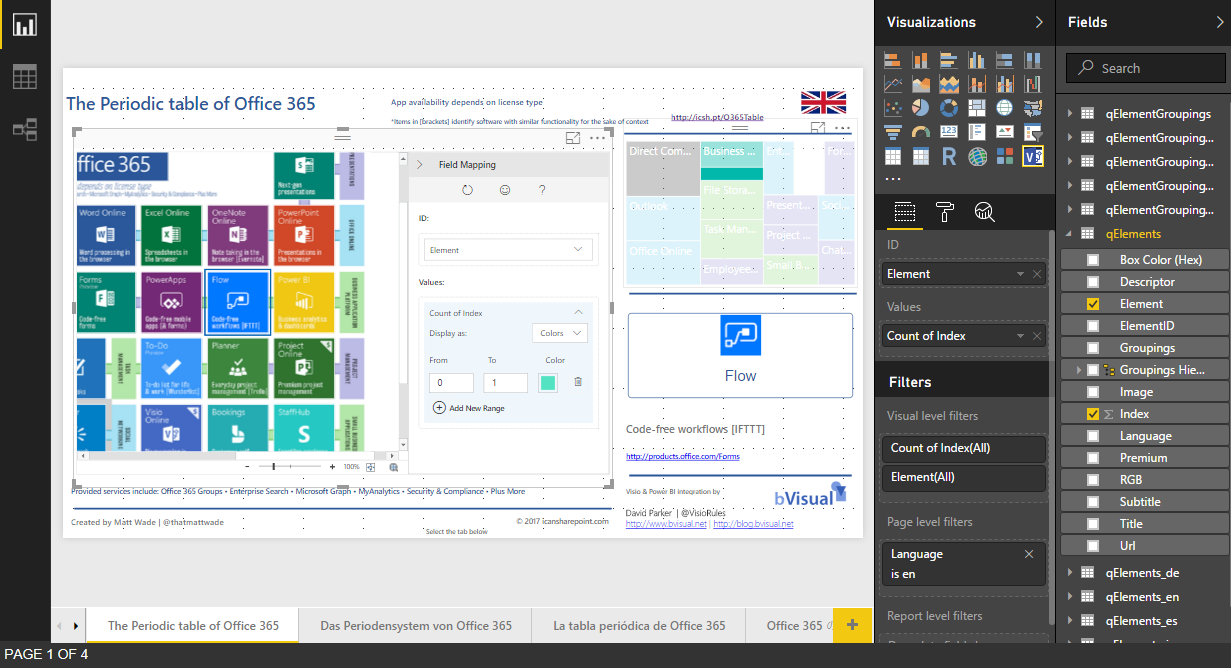
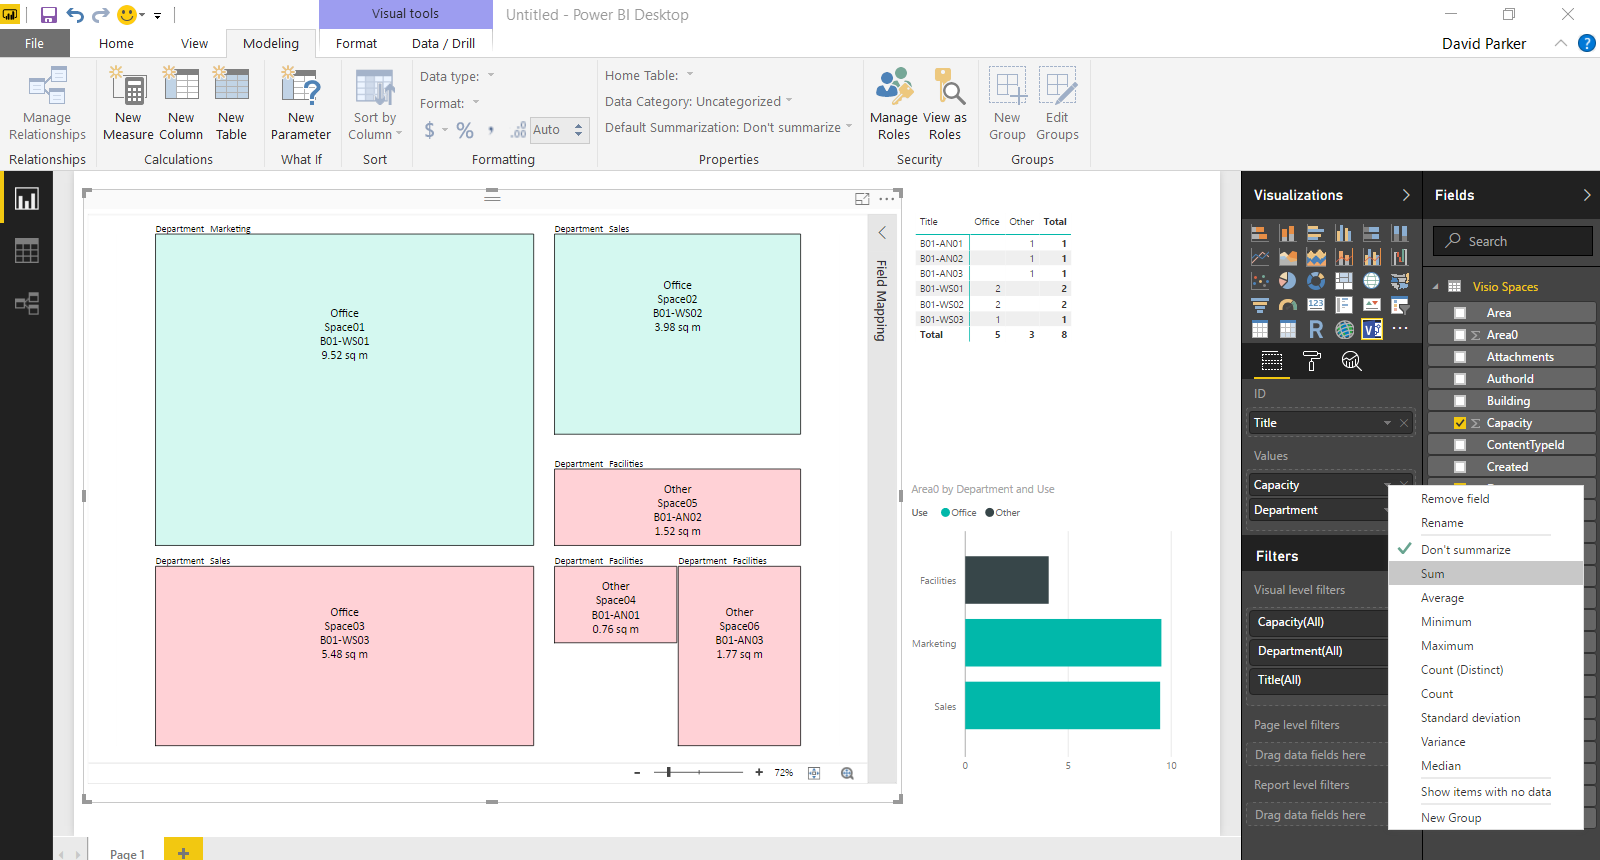
This is something that I have often grappled with because, great as Visio is for diagramming, it is not the answer in all situations. It is brilliant at connecting shapes together, and adding data to each shape, including the connector, but it would not be fantastic at displaying all the millions of data points and relationships in any graph database worth its salt. However, what if another application, such as PowerBI, could be used to analyse and filter the information down to a more manageable scale, and then export the filtered data set to Visio where it can display the relationships, and be enhanced for inclusion in reports? Although I really like PowerBI, I do not think it generally provides an output that is report quality.  Especially when reviewing the links between many nodes.
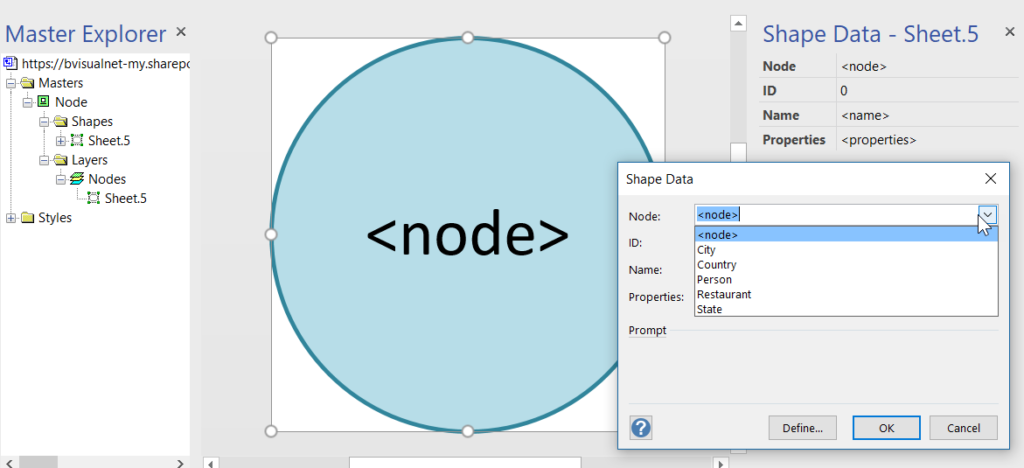
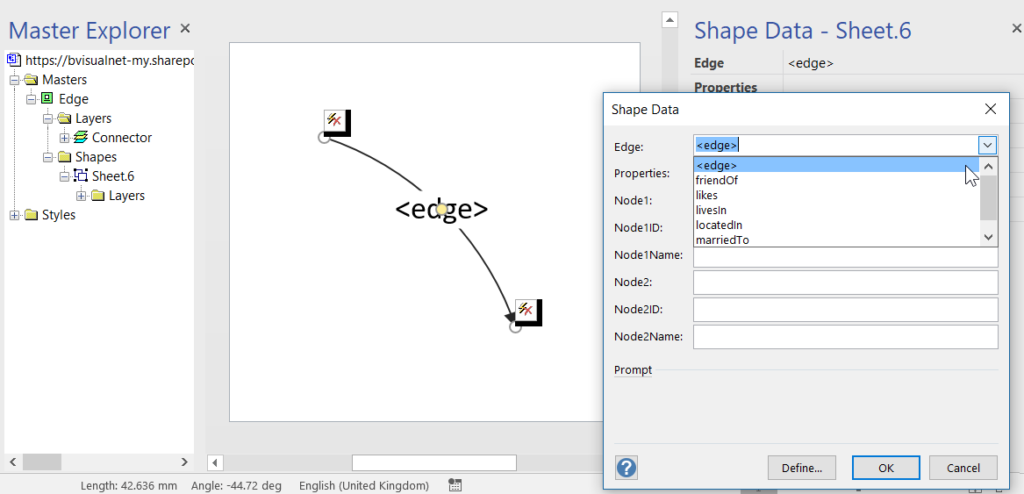
It is possible to insert data into SQL Server graph tables from csv files, but this is not always the most intuitive manner. Indeed, Andrew Fryer, whom I know to be a brilliant artist, resorts to sketching relationships freehand, and then creates tables or scripts from the diagram manually. So, what if you can use Visio to drag and drop nodes, and connect relationships between them, adding names and properties on the fly, as you go? Then, what if you could review your diagram, and then upload all of the nodes and edges to the database automatically? This process could be repeated on many pages, so that the data gets merged together in the graph database. The Visio pages can also be saved and remain available as a record of input, should any questions arise.
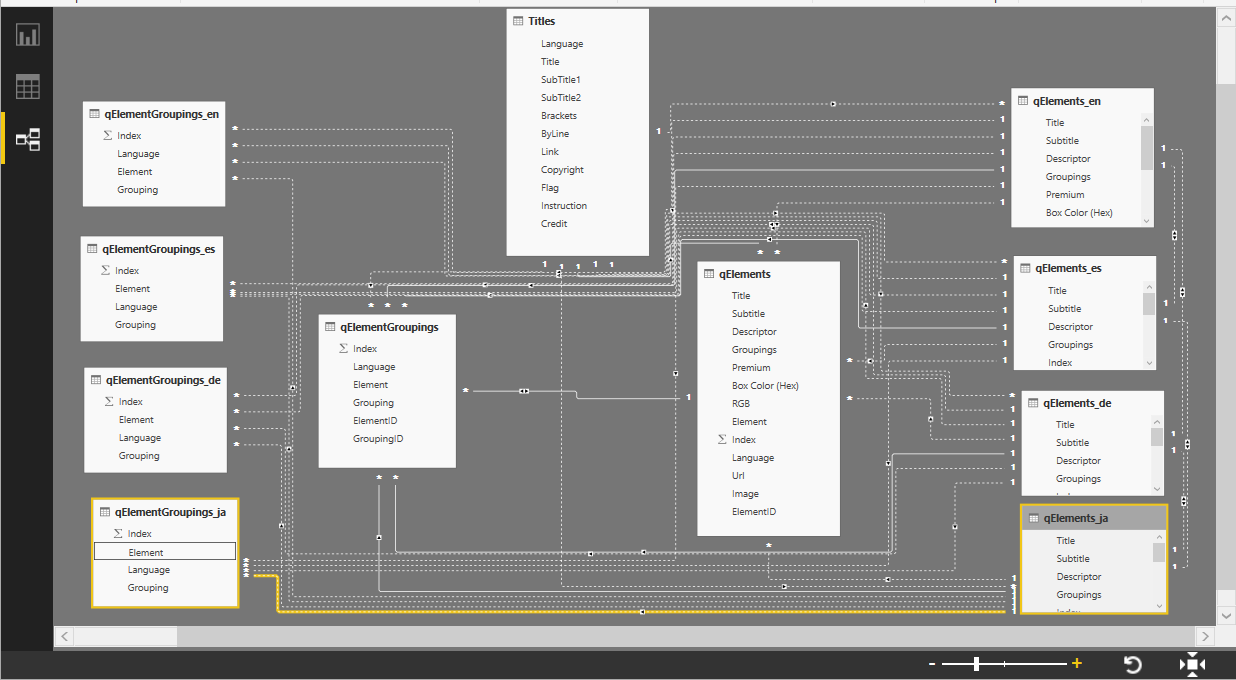
These new graph tables contain special column types that cannot be used directly by either PowerBI or Visio, so it is necessary to create views of the tables, thus effectively hiding them. I have a slight issue with the graphdemo database in the Microsoft article because it has extra columns on some Node and Edge tables. To me, this seems a little impure, and I think that the Node tables should only have an ID, Name and Properties column in addition to the Node columns, and the Edge tables should only have a Properties column in addition to the Edge columns. Ideally, the Properties columns in both tables should hold JSON data as text.
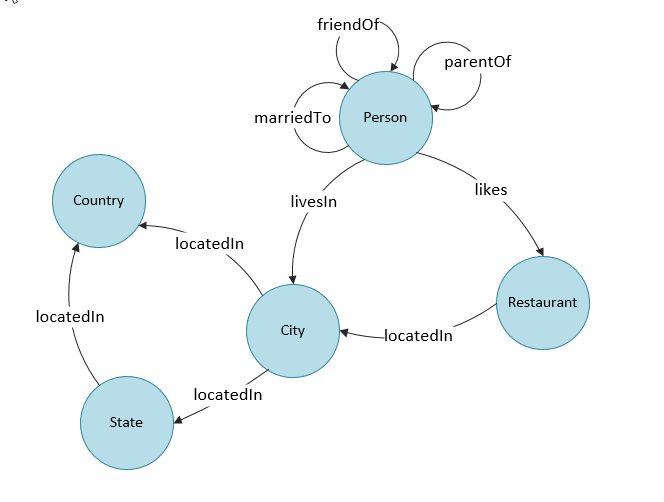
Anyway, I decided to create a proof of concept with just the basic Node and Edge attributes first. I also extended the sample database a little so I could have a bit more complexity. I decided to forget about using nice icons for now, and just keep it simple!

[Read more…] about Using Visio and PowerBI with GraphDatabase in SQLServer

Filed Under: Graph Database, PowerBI, SQL Server, Visio, Visio 2016, Visio Online Tagged With: GraphDatabase

Published on January 6, 2018 by David Parker

PowerApps in PowerBI with Visio!!!

I am very excited to see that the preview for PowerApps in PowerBI has been released ( see Announcing availability of PowerApps custom visual for Power BI (preview) ). I saw this demonstrated months ago, and have been waiting impatiently ever since. Every time I have embedded a Visio diagram into PowerBI, I have wanted to display the selected shape data in a detail view … and now I can!
I cannot yet create a PowerBI report with the embedded PowerApps visual for consumption by the whole internet, but it should still solve many scenarios for organisations. I quickly added the new PowerApps visual to my example synchronised Org Chart and Desk Layout from my previous article ( #Visio in #PowerBI for viewing personnel hierarchies and locations ) , and recorded a simple selection in the following gif:

To do this, I simply created a default new PowerApps app from the queryOrg query in  Excel workbook I created previously, and modified the Item value for the DetailForm of the DetailScreen. I removed the BrowseScreen and EditScreen because they were not required. Then, hey presto, the correct record is displayed whenever a shape is selected.

Selecting a Person.gif
[Read more…] about PowerApps in PowerBI with Visio!!!

Filed Under: PowerApps, PowerBI, Visio, Visio Online Tagged With: Excel, PowerApps, PowerQuery

Published on January 4, 2018 by David Parker

Visio in PowerBI for viewing personnel hierarchies and locations

My last article, Aliasing Data Columns for #Visio Organization Chart Wizard , mentioned the slight anomalies in the default Shape Data rows for the Organization Chart shapes and the Resources / Person shape. This prompted me to create an alternative view of the same data that can be linked to the Person shapes on a floor plan, and then to use the preview Visio Custom Visual in Power BI to display both views of personnel synchronised by the same data. This demonstrates how easy it is to create an effective dashboard for locating personnel locations and their position within an organisational hierarchy at the same time!

[Read more…] about Visio in PowerBI for viewing personnel hierarchies and locations

Filed Under: Floor Plans, Org Charts, PowerBI, Visio 2016, Visio Online Tagged With: Excel, PowerQuery, Visio

Published on September 22, 2017 by David Parker

Countdown to MSIgnite for Visio sessions

Only a couple of days to go before Microsoft Ignite conference starts here in Orlando. Yes, I am here a week early to “acclimatize” 🙂 , but I have not been idle since I will be presenting in three sessions!

[Read more…] about Countdown to MSIgnite for Visio sessions

Filed Under: Excel, MSFlow, MSIgnite, PowerBI, SharePoint, Visio, Visio Online Tagged With: MSIgnite, PowerApps

Published on September 8, 2017 by David Parker

Adding clicks to infographics with Visio visual for PowerBI

Office 365 is a truly remarkable success story, but it is often difficult to understand what each of the parts actually do, or what it is actually in each edition. Microsoft are always adding applications and services to the various editions, or retiring ones that have been superseded. If I can’t see it, I can’t understand it, so I was very interested to see the Periodic Table of Office 365 infographic created by Matt Wade, a SharePoint guru who keeps an eye on these changes ( see http://icsh.pt/O365Table ). It really helps in comprehending the current Office 365 applications and their purpose. Indeed, I have seen his graphic go through many iterations over the last few months, and it will continue to change. However, it was not clickable, and I am a visual data guy, so I contacted him, and offered to integrate his infographic into a Power BI now that the Visio custom visual is available. I then found out that there are several different language versions of his infographic out there on the web, translated by other SharePoint professionals in his network.

[Read more…] about Adding clicks to infographics with Visio visual for PowerBI

Filed Under: MSFlow, MSIgnite, Office 365, PowerBI, Visio, Visio Online Tagged With: MSIgnite, Office365, PowerApps

Published on August 16, 2017 by David Parker

Visio custom visual preview for PowerBI available for all!

Yesterday, I wrote about using #MSFlow with #Visio ( Updating data sources from #Visio using #MSFlow … easily! ), so it is fitting to announce that the Visio custom visual for PowerBI is now available from the Microsoft store, and that it works with PowerBI Desktop! This means that everyone can make use of my guidelines in my other recent article at Previewing the #Visio Custom Visual in #PowerBI !


I used the small sample file that I created for my earlier blog, but it does demonsrate how powerful these new capabilities are. The possibilities are really exciting!
By the way, the text in my Visio shapes above were not Data Graphic Text callouts, because, if they were, they would have been supressed automatically.
The support of the Visio custom visual in PowerBI desktop enables data modelling whilst testing with Visio diagrams. This is so useful!
Check out the Microsoft announcements at Office Blog post and on Facebook and Twitter.

[Read more…] about Visio custom visual preview for PowerBI available for all!

Filed Under: PowerBI, SharePoint, Visio

  • « Go to Previous Page
  • Page 1
  • Page 2
  • Page 3
  • Page 4
  • Page 5
  • Go to Next Page »

Primary Sidebar

  • LinkedIn
  • Twitter

Recent Posts

  • Fixing dimensions of 2D shapes
  • Merging Linked Data from Similar Tables
  • Smart Radio Buttons and Check Boxes in Visio
  • Using Button Face Ids in Visio
  • Grid Snapping Revisited

Categories

Tags

Accessibility Add-Ins Connectors Containers Data Export Data Graphics Data Import Data Visualizer Educational Excel GraphDatabase Hyperlinks Icon Sets JavaScript LayerManager Layers Legend Link Data to Shapes Lists MSIgnite MVP Office365 Org Chart PowerApps PowerBI PowerQuery Processes Setup and Deployment Shape Data Shape Design ShapeSheet ShapeSheet Functions SharePoint 2013 SQL Teams Validation VBA Video Visio Visio 2007 Visio for the Web Visio Online Visio Services Visio Viewer Webinar

Footer

bVisual Profile

The UK-based independent Visio consultancy with a worldwide reach. We have over 25 years experience of providing data visualization solutions to companies around the globe.

Learn more about bVisual

  • Amazon
  • E-mail
  • Facebook
  • LinkedIn
  • Twitter
  • YouTube

Search this website

Recent posts

  • Fixing dimensions of 2D shapes
  • Merging Linked Data from Similar Tables
  • Smart Radio Buttons and Check Boxes in Visio
  • Using Button Face Ids in Visio
  • Grid Snapping Revisited

Copyright © 2025 · Executive Pro on Genesis Framework · WordPress · Log in