I am on the Office Client Ask the Experts booth on Wednesday, Thursday, Friday this week in sunny Barcelona. I am hoping that there will be some enlightened IT Pros who can see the value of using Visio to analyse, plan and deploy various network and systems. I have been an an ATE booth at Tech-Ed twice before, but that was at the developers side of the conference, rather than the IT pros, and I was disappointed with the lack of understanding of the power of Visio, so I am looking forward to presenting the built-in capabilities of Visio Professional and the number of IT Pro related add-ins that have become available.
bVisual Blog by David Parker
Importing KML Files into Visio
In my last blog, I demonstrated how you can import a map image from Maps Live, and calibrate it in preparation for importing any KML files into it (Moving Between Visio and KML). In this blog, I will complete the import of KML files exported from Maps Live.
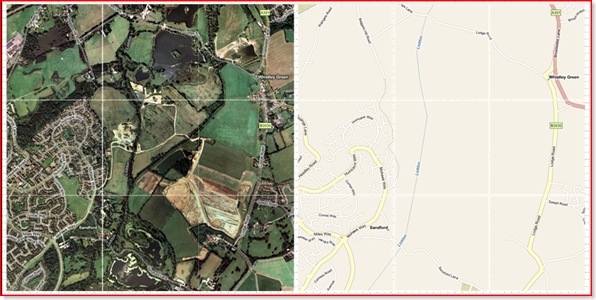
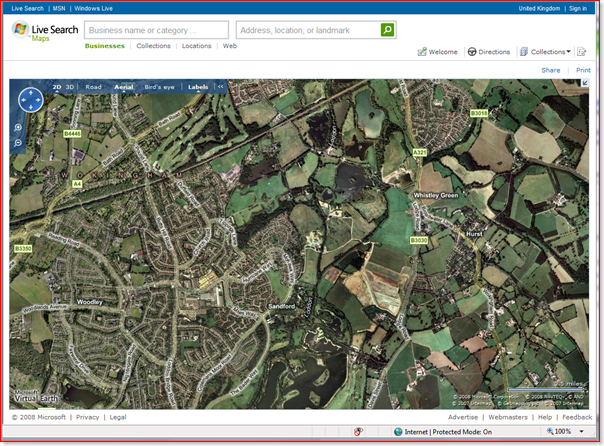
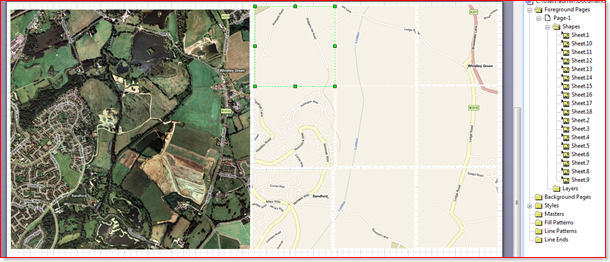
I created two base map images in Visio, side by side, so that I can demonstrate that the import can be done to any prepared image, anywhere in Visio. Of course, you could have the two images on top of each other, on different layers, so that you can switch between Road and Aerial view by just changing the visibility of their layers.
In my demonstration, I have prepared a KML file with an area (polygons), three paths (linestrings) and three pushpins (points). You may spot that there are only two shown on each map, well, that is because I have put a filter in the import to only bring in those parts that are within the map image boundary.
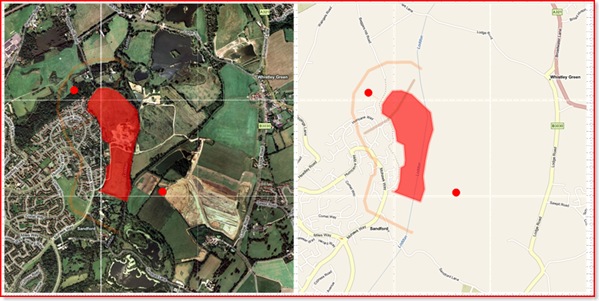
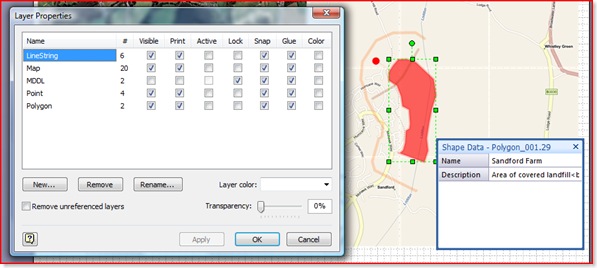
In addition to the geometry for each shape, I have added Shape Data/Custom Properties and assigned the different types of shapes on to discrete layers in Visio.
In order to convert the KML files into Visio, I had to choose how the different types of Placemarks are to be represented:
Getting the Map
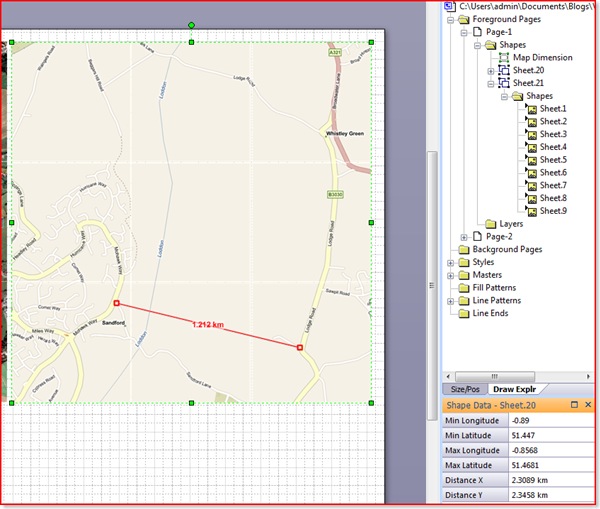
Firstly, you need to get the size and position of the selected map shape and read its Shape Data/Custom Properties in order to understand the extents of the earth under consideration. Then the only difficulty was transforming the geometry from longitudes/latitudes of each Placemark relative to the selected map shape.
If shpMap.CellExists(“Prop.MinLon”, Visio.visExistsAnywhere) = 0 Then
MsgBox “Please select a map shape”
Exit Sub
End If
Dim nod As MSXML2.IXMLDOMNode
Set nod = xdoc.SelectSingleNode(“//kml/Document/Placemark/name”)
If Not nod Is Nothing Then
setProp shpMap, “Name”, “Name”, 0, “””” & nod.Text & “”””
Else
setProp shpMap, “Name”, “Name”, 0, “”
End If
Set nod = xdoc.SelectSingleNode(“//kml/Document/Placemark/description”)
If Not nod Is Nothing Then
setProp shpMap, “Description”, “Description”, 0, “””” & nod.Text & “”””
Else
setProp shpMap, “Description”, “Description”, 0, “”
End If
Dim dWidth As Double
dWidth = shpMap.Cells(“Width”).ResultIU
Dim dHeight As Double
dHeight = shpMap.Cells(“Height”).ResultIU
Dim dLeft As Double
dLeft = shpMap.Cells(“PinX”).ResultIU – shpMap.Cells(“LocPinX”).ResultIU
Dim dBottom As Double
dBottom = shpMap.Cells(“PinY”).ResultIU – shpMap.Cells(“LocPinY”).ResultIU
Dim dMinLon As Double
dMinLon = shpMap.Cells(“Prop.MinLon”).ResultIU
Dim dMinLat As Double
dMinLat = shpMap.Cells(“Prop.MinLat”).ResultIU
Dim dMaxLon As Double
dMaxLon = shpMap.Cells(“Prop.MaxLon”).ResultIU
Dim dMaxLat As Double
dMaxLat = shpMap.Cells(“Prop.MaxLat”).ResultIU
Collecting the Styles, etc
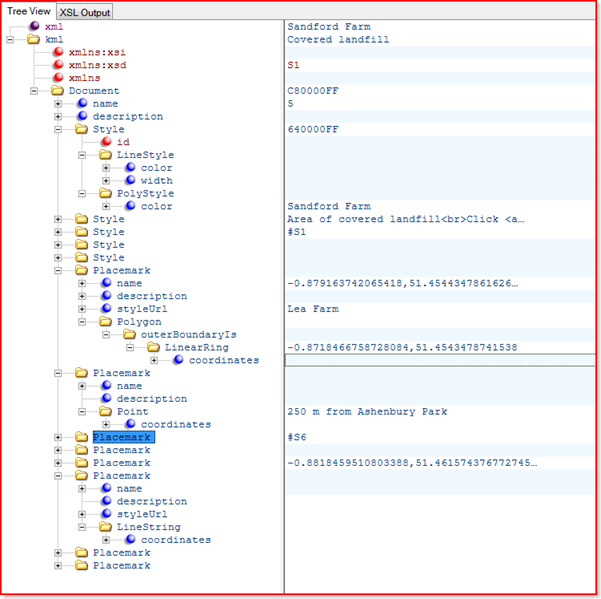
Every Placemark created by the export from Maps Live to KML has a corresponding Style element for its line color, weight and transparency and fill color and transparency. These values are stored separately within the KML file created by Maps Live (note that this is not necessary in the KML specification, and some tools do export the style information within the Placemark element).
Dim i As Integer
Dim j As Integer
Dim styles As MSXML2.IXMLDOMNodeList
Dim style As MSXML2.IXMLDOMElement
Dim dicStyles As New Dictionary
‘Collect the styles into a dictionary
Set styles = xdoc.getElementsByTagName(“Style”)
For i = 1 To styles.Length
Set style = styles.Item(i – 1)
setStyle style, dicStyles
Next i
Dim name As String
Dim description As String
Dim styleUrl As String
Dim aStyle(2) As String
Dim lineStyleColor As String
Dim lineStyleWidth As String
Dim polyStyleColor As String
Dim placemark As MSXML2.IXMLDOMElement
Dim vertexes As Variant
Dim shpNew As Visio.Shape
Dim xyArray() As Double
Areas (Polygons)
The choice of geometry type was pretty straight forward because Visio has a DrawPolyline(…) method for a Page object, so, after converting from lonlats to Visio geometry, the ShapeSheet looks something like this:
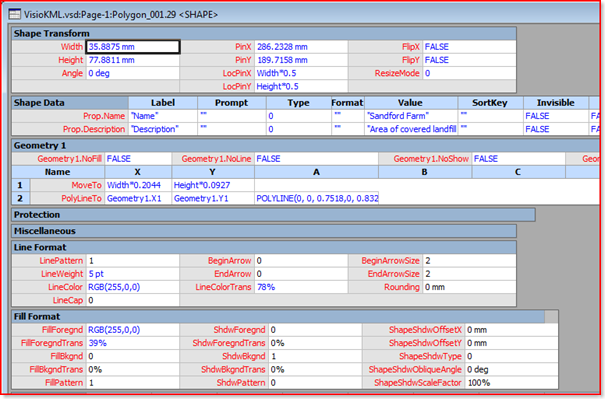
The partial code that achieves this is shown below:
Dim polygons As MSXML2.IXMLDOMNodeList
Dim polygon As MSXML2.IXMLDOMElement

    'Loop thru the polygons
Set polygons = xdoc.getElementsByTagName("Polygon")
addLayer shpMap.ContainingPage, "Polygon"
For i = 1 To polygons.Length
Set polygon = polygons.Item(i - 1)
setCoords polygon, vertexes
For j = 0 To UBound(vertexes, 2)
ReDim Preserve xyArray(1 To ((j + 1) * 2))
xyArray(((j + 1) * 2) - 1) = dLeft + ((CDbl(vertexes(0, j) - dMinLon) / (dMaxLon - dMinLon)) * dWidth)
xyArray((j + 1) * 2) = dBottom + ((CDbl(vertexes(1, j) - dMinLat) / (dMaxLat - dMinLat)) * dHeight)
Next j

        'Ensure that the shape starts or ends within the map shape
If shpMap.HitTest(xyArray(1), xyArray(2), 0) > 0 _
And shpMap.HitTest(xyArray(UBound(xyArray) - 3), xyArray(UBound(xyArray) - 2), 0) > 0 Then
Set placemark = polygon.ParentNode
setAttribs placemark, name, description, styleUrl
lineStyleColor = dicStyles(Mid(styleUrl, 2))(0)
lineStyleWidth = dicStyles(Mid(styleUrl, 2))(1)
polyStyleColor = dicStyles(Mid(styleUrl, 2))(2)
Set shpNew = shpMap.ContainingPage.DrawPolyline(xyArray, 0)
shpNew.Cells("LineColor").FormulaU = "=RGB(" & HexToDecimal(Mid(lineStyleColor, 7, 2)) & _
"," & HexToDecimal(Mid(lineStyleColor, 5, 2)) & "," & HexToDecimal(Mid(lineStyleColor, 3, 2)) & ")"
shpNew.Cells("LineColorTrans").FormulaU = "=" & CInt(HexToDecimal(Mid(lineStyleColor, 1, 2)) * 100 / 255) & " %"
shpNew.Cells("LineWeight").FormulaU = "=" & lineStyleWidth & " pt"
shpNew.Cells("FillForegnd").FormulaU = "=RGB(" & HexToDecimal(Mid(polyStyleColor, 7, 2)) & _
"," & HexToDecimal(Mid(polyStyleColor, 5, 2)) & "," & HexToDecimal(Mid(polyStyleColor, 3, 2)) & ")"
shpNew.Cells("FillForegndTrans").FormulaU = "=" & CInt(HexToDecimal(Mid(polyStyleColor, 1, 2)) * 100 / 255) & " %"
shpNew.name = "Polygon_" & Format(i, "000")
setProp shpNew, "Name", "Name", 0, """" & name & """"
setProp shpNew, "Description", "Description", 0, """" & description & """"
shpMap.ContainingPage.Layers("Polygon").Add shpNew, 0
End If
Next i
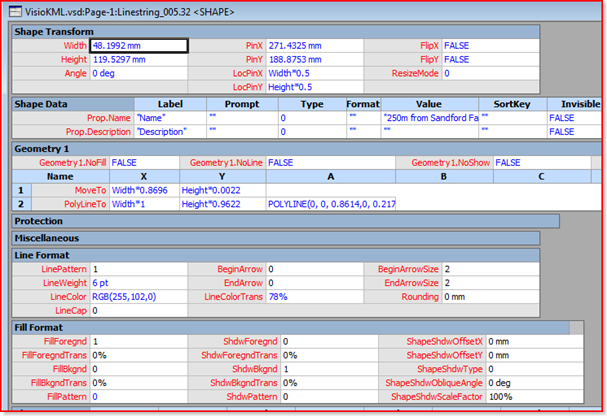
Paths (LineStrings)
I decided to use the DrawPolyline method for LineStrings too, however, I discovered there is a bug in Visio that means that a Polyline with NoFill set to True cannot be found by SpatialNeighbors. This is important because I plan to use the SpatialNeighbors function later for exporting Kml. However, I found a workaround, which is to set the NoFill to False, but to set the FillPattern to 0 (None).
Dim linestrings As MSXML2.IXMLDOMNodeList
Dim linestring As MSXML2.IXMLDOMElement

    Set linestrings = xdoc.getElementsByTagName("LineString")
addLayer shpMap.ContainingPage, "LineString"
For i = 1 To linestrings.Length
Set linestring = linestrings.Item(i - 1)
setCoords linestring, vertexes
For j = 0 To UBound(vertexes, 2)
ReDim Preserve xyArray(1 To ((j + 1) * 2))
xyArray(((j + 1) * 2) - 1) = dLeft + ((CDbl(vertexes(0, j) - dMinLon) / (dMaxLon - dMinLon)) * dWidth)
xyArray((j + 1) * 2) = dBottom + ((CDbl(vertexes(1, j) - dMinLat) / (dMaxLat - dMinLat)) * dHeight)
Next j

        'Ensure that the shape starts or ends within the map shape
If shpMap.HitTest(xyArray(1), xyArray(2), 0) > 0 _
And shpMap.HitTest(xyArray(UBound(xyArray) - 1), xyArray(UBound(xyArray)), 0) > 0 Then
Set placemark = linestring.ParentNode
setAttribs placemark, name, description, styleUrl
'Exclude the MDL shape, if present
If Not name = MDDLName Then
lineStyleColor = dicStyles(Mid(styleUrl, 2))(0)
lineStyleWidth = dicStyles(Mid(styleUrl, 2))(1)
Set shpNew = shpMap.ContainingPage.DrawPolyline(xyArray, 0)
shpNew.Cells("LineColor").FormulaU = "=RGB(" & HexToDecimal(Mid(lineStyleColor, 7, 2)) & _
"," & HexToDecimal(Mid(lineStyleColor, 5, 2)) & "," & HexToDecimal(Mid(lineStyleColor, 3, 2)) & ")"
shpNew.Cells("LineColorTrans").FormulaU = "=" & CInt(HexToDecimal(Mid(lineStyleColor, 1, 2)) * 100 / 255) & " %"
shpNew.Cells("LineWeight").FormulaU = "=" & lineStyleWidth & " pt"
shpNew.name = "Linestring_" & Format(i, "000")
setProp shpNew, "Name", "Name", 0, """" & name & """"
setProp shpNew, "Description", "Description", 0, """" & description & """"
'A Polyline with NoFill set to True cannot be found by SpatialNeighbors
shpNew.Cells("Geometry1.NoFill").FormulaU = False
shpNew.Cells("FillPattern").FormulaU = 0
shpMap.ContainingPage.Layers("LineString").Add shpNew, 0
End If
End If
Next i
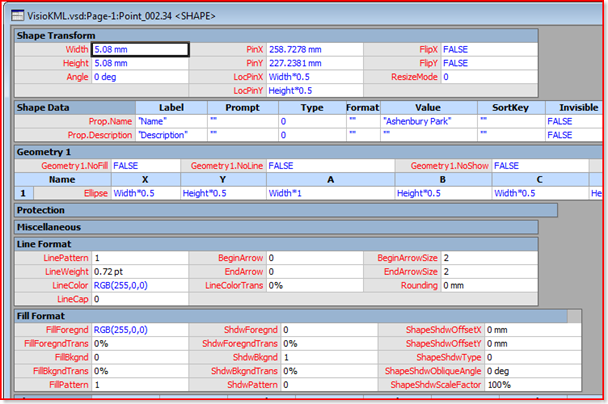
PushPins (Points)
I could have considered translating a pushpin as an instance of a Visio master, but I thought that I would keep it simple (for now) and use the DrawEllipse function. Of course, you need to do a little displacement to account for PinX/Y of the ellipse being in the centre of the shape.
Dim pins As MSXML2.IXMLDOMNodeList
Dim pin As MSXML2.IXMLDOMElement
Const PinRadius As Double = 0.1
Set pins = xdoc.getElementsByTagName(“Point”)
addLayer shpMap.ContainingPage, “Point”
For i = 1 To pins.Length
Set pin = pins.Item(i – 1)
setCoords pin, vertexes
For j = 0 To UBound(vertexes, 2)
ReDim Preserve xyArray(1 To ((j + 1) * 2))
xyArray(((j + 1) * 2) – 1) = dLeft + ((CDbl(vertexes(0, j) – dMinLon) / (dMaxLon – dMinLon)) * dWidth)
xyArray((j + 1) * 2) = dBottom + ((CDbl(vertexes(1, j) – dMinLat) / (dMaxLat – dMinLat)) * dHeight)
Next j
‘Ensure that the shape is within the map
If shpMap.HitTest(xyArray(1), xyArray(2), 0) > 0 Then
Set placemark = pin.ParentNode
setAttribs placemark, name, description, styleUrl
Set shpNew = shpMap.ContainingPage.DrawOval(xyArray(1) – PinRadius, xyArray(2) + PinRadius, _
xyArray(1) + PinRadius, xyArray(2) – PinRadius)
shpNew.Cells(“LineColor”).FormulaU = “=RGB(255,0,0)”
shpNew.Cells(“FillForegnd”).FormulaU = “=RGB(255,0,0)”
shpNew.name = “Point_” & Format(i, “000”)
setProp shpNew, “Name”, “Name”, 0, “””” & name & “”””
setProp shpNew, “Description”, “Description”, 0, “””” & description & “”””
shpMap.ContainingPage.Layers(“Point”).Add shpNew, 0
End If
Next i
Finally
Just to finish off neatly, I returned the selection to the original target map shape
Visio.ActiveWindow.DeselectAll
Visio.ActiveWindow.Select shpMap, Visio.VisSelectArgs.visSelect
Well, that completes my demonstration of how you can import KML files into Visio, although there are some refinements and additions that one can make. For example, it would be fairly trivial to create hyperlinks on each shape for any moreInfoUrl or photoUrl elements that are found.
I have uploaded the Visio file and sample KML file for downloading from : VisioKML.zip
I have started looking at creating KML files from Visio now…..
Moving Between Visio and KML
I have become increasingly concerned about using data with maps of one sort or another. The new release of SQL Server 2008 includes Spatial Data (http://www.microsoft.com/sqlserver/2008/en/us/spatial-data.aspx ) which provides the ability to map data as boundaries (polylines), multi-segment lines (linestrings) and points. Virtual Earth has also just been revamped with the 6.2 release ( http://www.microsoft.com/virtualearth/ ). There are some great articles on integrating the two together … but, as usual, I want to bring Visio into the mix too! That will enable me to use Link Data to Shapes ( see https://bvisual.net/?s=+Link+Data+to+Shapes) or even create bubble-charts.
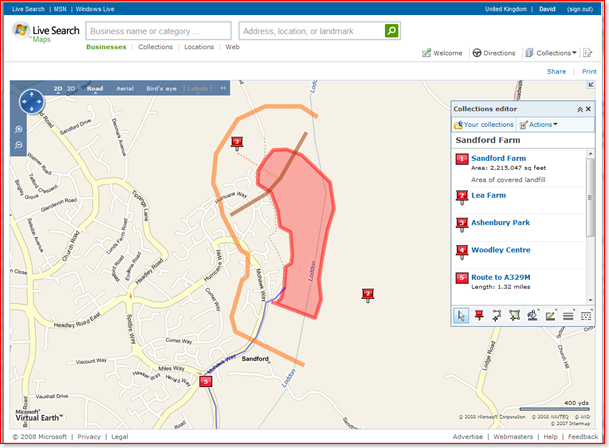
Well, actually, we could use an existing XML format for spatial data to enable Visio to read from a variety of mapping tools. Indeed, Microsoft have also started supporting KML (http://en.wikipedia.org/wiki/Kml), a format popularised by Google! Maps Live , which is powered by Virtual Earth, (http://maps.live.com/ ) allows you to export and import KML files via the collections toolset.
Getting the Shapes Collection
You can use the tools in the collections editor to draw areas (polylines) , path (linestrings) and pushpins (points).
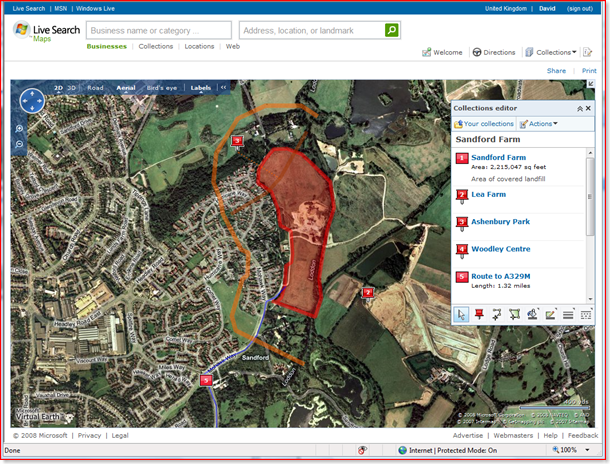
You can then use Actions / Export / KML to produce an XML file in KML format. I have XMLNotepad 2007 (free from Microsoft http://msdn.microsoft.com/en-gb/xml/default.aspx) to view the KML file below:
Getting the Map Image
This is fine for the data, but what about the map image? Well, rather than use a screen capture tool, I decided to use the Print link in Live Search Maps that opens up a new web browser window.
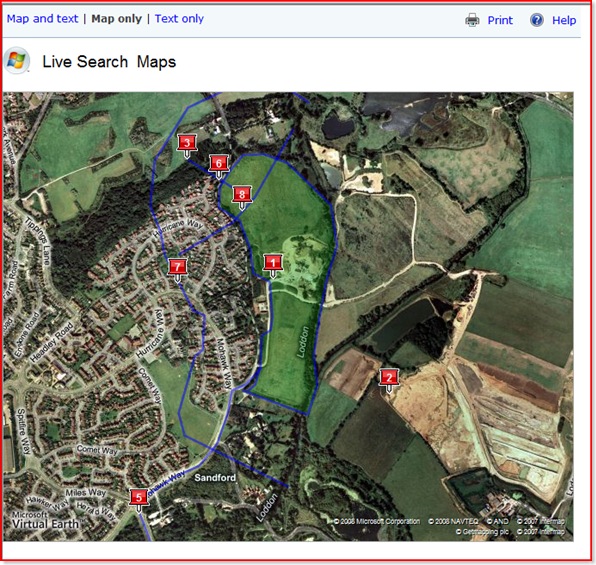
The map image is actually made up of image tiles, so you can then select each one then use the right mouse menu item Copy to paste them onto a Visio page.
Similarly, you could do the same for the Road view.
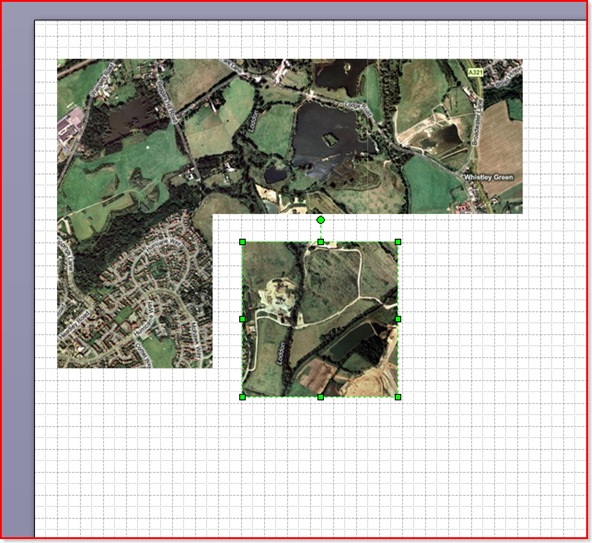
I have placed the tiles in their groups roughly on a Visio page …
Then I used a bit of VBA code (called AbutTiles) to ensure that the image tiles are properly abutted.
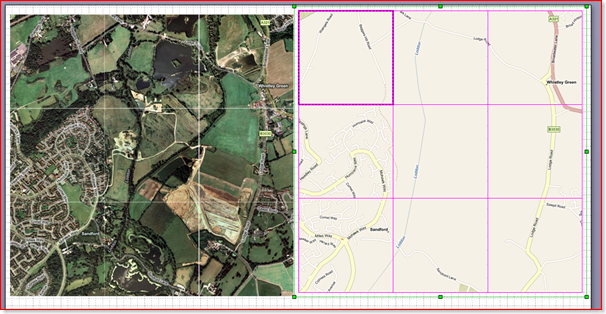
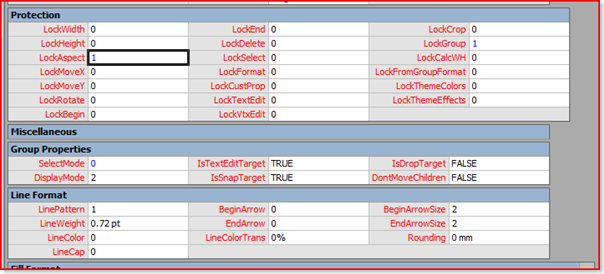
Whilst we have control of the map image(s), we could group them together, then lock the group and aspect, and change the selection mode to group only.
Public Sub AbutTiles()
If Visio.ActiveWindow.Selection.Count = 0 Then
Exit Sub
End If
Dim shp As Visio.Shape
Dim cols As Integer
Dim rows As Integer
Dim col As Integer
Dim row As Integer
Dim wdth As Double
Dim hght As Double
Dim top As Double
Dim left As Double
Dim tolerance As Double
Dim anchorShape As String
‘Assume that all shapes are same height and width
wdth = Visio.ActiveWindow.Selection.Item(1).Cells(“Width”).ResultIU
hght = Visio.ActiveWindow.Selection.Item(1).Cells(“Height”).ResultIU
tolerance = wdth * 0.3
‘Assume that the shapes were selected from top left to bottom right
For Each shp In Visio.ActiveWindow.Selection
If cols = 0 Then
cols = 1
rows = 1
col = 1
row = 1
left = shp.Cells(“PinX”).ResultIU
top = shp.Cells(“PinY”).ResultIU
anchorShape = shp.NameID
Else
If shp.Cells(“PinX”).ResultIU > (left + tolerance) Then
col = col + 1
Else
col = 1
End If
If shp.Cells(“PinY”).ResultIU < (top – tolerance) And col = 1 Then
row = row + 1
End If
If cols < col Then
cols = col
End If
If rows < row Then
rows = row
End If
shp.Cells(“PinX”).FormulaU = “=” & left + ((col – 1) * wdth)
shp.Cells(“PinY”).FormulaU = “=” & top – ((row – 1) * hght)
End If
Next
‘Finally, group them together, and protect the shape
Dim shpMap As Visio.Shape
Set shpMap = Visio.ActiveWindow.Selection.Group
shpMap.Cells(“LockGroup”).FormulaU = “=1”
shpMap.Cells(“LockAspect”).FormulaU = “=1”
shpMap.Cells(“SelectMode”).FormulaU = “=0”
End Sub
Calibrating the Map Image(s)
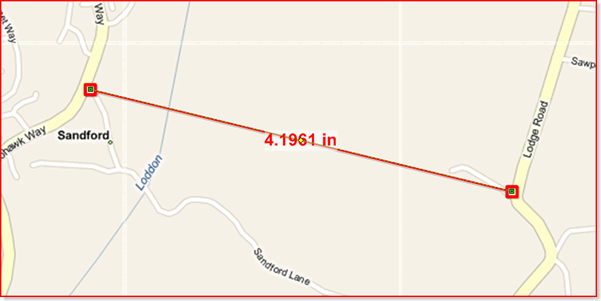
We need to ensure that we know the extent of the map image in terms of longitude and latitude in order that we can import any KML file onto it. Fortunately, my good friend Chris Roth has already pointed the way with his article Map Distance Dimension Line ( http://www.visguy.com/2007/07/13/map-distance-dimension-line/ ). Simply use Chris’s shape between two easily identifiable points on your image…
Now, repeat this action in Live Search Maps by drawing a single line between the same geographical points, then name the Map Distance Dimension Line.
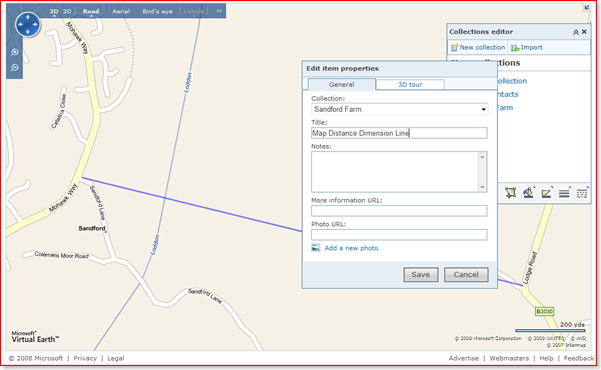
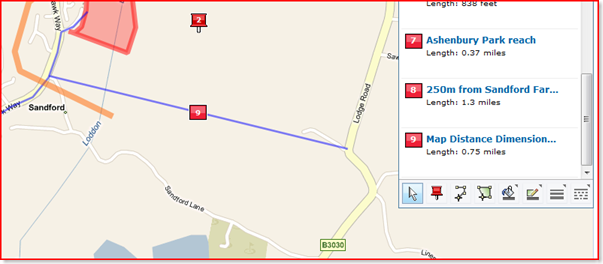
The line is then added to your collection, and so it will be there when you export the collection to KML.
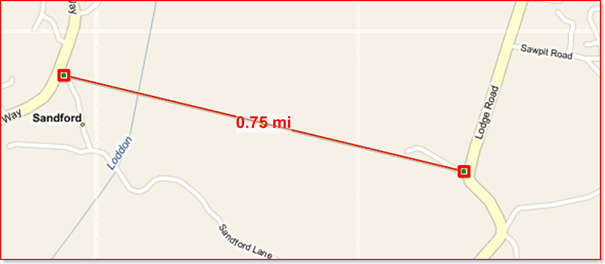
You can already enter the actual length of the line in Visio to use he Map Distance Dimension Line as described by Chris, but we are going to use it get the longitude and latitude of each end.
Importing the KML File (part 1)
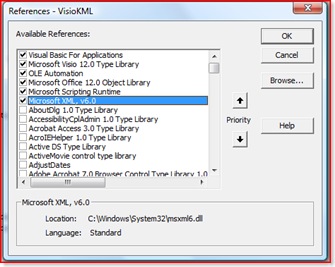
In order to parse the KML file, you will need to add a reference to Microsoft XML, and I always add Microsoft Scripting Runtime too.
Okay, now some VBA code….
Firstly, you need to select the map group shape, followed by the Map Distance Dimension Line shape before calling ReadKMLFile.
The main public Sub ReadKMLFile starts to parse the XML to get hold of the definition of the Map Distance Dimension Line so that it can be compared with the equivalent shape. It uses these two bits of information to calculate the longitude and latitude extents of the background map. These details are added the map shape, and the Map Distance Dimension Line is updated with the accurate length.
Public Sub ReadKMLFile()
‘Normally, I would use a FileOpen dialog here….
Dim kmlfile As String
kmlfile = InputBox(“Enter the path of a KML file”, “Import KML”)
If Len(kmlfile) = 0 Then
Exit Sub
ElseIf Len(Dir(kmlfile)) = 0 Then
Exit Sub
End If
Dim xdoc As MSXML2.DOMDocument
Set xdoc = New MSXML2.DOMDocument
If xdoc.Load(kmlfile) = False Then
Exit Sub
End If
Dim shpMap As Visio.Shape ‘Map Shape
If Visio.ActiveWindow.Selection.Count = 0 Then
MsgBox “Please select the map shape”
Exit Sub
Else
‘Assume that the map shape has been selected in Visio
Set shpMap = Visio.ActiveWindow.Selection.PrimaryItem
End If
‘see http://www.visguy.com/2007/07/13/map-distance-dimension-line/
Dim shpMDDL As Visio.Shape ‘Map Distance Dimension Line
Dim elmMDDL As MSXML2.IXMLDOMNode ‘Corresponding KML element
Const MDDLName As String = “Map Distance Dimension Line”
Set elmMDDL = xdoc.SelectSingleNode(“//kml/Document/Placemark[name='” & MDDLName & “‘]”)
If Not elmMDDL Is Nothing Then
‘There is a calibration node,
‘so there should be two shapes selected Map + MDDL
If Visio.ActiveWindow.Selection.Count <> 2 Then
MsgBox “Please select the map then the MDL shape”
Exit Sub
Else
Set shpMDDL = Visio.ActiveWindow.Selection.Item(2)
calibrateMap shpMap, shpMDDL, elmMDDL
End If
End If
End Sub
Private Sub calibrateMap(ByVal shpMap As Visio.Shape, _
ByVal shpMMDL As Visio.Shape, ByVal elmMDDL As MSXML2.IXMLDOMNode)
‘shpMap vars
Dim dWidth As Double
Dim dHeight As Double
Dim dX As Double
Dim dY As Double
Dim dXLeft As Double
Dim dYTop As Double
Dim dXRight As Double
Dim dYBottom As Double
Dim dLonLeft As Double
Dim dLatTop As Double
Dim dLonRight As Double
Dim dLatBottom As Double
‘shpMMDL vars
Dim dPinXBegin As Double
Dim dPinYBegin As Double
Dim dPinXEnd As Double
Dim dPinYEnd As Double
Dim dLength As Double
‘elemMMDL vars
Dim vertexes As Variant
Dim dLonBegin As Double
Dim dLatBegin As Double
Dim dLonEnd As Double
Dim dLatEnd As Double
Dim dDistance As Double ‘KM
‘Scale factor
Dim dRatio As Double
Dim dXRatio As Double
Dim dYRatio As Double
Dim i As Integer
‘Get map shape values
dWidth = shpMap.Cells(“Width”).ResultIU
dHeight = shpMap.Cells(“Height”).ResultIU
dXLeft = shpMap.Cells(“PinX”).ResultIU – shpMap.Cells(“LocPinX”).ResultIU
dYBottom = shpMap.Cells(“PinY”).ResultIU – shpMap.Cells(“LocPinY”).ResultIU
dYTop = dYBottom + dHeight
dXRight = dXLeft + dWidth
‘Get MMDL shape
dPinXBegin = shpMMDL.Cells(“BeginX”).ResultIU
dPinYBegin = shpMMDL.Cells(“BeginY”).ResultIU
dPinXEnd = shpMMDL.Cells(“EndX”).ResultIU
dPinYEnd = shpMMDL.Cells(“EndY”).ResultIU
dLength = shpMMDL.LengthIU
setCoords elmMDDL, vertexes
dLonBegin = vertexes(0, 0)
dLonEnd = vertexes(0, 1)
dLatBegin = vertexes(UBound(vertexes), 0)
dLatEnd = vertexes(UBound(vertexes), 1)
If shpMMDL.CellExists(“Prop.CurrentSize”, Visio.visExistsAnywhere) Then
shpMMDL.Cells(“Prop.CurrentSize”).FormulaU = “=” & getKMFromDegreesDisp(dLatBegin, dLonBegin, dLatEnd, dLonEnd) & ” km”
End If
dDistance = Sqr((dLonEnd – dLonBegin) ^ 2 + (dLatEnd – dLatBegin) ^ 2)
dRatio = dDistance / dLength
dXRatio = (dLonEnd – dLonBegin) / (dPinXEnd – dPinXBegin)
dYRatio = (dLatEnd – dLatBegin) / (dPinYEnd – dPinYBegin)
dLonLeft = dLonBegin – ((dPinXBegin – dXLeft) * dXRatio)
dLonRight = dLonLeft + (dWidth * dXRatio)
dLatBottom = dLatBegin – ((dPinYBegin – dYBottom) * dYRatio)
dLatTop = dLatBottom + (dHeight * dYRatio)
setProp shpMap, “MinLon”, “Min Longitude”, “2”, CStr(dLonLeft)
setProp shpMap, “MinLat”, “Min Latitude”, “2”, CStr(dLatBottom)
setProp shpMap, “MaxLon”, “Max Longitude”, “2”, CStr(dLonRight)
setProp shpMap, “MaxLat”, “Max Latitude”, “2”, CStr(dLatTop)
setProp shpMap, “DistanceX”, “Distance X”, “2”, CStr(getKMFromDegreesDisp(dLatBottom, dLonLeft, dLatBottom, dLonRight)) & ” km”
setProp shpMap, “DistanceY”, “Distance Y”, “2”, CStr(getKMFromDegreesDisp(dLatBottom, dLonLeft, dLatTop, dLonLeft)) & ” km”
Dim hLink As String
Dim elv As Integer
elv = 14
Dim dLonCntr As Double
dLonCntr = (dLonLeft + dLonRight) * 0.5
Dim dLatCntr As Double
dLatCntr = (dLatTop + dLatBottom) * 0.5
hLink = “http://maps.live.com/default.aspx?cp=” & Format(dLatCntr, “0.000000”) & “%7c” & Format(dLonCntr, “0.000000”) & “&style=h&lvl=” & elv & “&v=1”
setHLink shpMap, “Map”, “1”, “Show in Windows Live Local”, “1”, hLink
End Sub
Private Function pi() As Double
pi = 22 / 7
End Function
Private Function atan2(ys, xs)
‘ Given y and x coords returns atan2
‘ by Jim Deutch, Syracuse, New York
‘http://www.accessmonster.com/Uwe/Forum.aspx/access/102224/SQRT-and-ATAN2-functions-to-MS-Access-2007
Dim theta
If xs <> 0 Then
theta = Atn(ys / xs)
If xs < 0 Then
theta = theta + pi()
End If
Else
If ys < 0 Then
theta = 3 * pi() / 2 ’90
Else
theta = pi() / 2 ‘270
End If
End If
atan2 = theta
End Function
Public Function getKMFromDegreesDisp(ByVal Lat1 As Double, ByVal Long1 As Double, _
ByVal Lat2 As Double, ByVal Long2 As Double) As Double
Dim dDistance As Double
dDistance = 0
Dim dLat1InRad As Double
dLat1InRad = Lat1 * (pi() / 180)
Dim dLong1InRad As Double
dLong1InRad = Long1 * (pi() / 180)
Dim dLat2InRad As Double
dLat2InRad = Lat2 * (pi() / 180)
Dim dLong2InRad As Double
dLong2InRad = Long2 * (pi() / 180)
Dim dLongitude As Double
dLongitude = dLong2InRad – dLong1InRad
Dim dLatitude As Double
dLatitude = dLat2InRad – dLat1InRad
Dim a As Double
a = (Sin(dLatitude / 2) ^ 2) + Cos(dLat1InRad) * Cos(dLat2InRad) * (Sin(dLongitude / 2) ^ 2)
Dim c As Double
c = 2 * atan2(Sqr(a), Sqr(1 – a))
Const kEarthRadiusKms As Double = 6376.5
dDistance = kEarthRadiusKms * c
getKMFromDegreesDisp = dDistance
End Function
Private Function HexToDecimal(ByVal HexString As String) As Long
Dim x As Long
Dim vDec As Variant
vDec = CDec(0) ‘ decimal type supports up to 27 or 28 positions
For x = 1 To Len(HexString)
vDec = vDec * 16 + CDec(“&H” & Mid$(HexString, x, 1))
Next x
HexToDecimal = vDec
End Function
Private Sub setProp(ByVal shp As Visio.Shape, _
ByVal name As String, ByVal label As String, _
ByVal ptype As String, ByVal value As String)
Dim iRow As Integer
If shp.SectionExists(Visio.visSectionProp, Visio.visExistsAnywhere) = 0 Then
shp.AddSection Visio.visSectionProp
End If
If shp.CellExistsU(“Prop.” & name, Visio.visExistsAnywhere) = 0 Then
iRow = shp.AddNamedRow(Visio.visSectionProp, name, 0)
shp.CellsSRC(Visio.visSectionProp, iRow, Visio.visCustPropsLabel).Formula = “=””” & label & “”””
shp.CellsSRC(Visio.visSectionProp, iRow, Visio.visCustPropsType).Formula = “=” & ptype
Else
iRow = shp.Cells(“Prop.” & name).row
End If
shp.CellsSRC(Visio.visSectionProp, iRow, Visio.visCustPropsValue).Formula = “=” & value
End Sub
Private Sub setHLink(ByVal shp As Visio.Shape, _
ByVal name As String, ByVal default As String, _
ByVal description As String, ByVal newwin As String, _
ByVal address As String)
Dim iRow As Integer
If shp.SectionExists(Visio.visSectionHyperlink, Visio.visExistsAnywhere) = 0 Then
shp.AddSection Visio.visSectionHyperlink
End If
If shp.CellExistsU(“Hyperlink.” & name, Visio.visExistsAnywhere) = 0 Then
iRow = shp.AddNamedRow(Visio.visSectionHyperlink, name, 0)
shp.CellsSRC(Visio.visSectionHyperlink, iRow, Visio.visHLinkDefault).Formula = “=” & default
shp.CellsSRC(Visio.visSectionHyperlink, iRow, Visio.visHLinkDescription).Formula = “=””” & description & “”””
shp.CellsSRC(Visio.visSectionHyperlink, iRow, Visio.visHLinkNewWin).Formula = “=” & newwin
Else
iRow = shp.Cells(“Hyperlink.” & name).row
End If
shp.CellsSRC(Visio.visSectionHyperlink, iRow, Visio.visHLinkAddress).Formula = “=””” & address & “”””
End Sub
Private Sub setStyle(ByVal elem As MSXML2.IXMLDOMElement, _
ByRef dicStyles As Dictionary)
Dim id As String
Dim lineStyleColor As String
Dim lineStyleWidth As String
Dim polyStyleColor As String
Dim aStyle(2) As String
Dim i As Integer
Dim elemsub As MSXML2.IXMLDOMElement
Dim attr As String
id = elem.Attributes(0).Text
Set elemsub = elem.SelectSingleNode(“LineStyle”)
For i = 1 To elemsub.ChildNodes.Length
attr = elemsub.ChildNodes.Item(i – 1).nodeName
Select Case attr
Case “color”
aStyle(0) = elemsub.ChildNodes.Item(i – 1).Text
Case “width”
aStyle(1) = elemsub.ChildNodes.Item(i – 1).Text
End Select
Next i
Set elemsub = elem.SelectSingleNode(“PolyStyle”)
For i = 1 To elemsub.ChildNodes.Length
attr = elemsub.ChildNodes.Item(i – 1).nodeName
Select Case attr
Case “color”
aStyle(2) = elemsub.ChildNodes.Item(i – 1).Text
End Select
Next i
dicStyles.Add id, aStyle
End Sub
Private Sub setCoords(ByVal elem As MSXML2.IXMLDOMElement, _
ByRef vertices As Variant)
Dim coordinates As String
Dim coords As MSXML2.IXMLDOMNodeList
Dim vertexes() As String
Dim vertex() As String
Dim vtcs() As Double
Dim i As Integer
Set coords = elem.getElementsByTagName(“coordinates”)
If coords.Length > 0 Then
coordinates = coords(0).Text
vertexes = Split(coordinates, ” “)
For i = 0 To UBound(vertexes)
vertex = Split(vertexes(i), “,”)
ReDim Preserve vtcs(1, i)
vtcs(0, i) = vertex(0)
vtcs(1, i) = vertex(1)
Next i
vertices = vtcs
End If
End Sub
Private Sub setAttribs(ByVal placemark As MSXML2.IXMLDOMElement, _
ByRef name As String, ByRef description As String, _
ByRef styleUrl As String)
Dim attr As String
Dim i As Integer
name = “”
description = “”
styleUrl = “”
For i = 1 To placemark.ChildNodes.Length
attr = placemark.ChildNodes.Item(i – 1).nodeName
Select Case attr
Case “name”
name = placemark.ChildNodes.Item(i – 1).Text
Case “description”
description = placemark.ChildNodes.Item(i – 1).Text
Case “styleUrl”
styleUrl = placemark.ChildNodes.Item(i – 1).Text
End Select
Next i
End Sub
So, the result of the first bit of code is a new group shape that contains all of the map tile images, and it has shape data/custom properties for the extents of the world that it covers, and it has a hyperlink to open Maps Live to the centre of it!
Next, we’ll import the rest of the shapes….
Updating Visio SharePoint Hyperlinks in Code
In last month’s entry, I showed how you can connect Visio timelines to SharePoint calendars, but I was unable to provide VBA code for automatically update the hyperlinks because my laptop had some issues. Well, a month later, after a holiday and a back injury, I have provided some VBA code below that enables the hyperlinks to become usable with the SharePoint calendar used in the example.
Public Sub AmendLinks()
Const urlCell As String = “_VisDM_Encoded_Absolute_URL”
Const idProp As String = “Prop._VisDM_ID”
Const idProp As String = “Prop._VisDM_ID”
Dim shp As Visio.Shape
Dim pag As Visio.Page
Dim i As Integer
Dim urlOld As String
Dim id As String
Dim urlNew As String
Dim pag As Visio.Page
Dim i As Integer
Dim urlOld As String
Dim id As String
Dim urlNew As String
For Each pag In Visio.ActiveDocument.Pages
For Each shp In pag.Shapes
If shp.CellExistsU(“Prop.” & urlCell, Visio.visExistsAnywhere) _
And shp.CellExistsU(idProp, Visio.visExistsAnywhere) Then
urlOld = shp.Cells(“Prop.” & urlCell).ResultStr(“”)
id = shp.Cells(idProp).ResultStr(“”)
urlNew = Left(urlOld, Len(urlOld) – 5 – Len(Format(id, “#”))) & “DispForm.aspx?ID=” & Format(id, “#”)
shp.Cells(“Hyperlink.” & urlCell & “.Address”).FormulaU = “=””” & urlNew & “”””
End If
Next shp
Next pag
End Sub
Hyperlinks to SharePoint Lists from Visio Shapes
My previous post showed how to link Visio Timelines to a SharePoint Calendar ( http://bvisual.spaces.live.com/blog/cns!3350D61BC93733A9!552.entry ), and I glibbly mentioned how you can create hyperlinks automatically on the shapes from the SharePoint list. Well, that was true, but the example shown goes to a SharePoint page, and it didn’t work. So, I feel I need to demonstrate a fix for it.

[Read more…] about Hyperlinks to SharePoint Lists from Visio Shapes
Using SharePoint Calendars with Visio Timelines
I was recently asked if it is possible to use SharePoint calendars with Visio Timeline Shapes automatically. My first reaction was “not without code”, but a closer inspection reveals that you can use Visio 2007 Professional Link Data to Shapes quite easily….
Firstly, I found the WSS Demo site http://www.wssdemo.com/application/default.aspx to be useful. [This is no longer available]
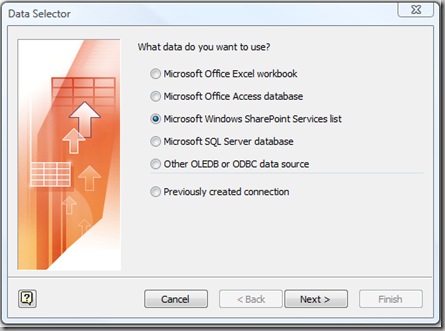
In Visio 2007 Professional, you can use Data / Link Data to Shapes … to get data from Microsoft Windows SharePoint Services: