• Skip to main content
  • Skip to primary sidebar
  • Skip to footer

bVisual

  • Home
  • Services
    • How Visio smartness can help your business
    • Visio visual in Power BI
    • Visio Consulting Services
    • Visio Bureau Services
    • Visio Training and Support Services
  • Products
    • Visio Shape Report Converter
    • SS Plus
    • LayerManager
    • visViewer
    • Metro Icons
    • Rules Tools for Visio
    • The Visio 2010 Sessions App
    • Multi-Language Text for Visio
    • Document Imager for Visio
    • multiSelect for Visio
    • pdSelect for Visio
  • Case Studies
    • Case studies overview
    • Using Visio in Education for GIS
    • Visualizing Construction Project Schedules
    • Visio Online Business Process Mapping
    • Nexans Visio Template
    • CNEE Projects, WorldCom
    • Chase Manhattan Bank
  • News
    • Recent news
    • News archive
  • Resources
    • Articles➡
      • ShapeSheet Functions A-Z
      • Comparing Visio for the Web and Desktop
      • Customising Visio Shapes for the Web App
      • Key differences between the Visio desktop and web apps
      • Using the Visio Data Visualizer in Excel
      • Using Visio in Teams
      • Creating Visio Tabs and Apps for Teams with SharePoint Framework (SPFx)
      • Designing Power Automate Flows with Microsoft Visio
      • Innovative uses of Visio Lists
    • Webcasts ➡
      • Visio in Organizations
      • My session and other Visio sessions at MSIgnite 2019
      • Power up your Visio diagrams
      • Vision up your Visio diagrams
      • The Visio 2010 MVP Sessions
    • Visio Web Learning Resources
    • Books➡
      • Visualize Complex Processes with Microsoft Visio
      • Mastering Data Visualization with Microsoft Visio
      • Microsoft Visio Business Process Diagramming and Validation
      • Visualizing Information with Microsoft Visio
  • Blog
    • Browse blog articles
    • Visio Power BI articles
    • Visio for Web articles
    • A history of messaging and encryption
  • About us
    • About bVisual
    • Testimonials
    • Bio of David Parker
    • Contact Us
    • Website Privacy Policy
    • Website terms and conditions
    • Ariba Network
You are here: Home / Diagram Types / Geographic / UK Counties and Boroughs Map Shapes for Visio

Published on April 4, 2008 by David Parker

UK Counties and Boroughs Map Shapes for Visio

My friend and colleague, Chris Roth, has made lots of maps available in Visio, his latest being Germany ( http://www.visguy.com/2008/03/01/map-of-germany/ ).  Well, we Brits hate being outdone by a German-American, so I have decided to make my UK Map shapes for Visio publicly available at UK Geography Structure.vsd .

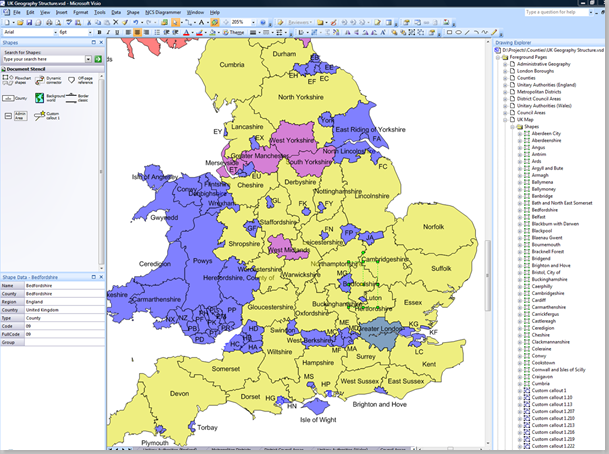
I created the UK map several years ago by converting from PDF to SVG to Visio, and each of the counties and boroughs have a single rectangular Master, Admin Area.  I used code to replace the rectangle geometry with the actual shape geometry.  This means that, although they are all different, they have the same Master, thus making it easier to propagate any changes, such as Shape Data rows.

image

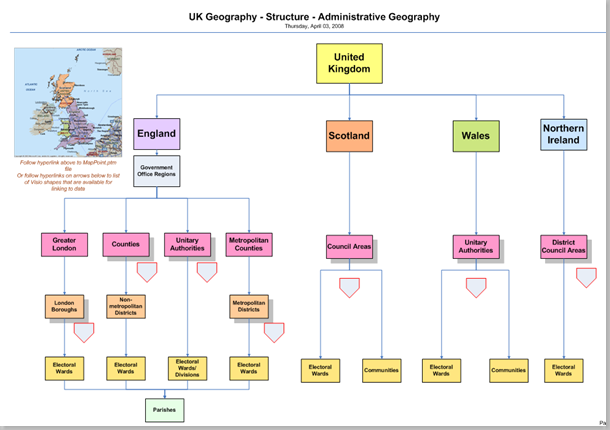
The download is a multi-page document of over 3mb, so be warned, and it also includes a chart of the breakdown of the UK Administrative Areas.

image

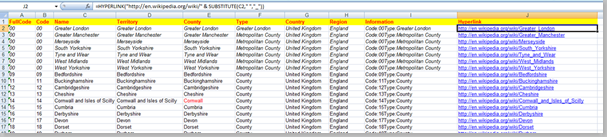
The Admin Area (and County) shapes are linked to the Excel spreadsheet (UK Counties and Unitary Authorities.xlsx), UK Counties and Unitary Authorities.xlsx, which contains columns of data about each area, and provides an hyperlink  Notice the formula to concatenate two strings):

=HYPERLINK(“http://en.wikipedia.org/wiki/” & SUBSTITUTE(C2,” “,”_”))

image

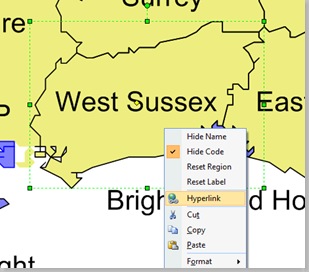
I found out that the Visio 2007 Professional LinkData to Shapes function automatically thinks that values with “xxx:” at the start are hyperlinks, so I had to uncheck the Hyperlink setting for the Information column.  (Interestingly, “Code:xxxx” opens op Lutz Roeder’s Reflector app on my PC!)

image

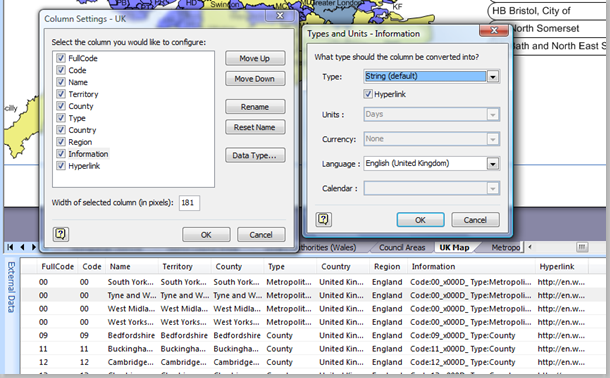
After making this change, I was able to Automatically Link the data to the shapes where Name = Name, and end up with a hyperlink that points to the Wikipedia for the region.

image

NB.  I was going to use the Visio 2007 Professional Color By Value to automatically fill the regions, but I discovered that there is currently a 100 discrete value limit…so, I have used the Space Plan Color By Value legends – that does not have the limit!  Maybe next version…

Enjoy!

Related

Filed Under: External Data, Geographic, Shape Data, Visio

About David Parker

David Parker has 25 years' experience of providing data visualization solutions to companies around the globe. He is a Microsoft MVP and Visio expert.

Reader Interactions

Comments

  1. Chris says

    April 4, 2008 at 11:24 am

    David,
     
    This is really cool stuff! I’ve been trying to think of useful and informative ways to extend the popular map downloads on Visio Guy, but it looks like the North side of the ‘Channel is there first. I like the tie-in with the organisational structure and the links to wikipedia. Maybe I’ll hook all my shapes to on-line satellite maps using the data features.
     
    Again, really nice stuff!
     
    – Chris 

    Reply
  2. Pete says

    March 8, 2012 at 10:59 am

    Great map and very useful, thank you!

    Reply

Leave a Reply Cancel reply

Your email address will not be published. Required fields are marked *

Primary Sidebar

  • LinkedIn
  • Twitter

Recent Posts

  • Fixing dimensions of 2D shapes
  • Merging Linked Data from Similar Tables
  • Smart Radio Buttons and Check Boxes in Visio
  • Using Button Face Ids in Visio
  • Grid Snapping Revisited

Categories

Tags

Accessibility Add-Ins Connectors Containers Data Export Data Graphics Data Import Data Visualizer Educational Excel GraphDatabase Hyperlinks Icon Sets JavaScript LayerManager Layers Legend Link Data to Shapes Lists MSIgnite MVP Office365 Org Chart PowerApps PowerBI PowerQuery Processes Setup and Deployment Shape Data Shape Design ShapeSheet ShapeSheet Functions SharePoint 2013 SQL Teams Validation VBA Video Visio Visio 2007 Visio for the Web Visio Online Visio Services Visio Viewer Webinar

Footer

bVisual Profile

The UK-based independent Visio consultancy with a worldwide reach. We have over 25 years experience of providing data visualization solutions to companies around the globe.

Learn more about bVisual

  • Amazon
  • E-mail
  • Facebook
  • LinkedIn
  • Twitter
  • YouTube

Search this website

Recent posts

  • Fixing dimensions of 2D shapes
  • Merging Linked Data from Similar Tables
  • Smart Radio Buttons and Check Boxes in Visio
  • Using Button Face Ids in Visio
  • Grid Snapping Revisited

Copyright © 2025 · Executive Pro on Genesis Framework · WordPress · Log in