Microsoft Office Visio has had an Org Chart Wizard for as long as I can remember (and I have been using Visio since 1996). It has gone through several iterations, but basically it provides a simple way to create personnel hierarchies from a variety of data sources. It even has a command line interface so that the charts can be created with a minimum of user interaction. This is great, but it is limited. Firstly, it does not take advantage of the new Link Data to Shapes and Data Graphics in Visio 207 Professional; secondly, it only does direct reports with just one type of layout; and thirdly, you cannot refresh the diagram easily. Therefore, I thought it would be interesting to overcome some of these obstacles using the new features of Visio 2007 Professional and with a little code.
Visio installs a sample OrgData.xls Excel spreadsheet in the folder <Program Files>Microsoft OfficeOffice12SAMPLES1033 by default, so I have copied this file and slightly amended it.
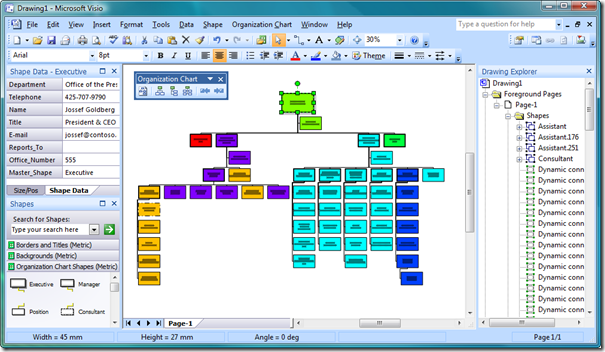
There are plenty resources on the web to help you use the built-in Org Chart Wizard in Visio, for example : About Organization Chart Wizard data and Create an Organization Chart in Visio . If you follow these in instructions, then you can produce a chart similar to the one shown below. I have used Color By Value to automatically fill the shapes with different colors by Department.
Applying more than the Color By Value Data Graphic can be problematical because these shapes are rigorously controlled by the OrgChart addon, and I have often seen questions about modifying the appearance or layout in the newsgroups. Customization is also complicated by the fact that there are many master shapes in the stencil, each of which can be changed to look like one of the other. For example, an Executive can become a Consultant, or a Position can become a Manager. This is done with the Change Position Type tool, but this does not magically swap one shape for another, but it just changes a property that changes the shapes appearance. You may think that this is not a problem, except that any customization requires that it be done to all of the master shapes, not just one.
I slightly modified the spreadsheet to insert “mailto:” before the email address. This will enable Link Data to Shapes to automatically understand that it is a hyperlink and create one on each shape.
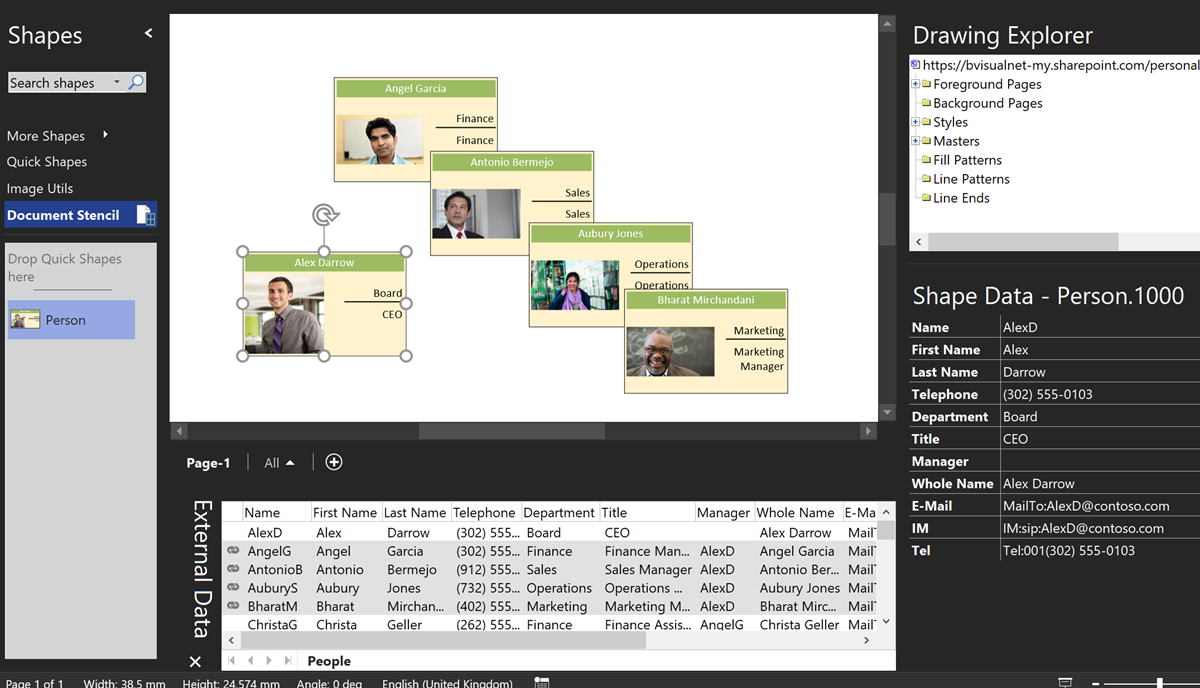
I used Link Data to Shapes to a display the spreadsheet in an External Data Window in Visio. Then I simply drew an ellipse and modified its fill, line and shading before dragging one of the records onto it.
Once there is some data on the shape, you can use the Data Graphics in Visio 2007 Professional. I linked the Department to Color By Value again; Master_Shape to the built-in face icons, the Office_Number to a circle at the bottom, and Title, Name and Department as three lines of text in the center of the shape. The MailTo values automatically create an hyperlink on each shape, as hoped.
After showing the Document Stencil, I dragged the shape onto it, and named the new Master as Person.
You can then use this Person master to drag and drop the records from the External Data Window onto the Visio page. Interesting, but not a very pretty organization chart.
Now comes the clever(ish) bit. The data recordset in the External Data Window is accessible by code. Therefore, you can loop through the records, get the employee name, then check which other employees report to this employee. Having got the sub-ordinate employees, you can add a connector between them.
Just for good measure, I take the opportunity to name the shapes, as I loop through them. This makes the Drawing Explorer Window usable.
The download includes the ConnectSubordinates sub routine in the ConnectShapes module with its support functions, getColumnIndexByName; and IsArrayAllocated.
So, now we have a connected diagram. Not very pretty, yet, but it is connected.
You can manually use Shape / Configure Layout to alter the appearance of the chart
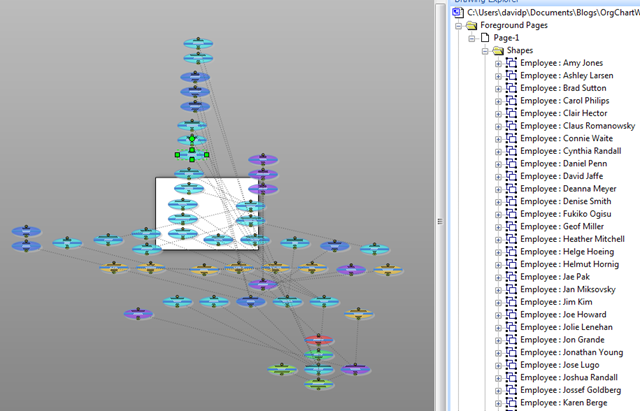
Alternatively, you can automate the layout with code. I have included macros in the LayoutShapes module for changing the appearance in the download, for example, LayoutPageCircular creates a diagram like this:
You can now choose the type of chart to suit your requirements, and, of course, Visio will automatically optimize the layout if you add in extra matrix reporting.
I have included a short macro, DeleteConnectors, so that the links can be recreated when the data is refreshed. Of course, all of this can be fully automated, along with publishing to the web, PDF or Xps.
The sample files can be downloaded from here:
Visio : Link Data OrgChart.vsd
Excel : OrgData.xls
Visio 2010 MVP Session videos reprise
Back in 2012, my fellow Visio MVPs, Scott Helmers and Chris Roth, and I recorded a series of 24 videos about Visio 2010. They were first hosted on Microsoft’s web site, then they put them up on YouTube, they they got deleted :-(. Well, we have managed to retrieve them, and put them back up…
Using Visio Org Chart Wizard to work with Exchange Online
I have used the Microsoft Visio Organization Chart Wizard many, many times over the years, but I usually use it from text files, and I had been aware that I was not getting good results from the Microsoft Exchange Server directory option, now that I use Office 365. I was always getting just the first…
Visio news from MS Ignite 2019
Microsoft Ignite 2019 at the huge Orange County Conference Conference Center in Orlando is over for another year. 30,000 attendees over 6 days, and I have seen my first sunlight today since I arrived in Florida last Saturday! So, it is time to review just what was announced about Visio, and how much Visio is…
Clarity Videos Re-boot
A series of 6 videos by Harry Miller from 2009 showing off various aspects of Visio!
Replacing Images in Visio Shapes by Changing Data
Learn how you can replace an image in a shape using a Shape Data value and a macro
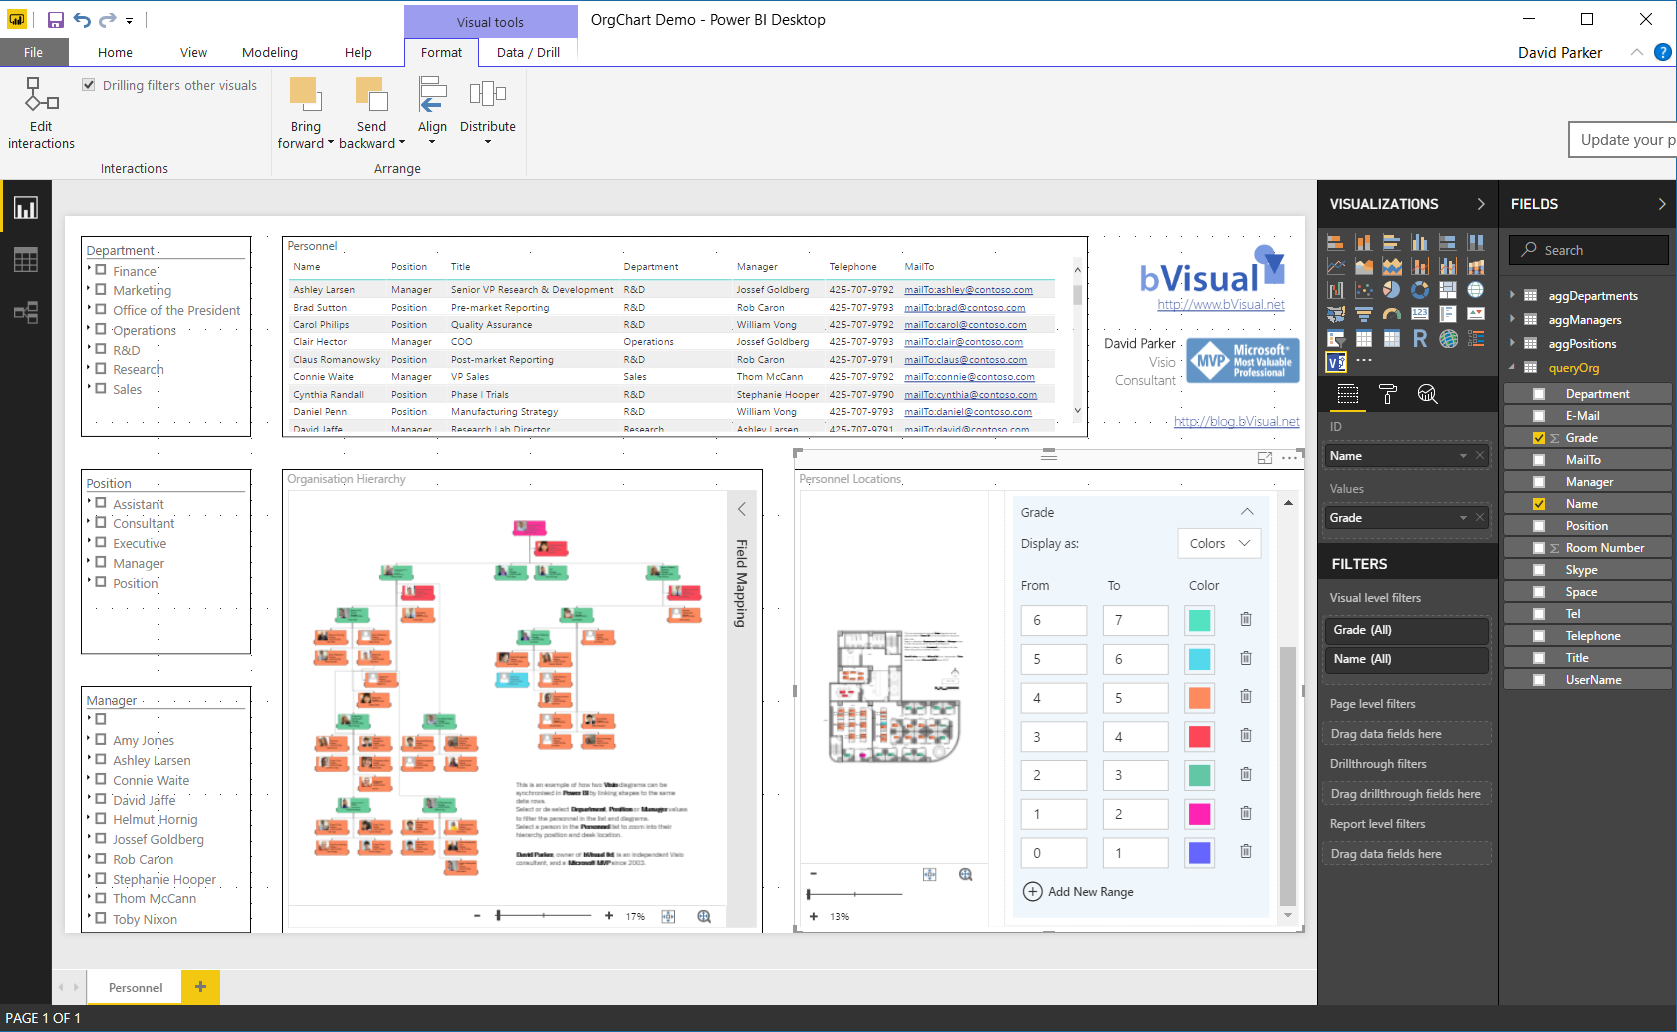
Visio in PowerBI for viewing personnel hierarchies and locations
My last article, Aliasing Data Columns for #Visio Organization Chart Wizard , mentioned the slight anomalies in the default Shape Data rows for the Organization Chart shapes and the Resources / Person shape. This prompted me to create an alternative view of the same data that can be linked to the Person shapes on a…







David,
Question for you. I am trying to automate roadmap creation in Visio. I am a program manager and have different projects in my program with different timelines and group the projects under different threads. For eg
Quality project 1 start date 12/1/2010 end date 2/1/2011
Quality project 2 start date 3/2/2011 end date 12/1/2011
Cycle time Project 1 start date 12/1/2010 end date 2/1/2011 etc
I have the data in excel,does visio have any plug ins that i can use for this? i have visio 2010.
I appreciate your help
Thanks
Deepa
So, are you trying to display the progress of multiple projects in a single Visio diagram? I have been doing this for several years, but with the Project data merged in XML or exposed as a web-service. We have our own custom add-in to do this, and there is another one available at http://www.visibility.biz/
Deep,Install Sharepoint now:) and start laughing
i’m linking to an exchange database to create an organizational chart, but i’d like to include “home” phone number for an emergency contact tree. it seems to be limited to basic information in exchange, and not extended properties. any way to add other fields? thanks
I cannot download the visio file from your blogs. It is saved on my desktop with *.vsd.ppt extension. Please advice.
Seems to work for me. Have you tried just removing the .ppt part of the extension?
From where can I download the macros?
They are in the sample files at the end of the article….
The ConnectSubordinates subroutine doesn’t work in Visio 2010. I get “This operation is not supported in Mocrosoft Visio Standard 2010” and debugging brings me to the “Set drs =” line. Ideas?
That is because you have Standard, not Professional edition.
External Data is only in Pro +
You need Visio Professional to use data recordsets
Hello David, this is getting me thinking, I am just starting to try to link Visio Org charts to excel spread sheet data. I have used the wizard to create and then linked the data in the spread sheet to shapes on the diagram. My problem was automatically updating the links to each shape based on data in the spread sheet. It sounds as though you have resolved this though I am currently only grasping the “edges” of what you have said.
I note you have a book on Visio 2010. Would reading your book provide me with a better understanding of what you have written in this Blog? Or is it on an entirely different set of diagrammatical challenges.
Great tips anyway…
I do use the Org Chart Wizard AND Link Data to Shapes together.
Use the Org Chart Wizard to add the of data required to construct the hierarchy (the Name and Reports To data) and the basic display, then use the automatic link option of Link Data to Shapes to add all of the Shape Data you want by selecting the Name (assuming that this is unique) for the Data Column and Shape Field. You have to do the automatic link on each page, but at least you will have the ability of refreshing most of the data (except the hierarchy).
Alternatively, use the Pivot Table like in my blog, or custom code.
Thanks David, i’ll check out your book (2007).
My 2007 book is probably more suitable for the data linking techniques … almost all of it still relevant …. the 2010/13 book is about data validation.
Hi David, is it possible to create org chart using excel vba? I am struggling with it. Any help in this regard is highly appreciated.
Regards,
Prashant
Yes, but it depends on how you want to create it.
Are you intending to use the data in Excel to drive the Org Chart Wizard, or create a custom org chart, as in my article?
If you drive Visio via Excel VBA then it is going to be slower than using VBA in Visio because the code will have to cross the application boundary.
The Microsoft Org Chart Addin does have a command line interface ( see http://office.microsoft.com/en-gb/visio-help/create-an-organization-chart-from-a-data-file-using-the-command-line-or-run-method-HP001038422.aspx )
You could put my VBA in Excel if you include a reference to the Visio Type Lib
Hey David, this is really great stuff. Super useful, thanks for posting!
I am not a VB superstar like you and I am wondering if it is possible to add a bit of code so that the child objects are sorted alphabetically, for example??
I noticed on the Layout shapes module that the object’s children are not sorted….. and almost shed a tear as I’ve been struggling with this for weeks.
Thanks a MILLION for this, very cool!
Sorry, just a bit more info… I am referring to the LayoutPageCompactTree, LayoutPageHierarchy seems to come out sorted?
Thanks!!
I take that back, seems that LayoutPageHierarchy is not sorted either, having these hierarchies sorted alphabetically would be amazing. thanks!
We have requested that Microsoft provide the ability to sort by selected Shape Data for many years. It is only relevant for certain layout types, and would need to be re-applied after each change in layout.
Therefore it is not easy because the effect of each branch on the spacing would need to be accounted for. I may get chance to think about the possibility over the holiday period…
Hello. The links to the files at the bottom of the article are invalid. Would it be possible to update them? Thanks!
I have added two alternative links, but the original ones worked for me.
This software looks good. I use creately org chart software to create organizational charts for my needs. It supports real-time collaboration cloud so your diagrams will never be missed
Fantastic blog thanks very much..!
I have a question. Is there an easy way to allow more than 1 direct reporting line from a person ? I’ve tried adding an additional row within Excel for the same person but with a different Reports To but unfortunately this then creates two people of the same name.
Regards.
The code could be altered for more generalised solution … I will post again soon
I found more examples and templates about organizational charts drawn from a org chart software in a creately diagramming community.
Hi David
This is REALLY helping ! Thank you.so much !
So I started adapting your code for my own purpose, and there I am stuck.
My problem is that I am trying to make a graph which is not purely hierarchical, but in network.
The fact is that objects exit only once, while links can name either source or destination several times.
Basically, I have to have 2 recordsets : one for objects and one for links.
So what I guess I have to do, is to create the graph from the objects data set, and then , switch to the link recordset , and scroll there to create links between objects. I have been investigating on that for some time now, -as a pure VB fresher – without finding a clue on how to do this. How can I switch between recordsets ?
Can you help me ?
Stephane,
I have included some code in the download for the article http://blog.bvisual.net/2015/11/16/data-import-and-export-features-in-visio-2016-and-2013/
This links shapes together from another data recordset. You should be able to copy and adapt for your use.
Hi David… I’m coming back to this topic after a looooong time…. And I got lost in the forest of sample files you did let on Onedrive. Could you give me some more direction ? Thanks !
Hi David,
I am preparing org chart in Visio 2007 & I want to color the boxes according to the location, but am not able to do that, could you please help me. Thanks in Advance.