I was recently asked how I would approach improving the Logic Gate 2 in the Circuits and Logic template, on the Analog and Digital Logic stencil. Well, this had resonance with me because I had often wondered why these shapes were not smarter than they are, so I looked more deeply into the shape construction to see how the Logic Gate 2 shape works, and how it could be improved so that the values of the inputs could be set and the logic applied to provide the correct output value. Eventually, similar improvements can be applied to all of the master shapes so that the connected logic diagram responds to input value changes.
The Existing Shape
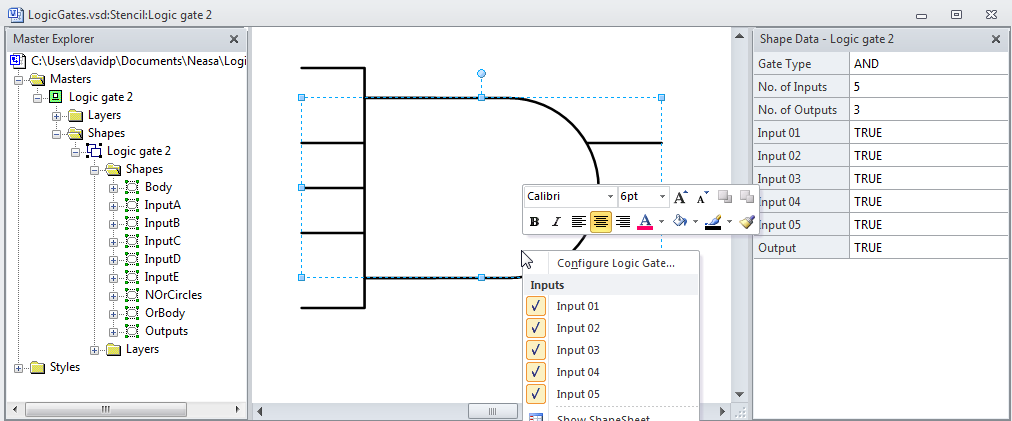
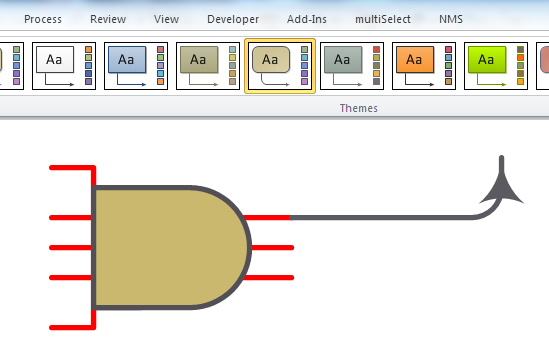
The Logic Gate 2 shape has Shape Data rows to provide some configuration. Firstly, you can change the number of inputs from 2 to 5, and the number of outputs from 1 to 3:
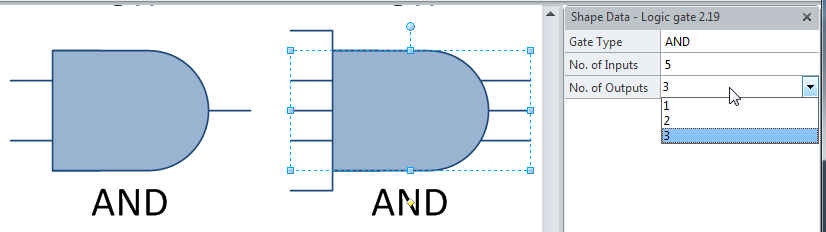
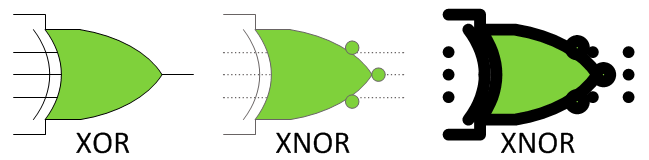
Secondly, you can change the gate type between OR; AND; NOR; NAND; XOR and XNOR:
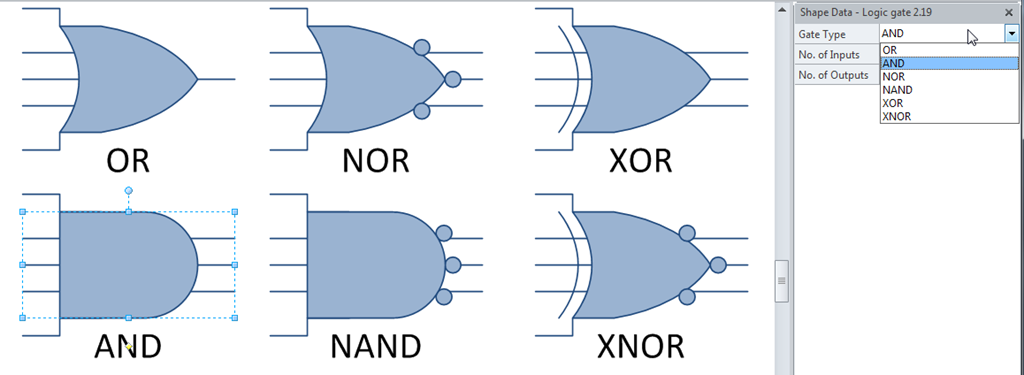
The Logic Gate 2 shape is basically the same in Visio 2013, but I thought it worthwhile checking how the new themes renders the shape:
Shape Data
The first decision that I made was to provide Shape Data rows for each of the inputs, numbered from 1 to 5, and it seemed logical that they should be read from top to bottom on the left side of the shape.

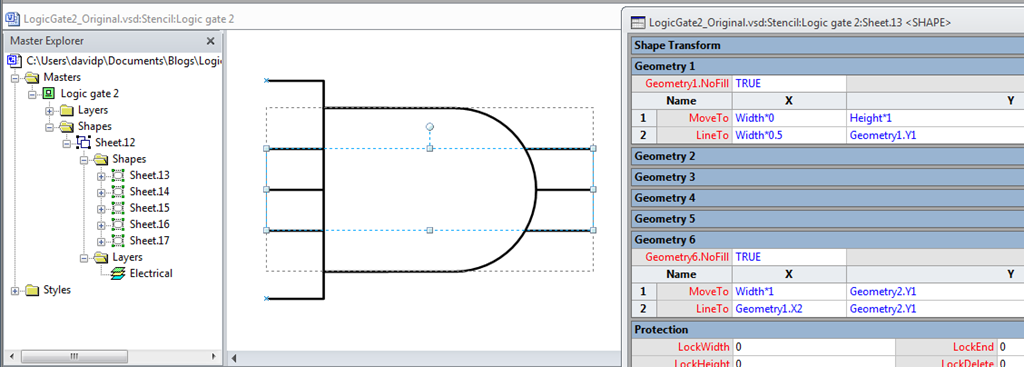
However, an exploration of the master shape reveals that the inputs are actually geometry sections of two sub shapes, Sheet.13, which contains the middle 3 inputs and the 3 outputs, and Sheet.15, which contains the upper and lower inputs when there are 4 or 5 inputs.
So, the input lines do not correspond to the same input number if the number of inputs is varied from 2 to 5, however I first needed to add the input Shape Data rows as True/False (boolean) data type, and the display of the output value. I also decided that it would be useful to have the ability to select the value of inputs from the right-mouse menu:

I added Prop.Input_01 through to Prop.Input_05 as Shape Data rows, and controlled their visibility according to the number of inputs selected.
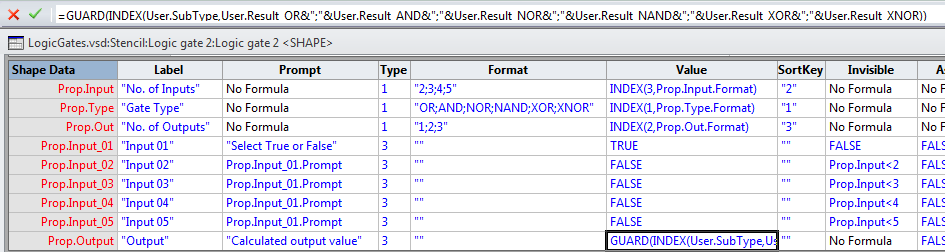
The formula in the Prop.Output row is guarded because its value is derived from the result of formulas in the User-defined Cells section:
=GUARD(INDEX(User.SubType,User.Result_OR&”;”&User.Result_AND&”;”&User.Result_NOR&”;” &User.Result_NAND&”;”&User.Result_XOR&”;”&User.Result_XNOR))
Actions Rows
Each of the input Actions rows need to toggle the value of the corresponding Shape Data row, and to display the current value as checked or not (TRUE or FALSE). Also, their visibility needs to be set by the number of inputs selected.
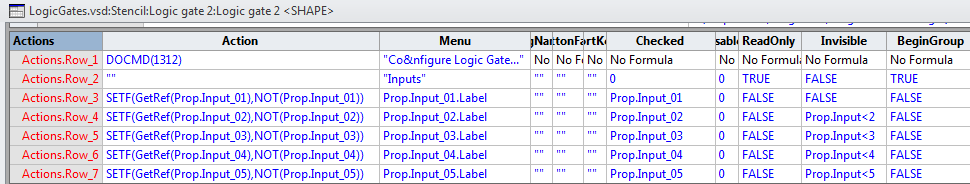
I decided that it would be nice to have the “Inputs” header row on the right-mouse menu, and so this is achieved i Action.Row_2 by having it as ReadOnly = TRUE
User-defined Cells
I have already mentioned that the output value is calculated by formulas in the User-defined Cells section, and I decided that it was clearer to and result rows for each of the different gate types.

As these formulas are central to the validity of this shape, I have listed the formulas for each one below (remember that each one is on a single line in the cell):
User.Result_OR
=INDEX(Prop.Input-2,BITOR(Prop.Input_01,Prop.Input_02)&”;”&BITOR(BITOR(Prop.Input_01,Prop.Input_02),Prop.Input_03)&”;”&BITOR(BITOR(BITOR(Prop.Input_01,Prop.Input_02),Prop.Input_03),Prop.Input_04)&”;”&BITOR(BITOR(BITOR(BITOR(Prop.Input_01,Prop.Input_02),Prop.Input_03),Prop.Input_04),Prop.Input_05))
User.Result_AND
=INDEX(Prop.Input-2,BITAND(Prop.Input_01,Prop.Input_02)&”;”&BITAND(BITAND(Prop.Input_01,Prop.Input_02),Prop.Input_03)&”;”&BITAND(BITAND(BITAND(Prop.Input_01,Prop.Input_02),Prop.Input_03),Prop.Input_04)&”;”&BITAND(BITAND(BITAND(BITAND(Prop.Input_01,Prop.Input_02),Prop.Input_03),Prop.Input_04),Prop.Input_05))
User.Result_NOR
=NOT(User.Result_AND)
User.Result_NAND
=NOT(User.Result_OR)
User.Result_XOR
=INDEX(Prop.Input-2,(Prop.Input_01+Prop.Input_02=1)&”;”&(Prop.Input_01+Prop.Input_02+Prop.Input_03=1)&”;”&(Prop.Input_01+Prop.Input_02+Prop.Input_03+Prop.Input_04=1)&”;”&(Prop.Input_01+Prop.Input_02+Prop.Input_03+Prop.Input_04+Prop.Input_05=1))
User.Result_XNOR
=NOT(User.Result_XOR)
Prop.Output
This cell just selects the relevant value for the selected gate type.
=GUARD(INDEX(User.SubType,User.Result_OR&”;”&User.Result_AND&”;” &User.Result_NOR&”;”&User.Result_NAND&”;”&User.Result_XOR&”;”&User.Result_XNOR))
Connection Points
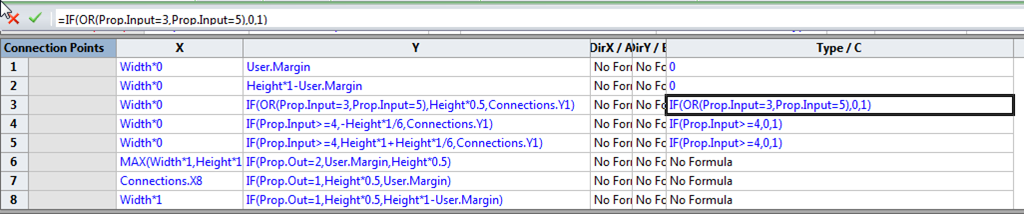
The existing Connection Points have their position controlled by suitable formulas in the X and Y cells.
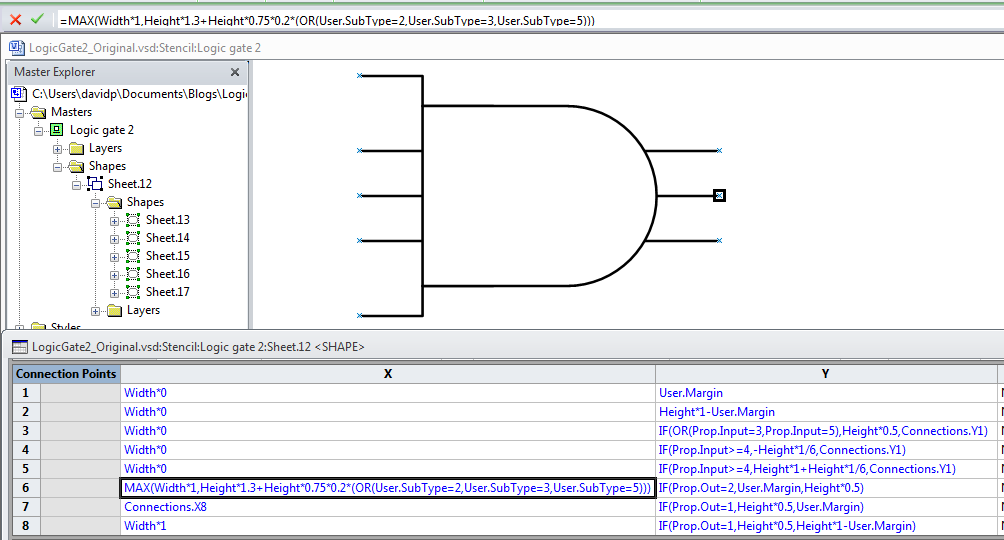
However, the Type of rows 3,4 and 5 can be changed automatically to 1 according to the number of inputs selected, so they are not available for connecting to when they are not visible.
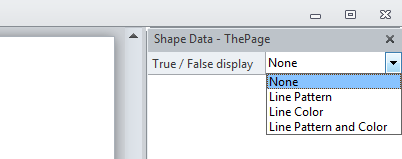
Visual Representation of True or False
Line Color
My original inquirer suggested that True or False could be represented by changing the line colour to red if the value is positive. I have two problems with this approach: Firstly, any print out could be in black and white; and secondly, users might want to apply a theme to the diagram, which would probably be at odds with the red line.
In the following example, I have applied one of the built-in themes, and then changed one of the sub-shapes to a red line.

Here, I have done similar in Visio 2013.

Perhaps, the red line is obvious enough, but it does emphasize that I would need to have a different sub-shape for each input, so that they can be coloured separately.
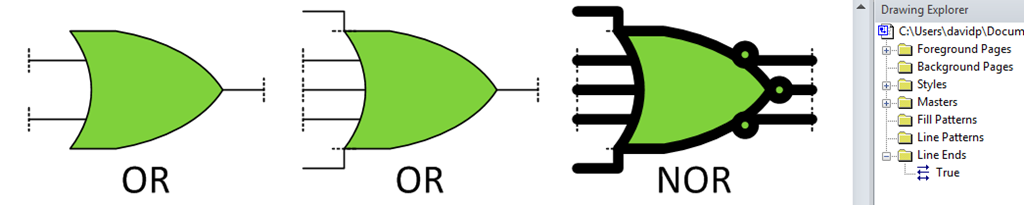
Line Pattern
The line pattern could be changed to represent True or False, but increasing the Line Weight will increase the space between any elements in the line, as can be seen by the following example from Visio 2010:
There is similar behaviour in Visio 2013

Line Ends (Arrows)
Visio has a number of Line Ends (Arrows) built in, and you can create custom ones too. A quick application of different Begin and End Arrow shows that the existing shape is not well made, because it does not inhibit inappropriately assigned arrows, and it does not have an input (Begin) and output (End) flow.
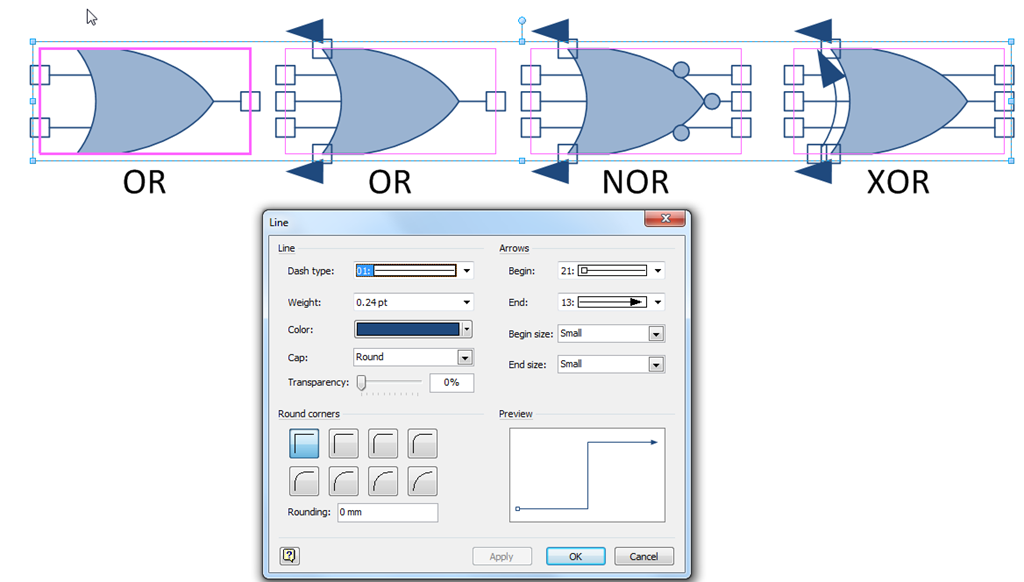
You can create a custom Line End too, as in the following example where I created a Line End master called True, which consists of a vertical dashed line.
Text
The logical textual display for True and False is + and –, as in the following example for the first input:
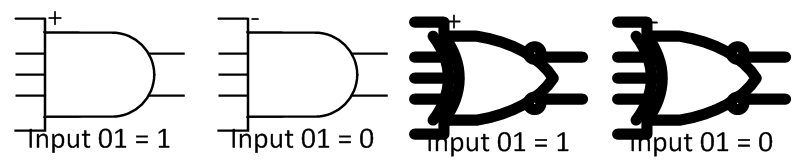
The problem with this is that the extra text could make the diagram too busy, and could get obscured by heavier lines easily.
Conclusion
My conclusion is that the existing shape needs to be enhanced anyway, and that it needs to have a separate shape for each input line if the line pattern, color, arrow or text is going to change according a Shape Data row value.
If a connector line is going to be enhanced in the future to visualise True or False, then either the line pattern or color could be used, but line arrows and text could become too busy, and detract from the simplicity.
So, I concluded that either or both the line pattern and color could be used to represent True or False, but that it would be useful to provide the user with the choice.
Updating the Master
I named all of the sub-shapes inside the group, and added separate shapes for each of the inputs, named InputA to InputE from top to bottom on the left.
I have outlined some of the main changes below….
The Master Page
I added the options for the display of True / False values to the page of the master, so that all shapes will have access to the values.
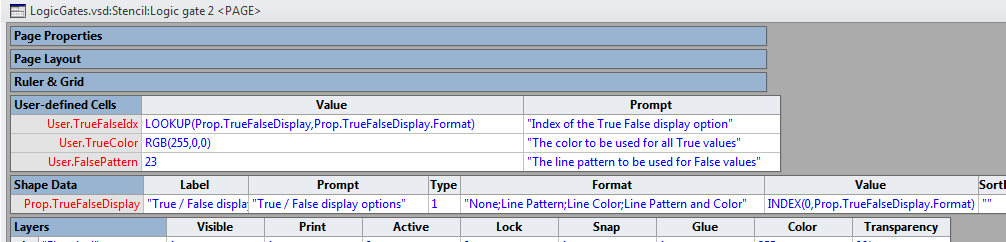
I also added a User-defined cell, User.TrueColor, to store the value for lines that represent True values, and another cell, User.FalsePattern, to store the line pattern to represent False values.
I decided that RGB(255,0,0), red, should indeed represent True, as suggested by my original requestor (because it is like the positive jump lead for my car battery!), and that False lines should be a tight dotted line (23).
Outputs Sub-Shape
The Outputs sub-shape contains all of the possible lines at the right of the shape. They are just separate geometry sections, and thus share the same LinePattern and LineColor values.
LinePattern
=GUARD(IF(BITAND(ThePage!User.TrueFalseIdx,1),IF(Sheet.5!Prop.Output,Sheet.5!LinePattern,ThePage!User.FalsePattern),Sheet.5!LinePattern))
LineColor
=GUARD(IF(BITAND(ThePage!User.TrueFalseIdx,2),IF(Sheet.5!Prop.Output,ThePage!User.TrueColor,Sheet.5!LineColor),Sheet.5!LineColor))
Inputs Sub-Shapes
The input sub-shapes
User.Value
InputA
=Sheet.5!Prop.Input_01
InputB
=IF(Sheet.5!Prop.Input<4,Sheet.5!Prop.Input_01,Sheet.5!Prop.Input_02)
InputC
=IF(Sheet.5!Prop.Input=3,Sheet.5!Prop.Input_02,Sheet.5!Prop.Input_03)
InputD
=IF(OR(Sheet.5!Prop.Input=3,Sheet.5!Prop.Input=4),Sheet.5!Prop.Input_03,IF(Sheet.5!Prop.Input=2,Sheet.5!Prop.Input_02,Sheet.5!Prop.Input_04))
InputE
IF(Sheet.5!Prop.Input=5,Sheet.5!Prop.Input_05,Sheet.5!Prop.Input_04)
LinePattern
=GUARD(IF(BITAND(ThePage!User.TrueFalseIdx,1),IF(User.Input,Sheet.5!LinePattern,ThePage!User.FalsePattern),Sheet.5!LinePattern))
LineColor
=GUARD(IF(BITAND(ThePage!User.TrueFalseIdx,2),IF(User.Input,ThePage!User.TrueColor,Sheet.5!LineColor),Sheet.5!LineColor))
Themes
I noticed that the original master shape was protected from theme effects, but this causes an unfortunate mis-match of line weights with some of the standard themes:
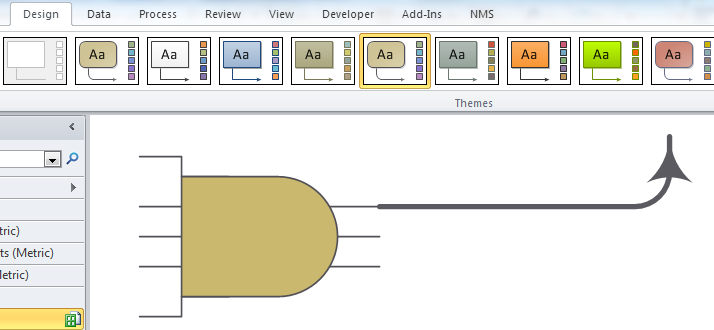
So, I removed the protection from theme effects on the group shape, but applied it to all the sub-shapes. Then I added the formula =GUARD(Sheet.5!LineWeight) to the LineWeight cell of all of the sub-shapes. This ensures that the line weight of any applied theme is respected in the sub-shapes:
Dynamic connector
The example above reveals how the solution seems incomplete with adding a little smartness to the Dynamic connector master. So, I added the same master page cells that I did for the Logic Gate 2 master above, added a Prop.Value Shape Data row, and then updated the formulas for the LinePattern and LineWeight.

In the future, I may add code to update the Prop.Value from the True/False value of the Output at the start of the connector, but, for now, I can just edit the value manually.
Template Download
So, my revised document now contains two masters, and I ensured that their Match master by name on drop property is ticked, so that you can drag and drop from the built-in stencil, just like normal, but my revised Logic Gate 2 master shape will be used.
You can download the template from the links below (note that you should have a licence for Visio Professional or higher) :
Visio 2003 – 2010 format
Metric – Circuits and Logic with Enhanced Logic Gate 2 – Metric.vst
US Units – Circuits and Logic with Enhanced Logic Gate 2 – US Units.vst
Visio 2013+ Format
Metric – Circuits and Logic with Enhanced Logic Gate 2.vstx
Foot Notes
You can read more about logic gates at http://en.wikipedia.org/wiki/Logic_gate.

There are only 26 masters on the Analogue and Digital Logic stencil, and I haven’t counted how many there are on the three stencils docked in this template…. but if Microsoft want to employ someone to update the Visio 2013 masters ….
Update
My friend, John Marshall, pointed out that the original Visio shape did not have the outer negation circles centred, so I have updated the master shape in the download, and created Metric and US Unit versions.
 |  |
| Before | After |
Strange that they asked an architect to review electronics, but as usual, you did an excellent analysis of the shape. Visio has a number of classic shapes that could use the same treatment. Hopefully this is a trend that continues.
Thanks for reminding me that I used to be an architect … the basic skills stay the same : Analysis, Synthesis, Design
One minor point that the original designer got wrong. The negations (those little circles) should be centered on the line.
Thanks John, I have updated the Logic Gate 2 shape now in the download.
Thanks David for being quick on the mark and getting the negation right!
.. and any logic gate would only have one output of any polarity, but might have one normal and one negated output. The ability to drive more than n outputs is performed by increasing the fan-out of the gate.
how can i use it using MS visio 2013?
The download does work with Visio 2013
Impressive – and posted just when I wanted to find it! Thank you
Hi
I just made a similar tool for relay circuit simulation (see visioguy’s page) and thought about to expand it with logic gates – so you did it already. fine & thanks!
But I guess I have a problem with the template (metric) – it’s empty. For this the ‘professioal’-version is required?
The “Logic gate 2” master is in the Document Stencil
Hi David. The links to download the templates don’t seem to work anymore.
Hi,
I have fixed them now … I guess Microsoft have changed something in OneDrive.
User.Result_NOR=NOT(User.Result_AND)
User.Result_NAND=NOT(User.Result_OR)
Shouldn’t this be:
User.Result_NOR=NOT(User.Result_OR)
User.Result_NAND=NOT(User.Result_AND)
I checked the logic of the NOR block and it is not correct.
User.Result_NOR=NOT(User.Result_AND)
User.Result_NAND=NOT(User.Result_OR)
Should be:
User.Result_NOR=NOT(User.Result_OR)
User.Result_NAND=NOT(User.Result_AND)
Otherwise the logic does not work.
Thank you for checking
David, thanks for going to the trouble of creating the Circuits and Logic with Enhanced Logic Gate 2 – US Units.vst. It look like you put a lot of knowledge and hard work into it.
I tried downloading from the link but I get a page that opens but keeps flashing every few seconds so I was unable to download your template.
Can you please send the following template (I am using Visio 2007):
Circuits and Logic with Enhanced Logic Gate 2 – US Units.vst.
to the email address below.
Thanks,
Ken
File sent