I have only been developing Visio solutions for 25 years, but I got a surprise this week when I was trying to understand why I couldn’t update the value of a Shape Data row of multiple selected shapes. It is something that I often do, so it took me a while to understand why I was failing to change the values, even though it appeared to initially change in the Shape Data window. There was no problem selecting the shapes individually, but every time I selected multiple shapes and edited these particular rows, I could see the new value in the Shape Data window, but as soon as I looked at the individual shapes, I could see that the values never got changed. I checked my code in vain, and ran the Events Monitor from the Visio SDK. Visio seemed to enter the Shape Data scope, but then immediately exited it without attempting to apply the new value to the shapes. Very strange!
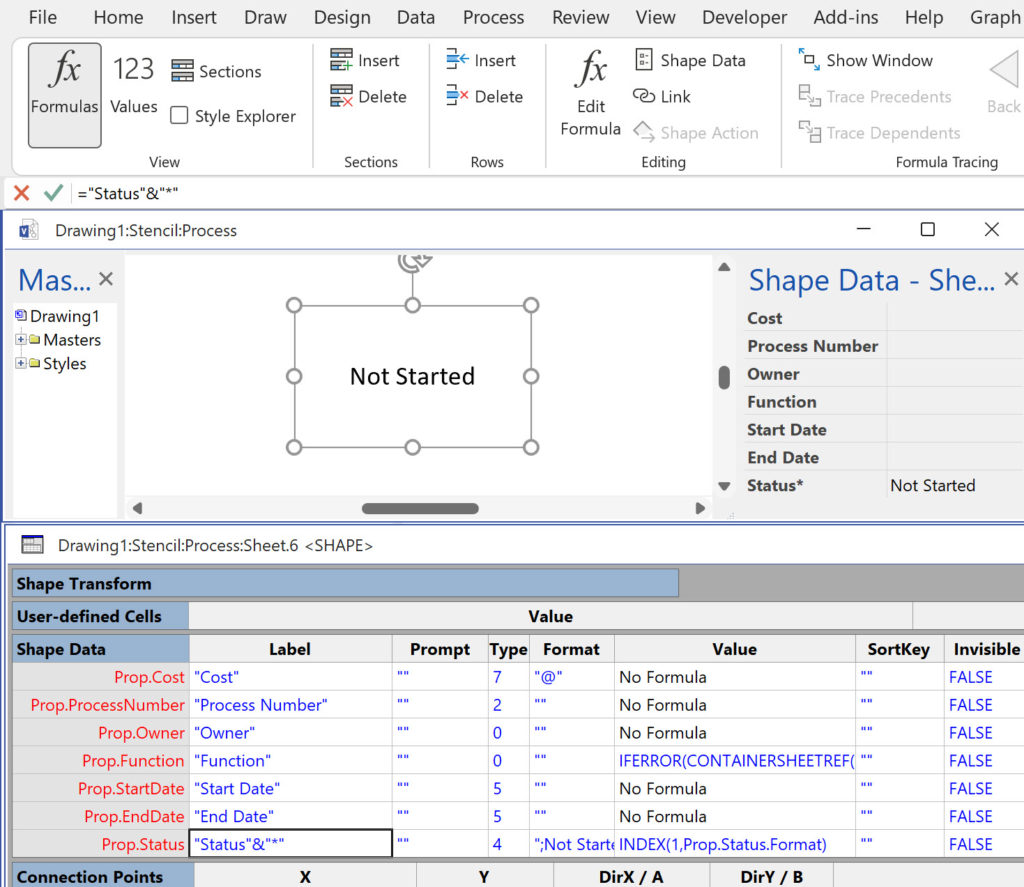
An examination of the ShapeSheet formulas also showed that there was no dependencies or precedents either …. Then I noticed that I was using a formula to display the Label text, rather than just a simple string. A quick edit proved that this was the surprising problem. It doesn’t matter if the formula is something as simple as the following in the Label cell (this wasn’t the actual example but this demonstrates the issue):
="Status" & "*"
It will fail, but editing back to the following makes it work again:
="Status"
Who knew? Certainly not me 🙁
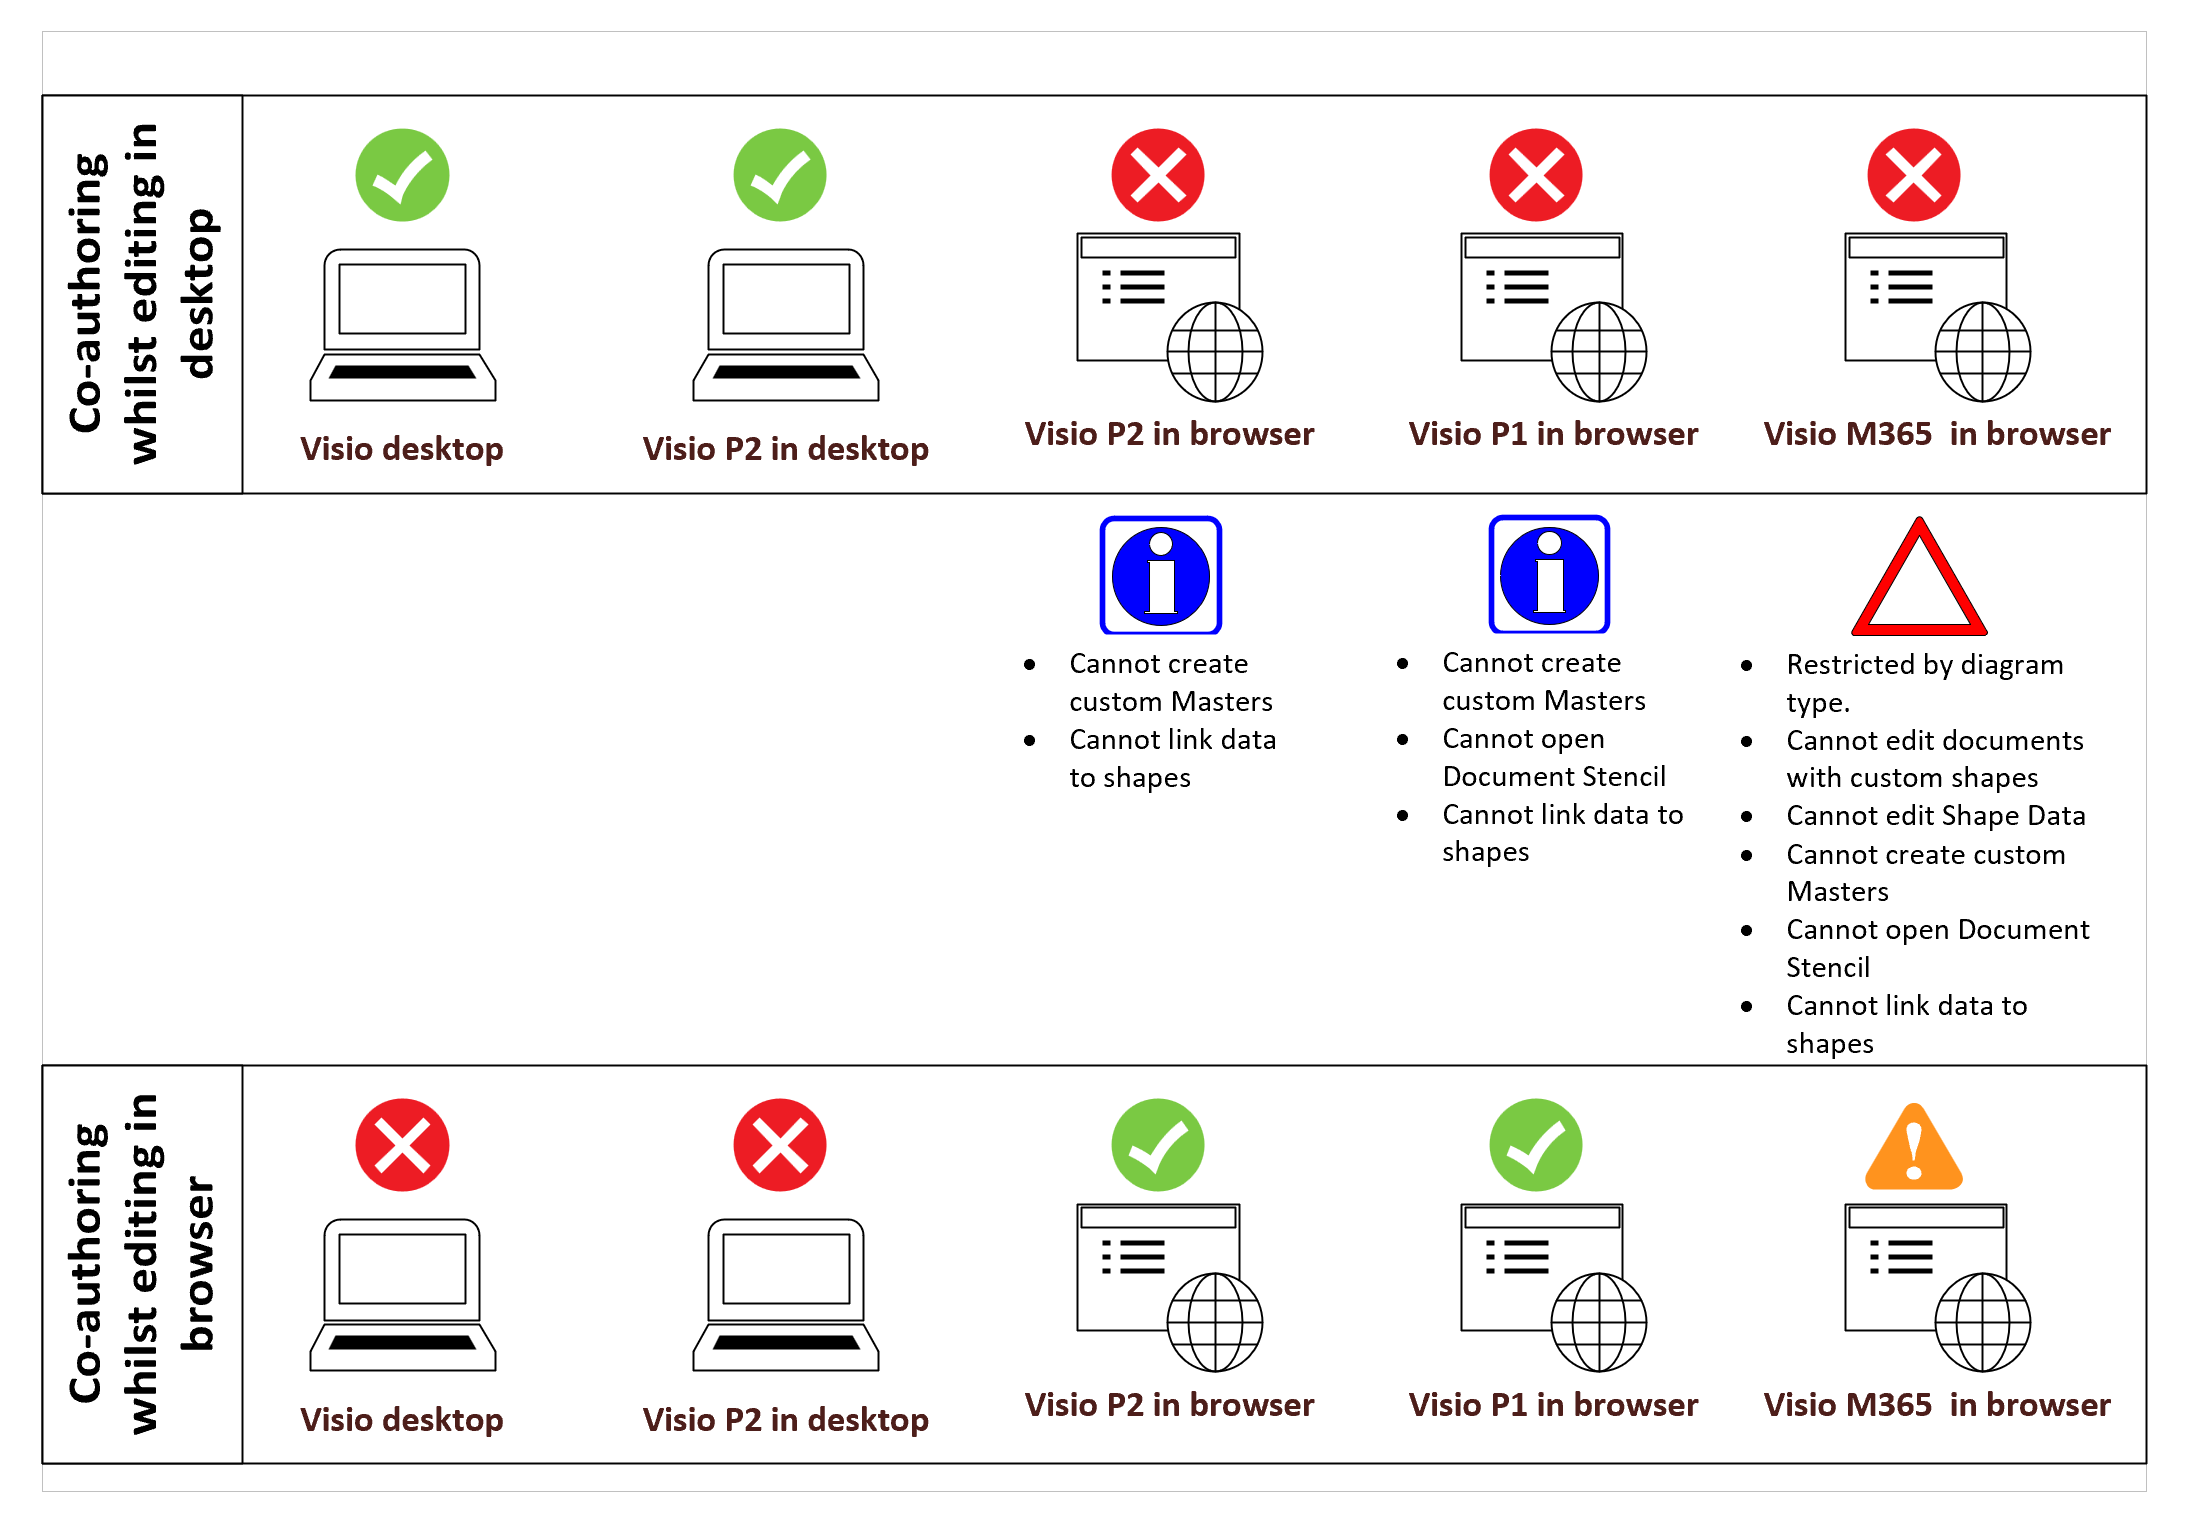
Co-authoring and Commenting with Visio Documents
Microsoft Visio can be used in the web browser and on the desktop, but there are several licensing options available, so which ones can be used concurrently whilst supporting co-authoring and commenting? This article tests the various scenarios but assumes that the Visio documents are stored in OneDrive for Business or SharePoint Online\Teams. The Microsoft…
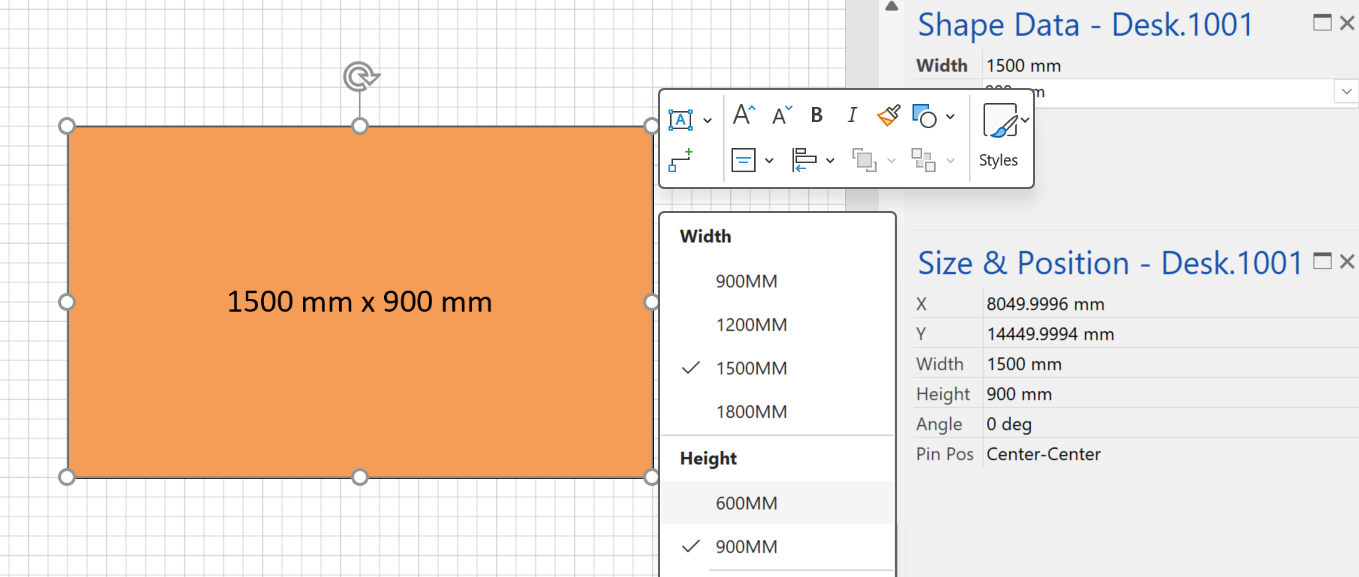
Fixing dimensions of 2D shapes
I am often asked what makes Visio unique and makes it stand out from the crowd, especially in today’s online world. Well, I think there are many reasons, but one of them is the ability to create scaled drawings with parametric components of specific dimensions. This was crucial for my adoption of Visio back in…
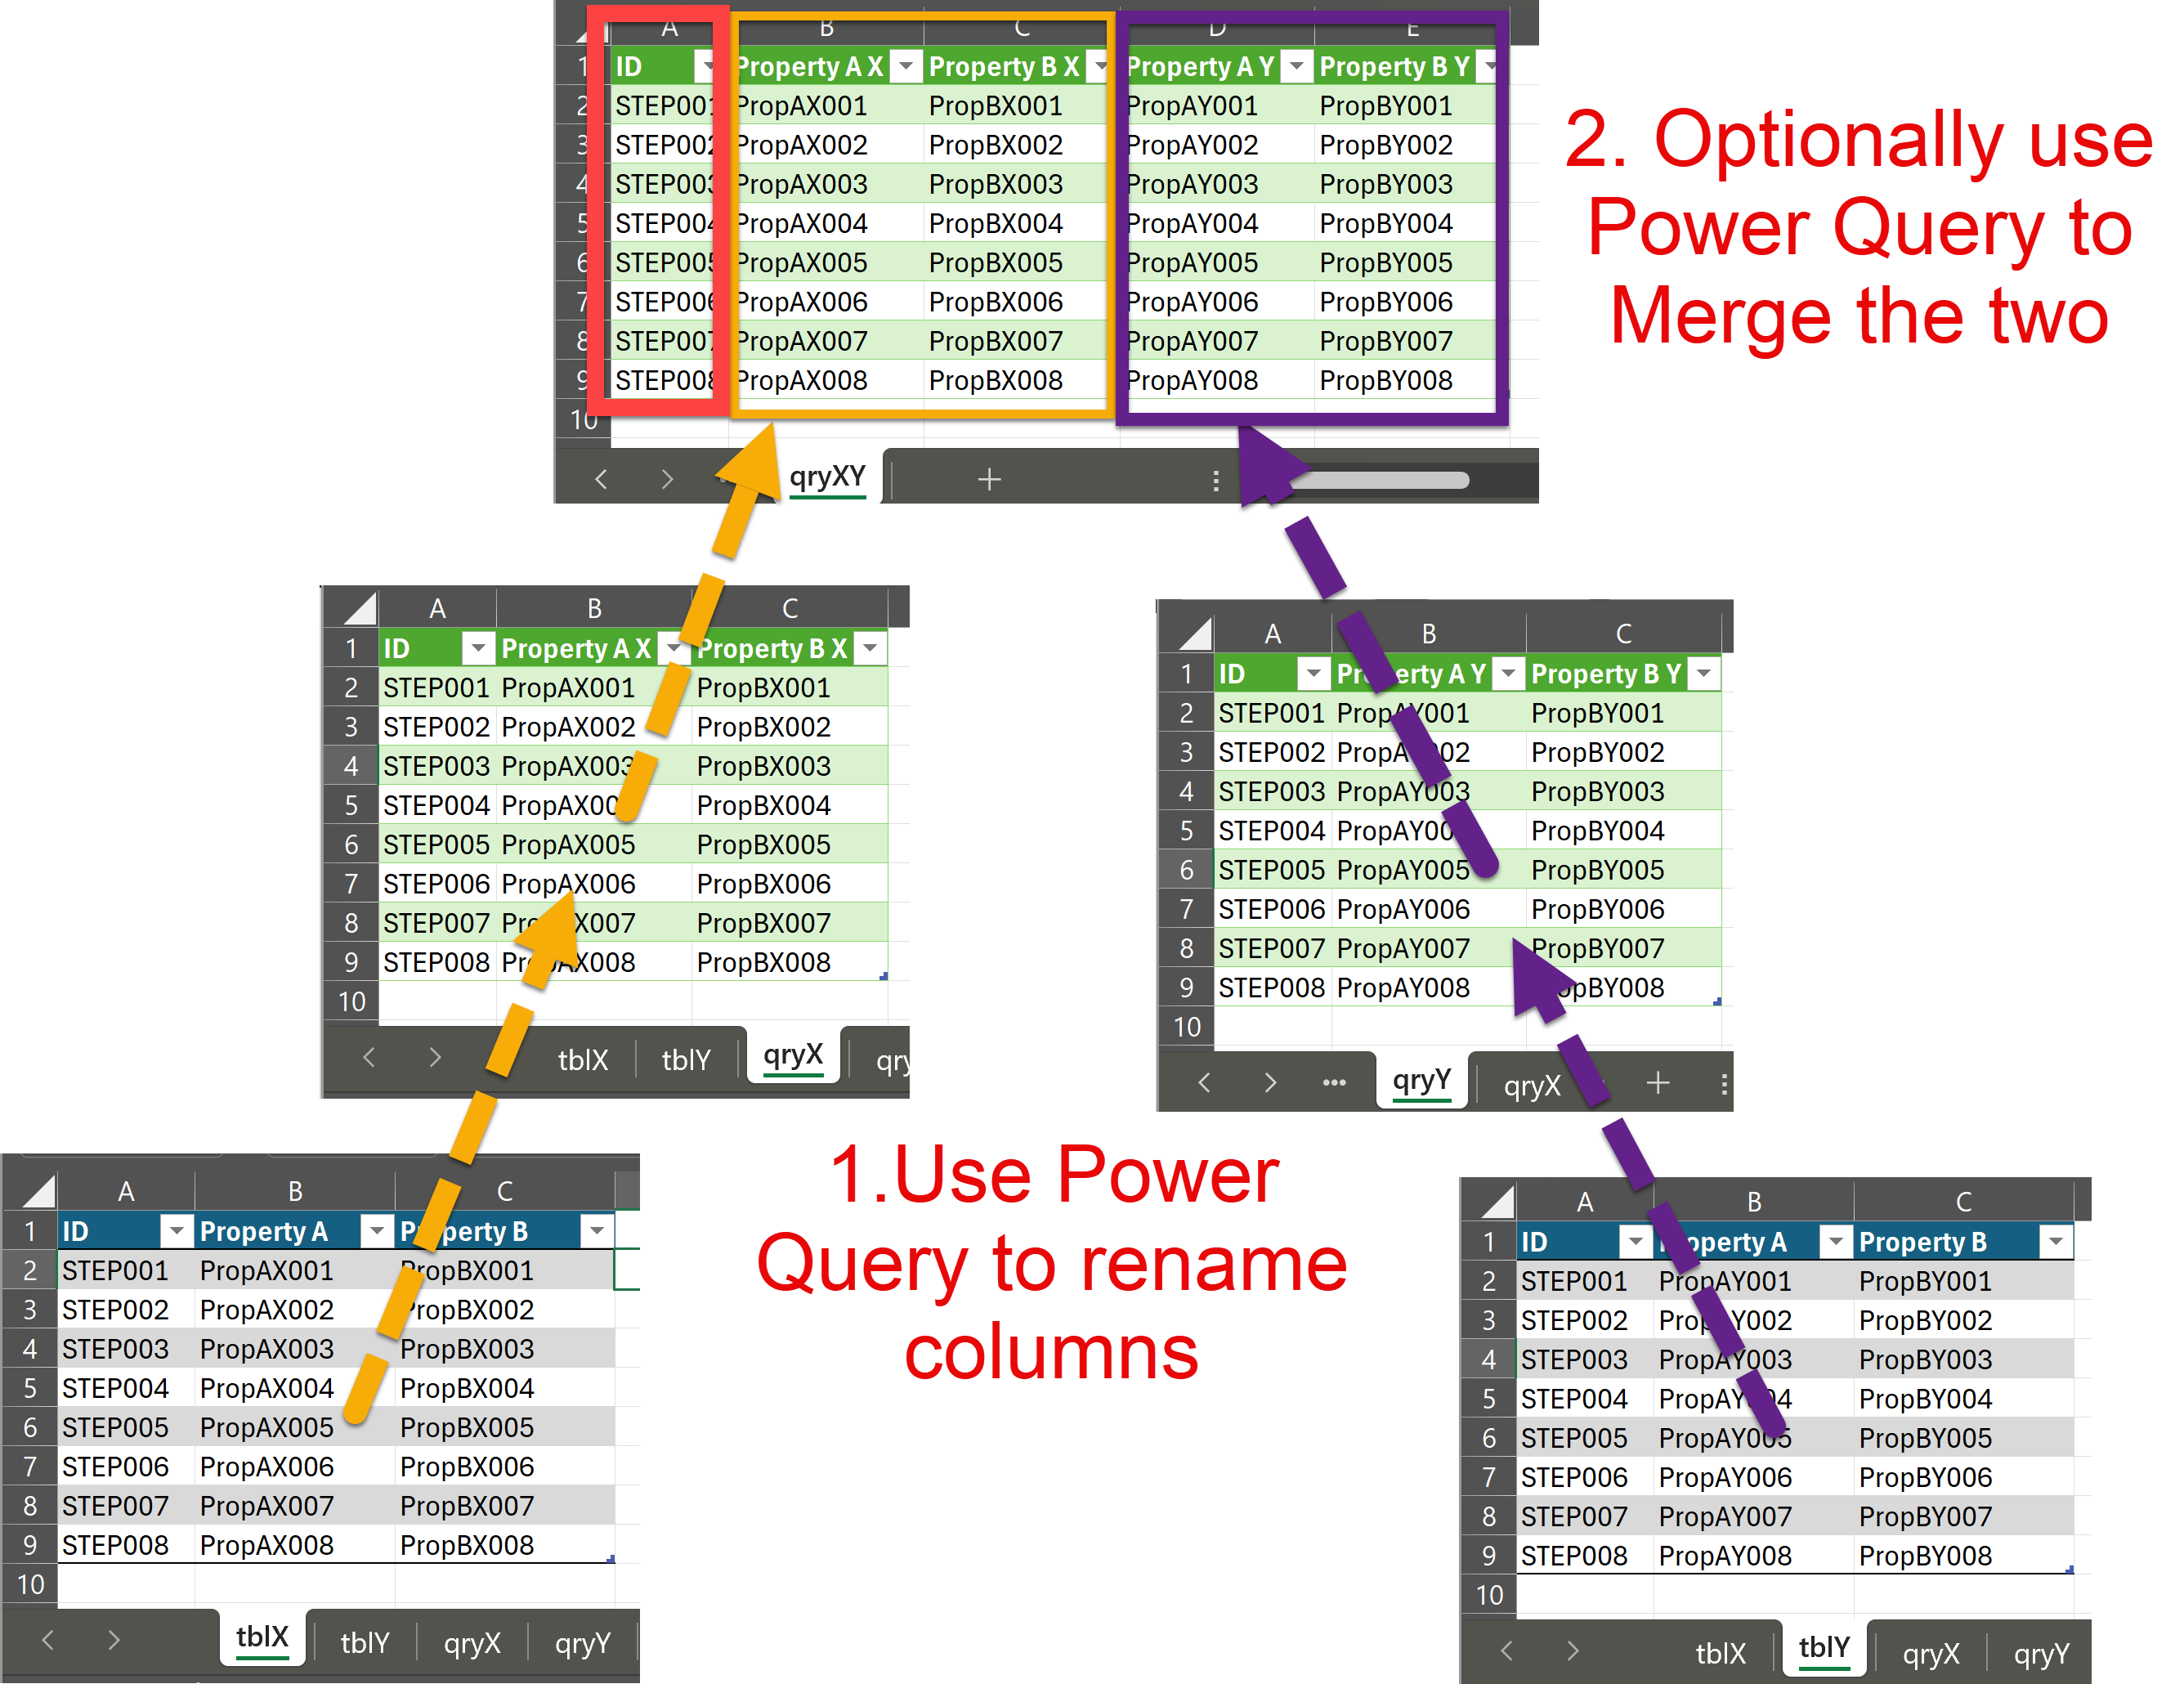
Merging Linked Data from Similar Tables
I was recently asked how to link data from different tables but with similar column names to Visio shapes. In this case, each table has the same unique identifier, but some of the column names are the same. The problem is that the data linking matches the column name with the label of a Shape…
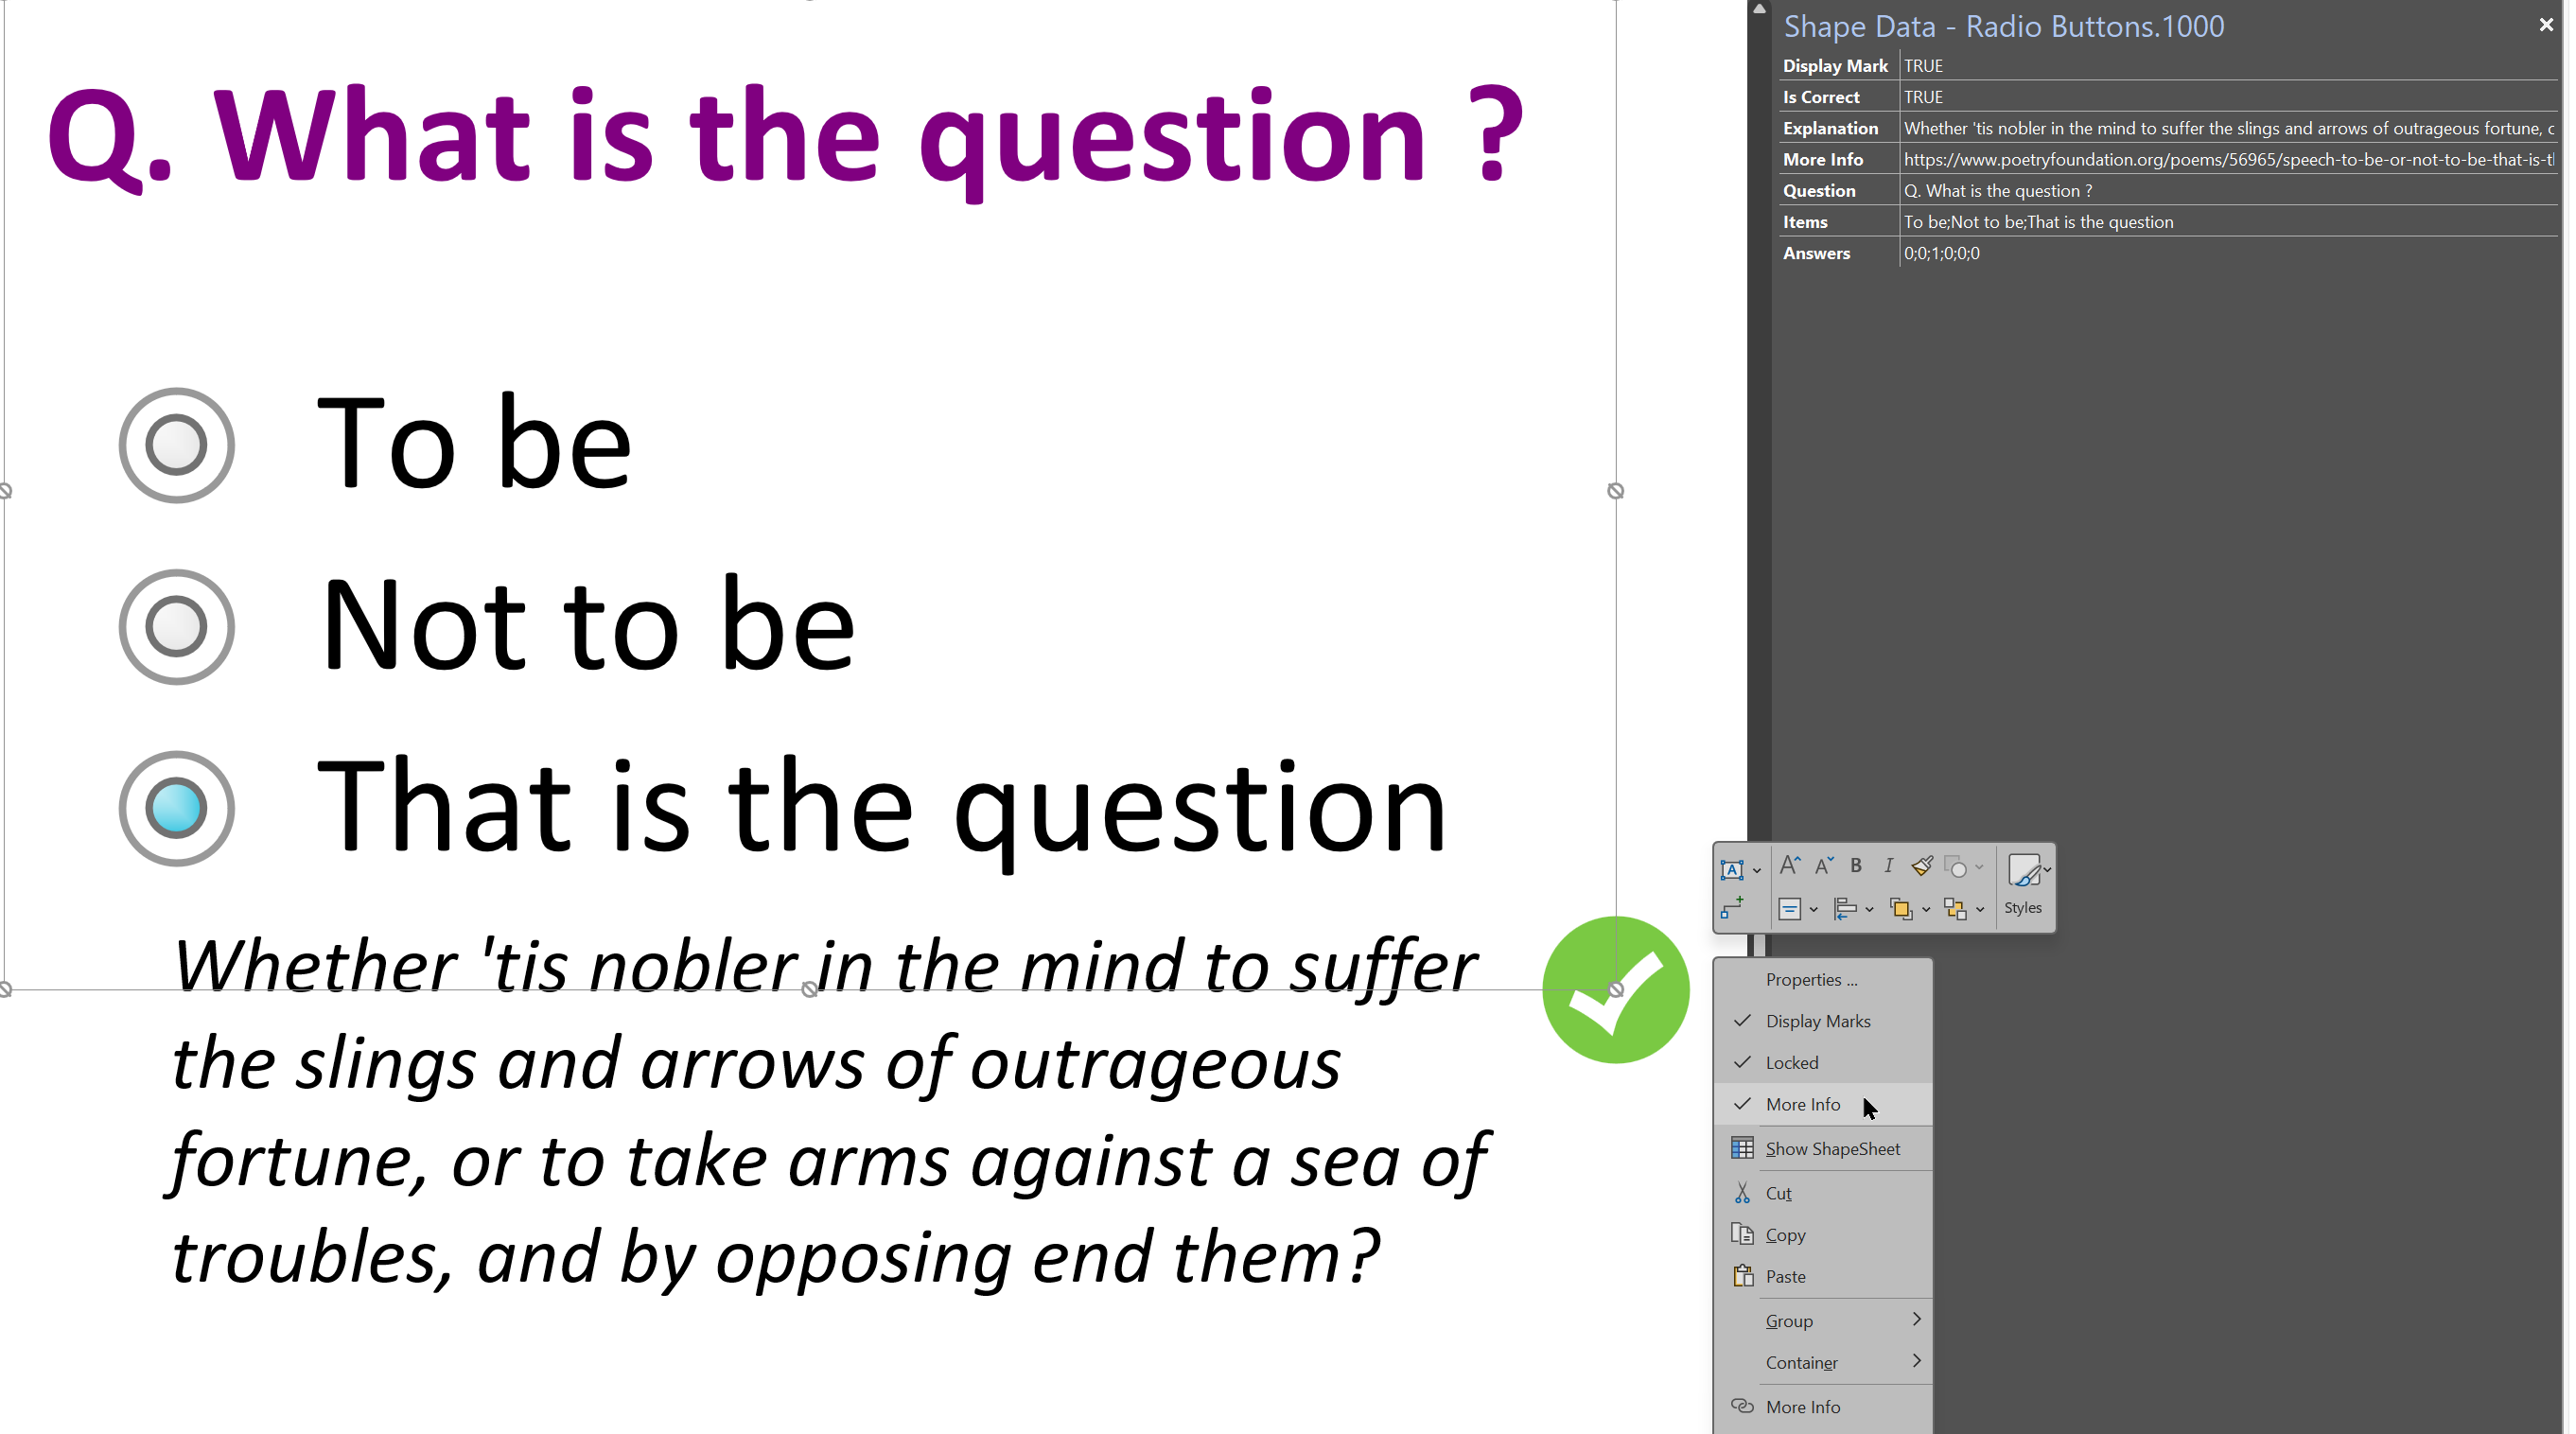
Smart Radio Buttons and Check Boxes in Visio
A recent project requires an interactive tutorial within Microsoft Visio desktop where a lot of the questions need a single answer using radio buttons, or multiple-choice answers using check boxes. I thought that this would be a great use of the list containers capability because the questions and answers could be part of the container…
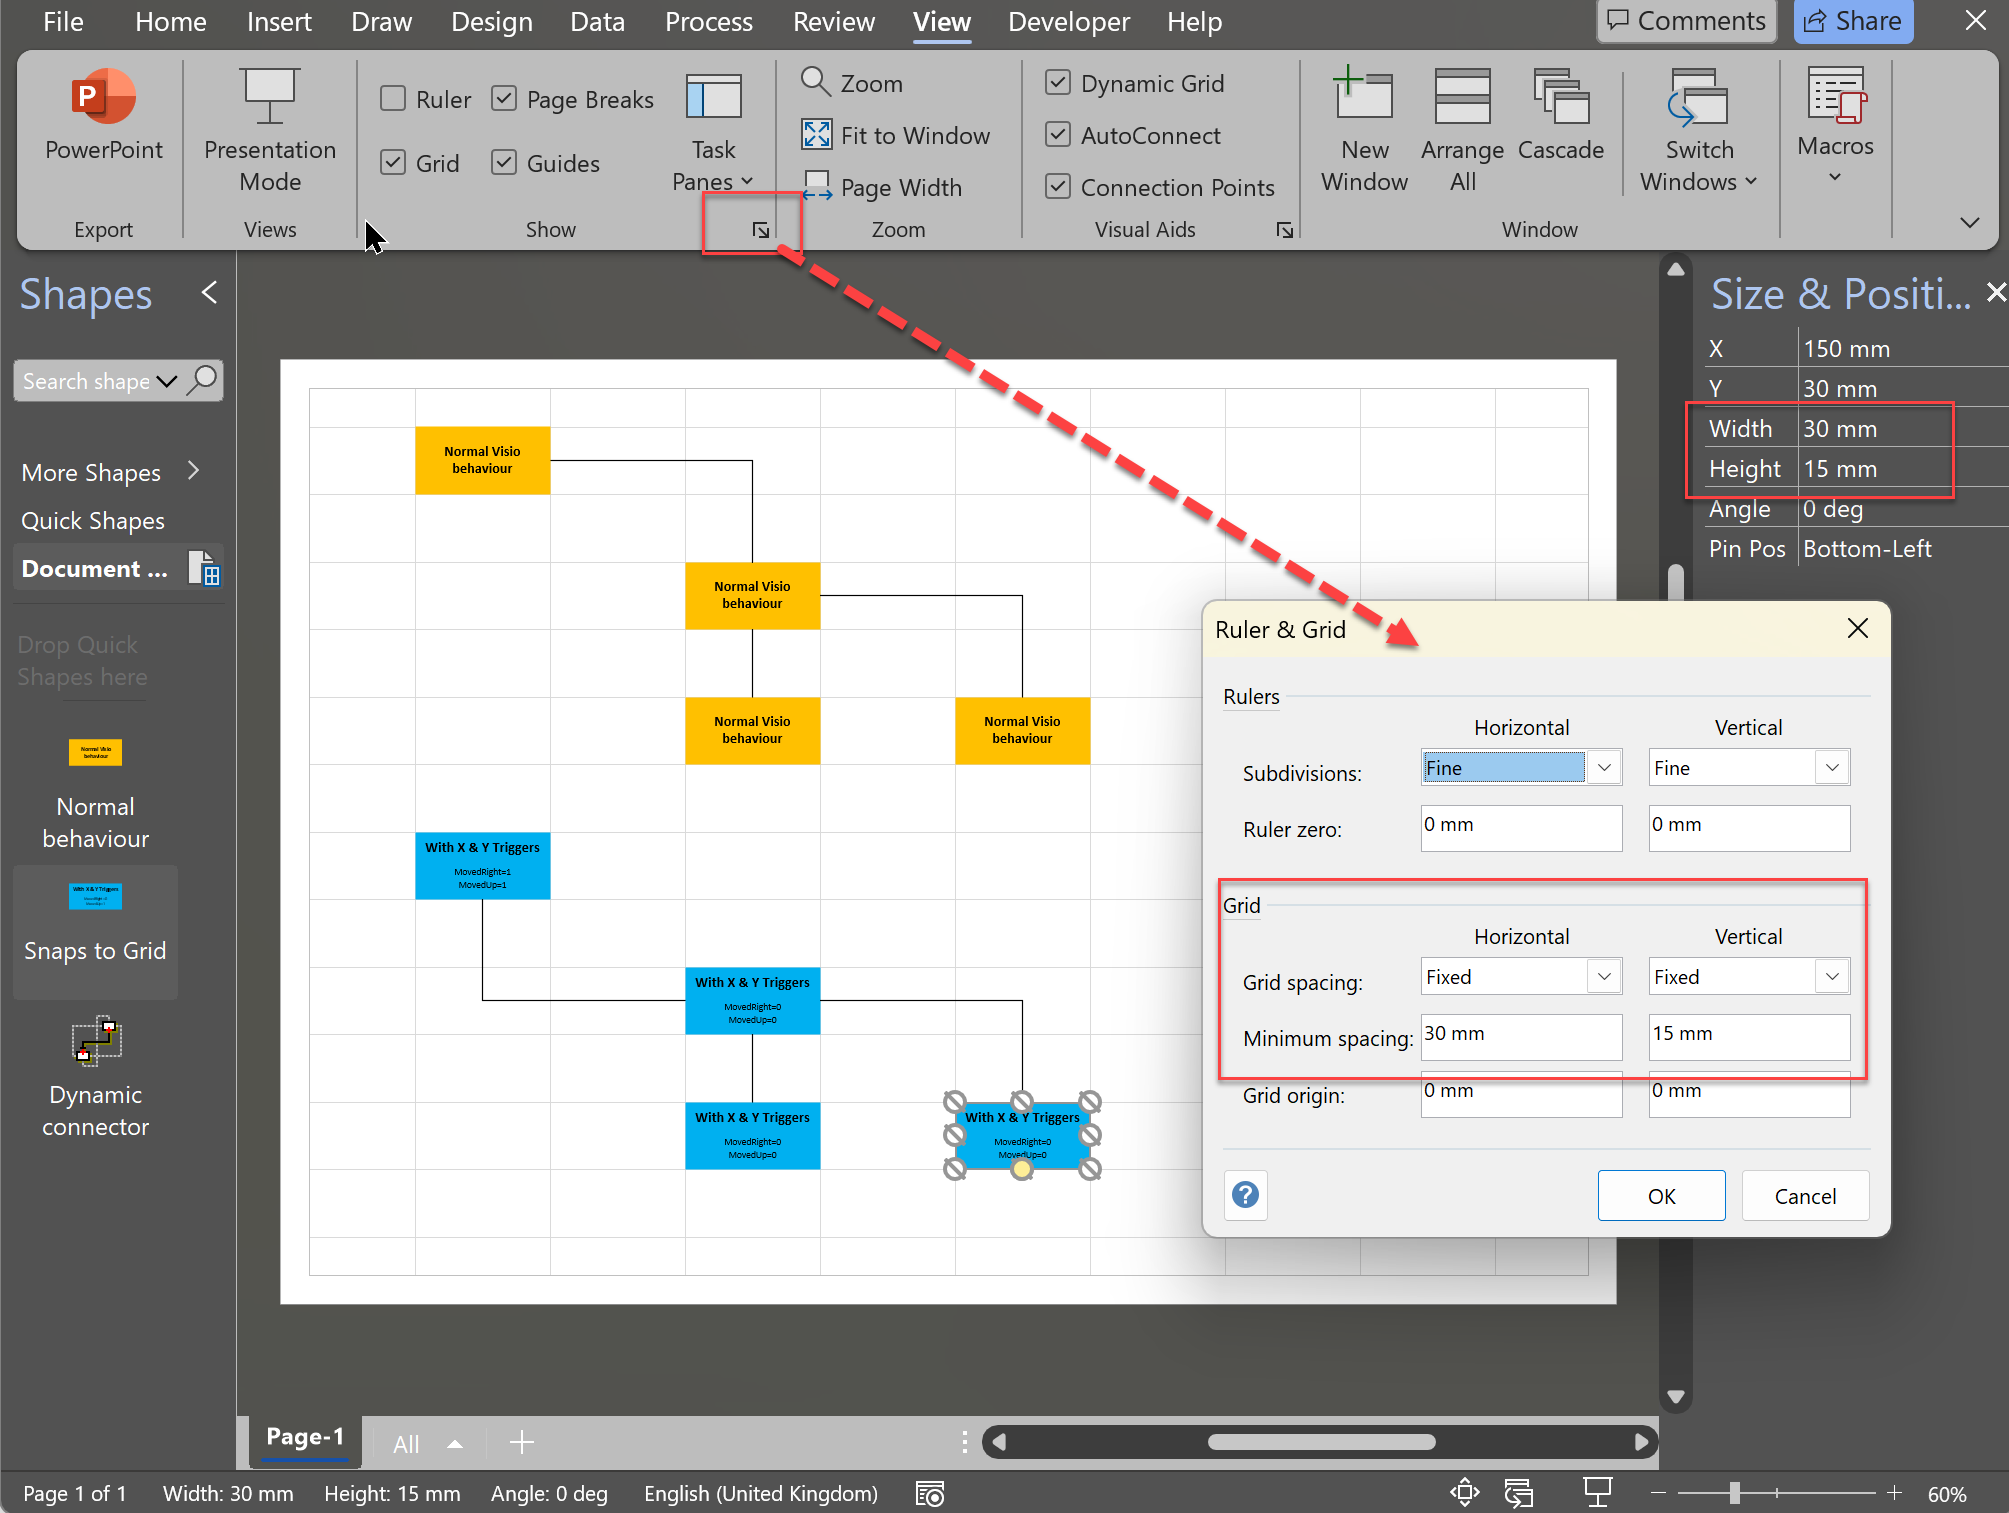
Grid Snapping Revisited
I have previously tackled the subject of snapping to grids in Visio desktop (see https://bvisual.net/2018/06/19/really-snapping-to-grids-in-visio/ ) but a recent project required me to improve the example because it did not respond to all cursor arrow keys. The problem was that the previous solution could not understand which arrow key had been clicked, therefore it did…
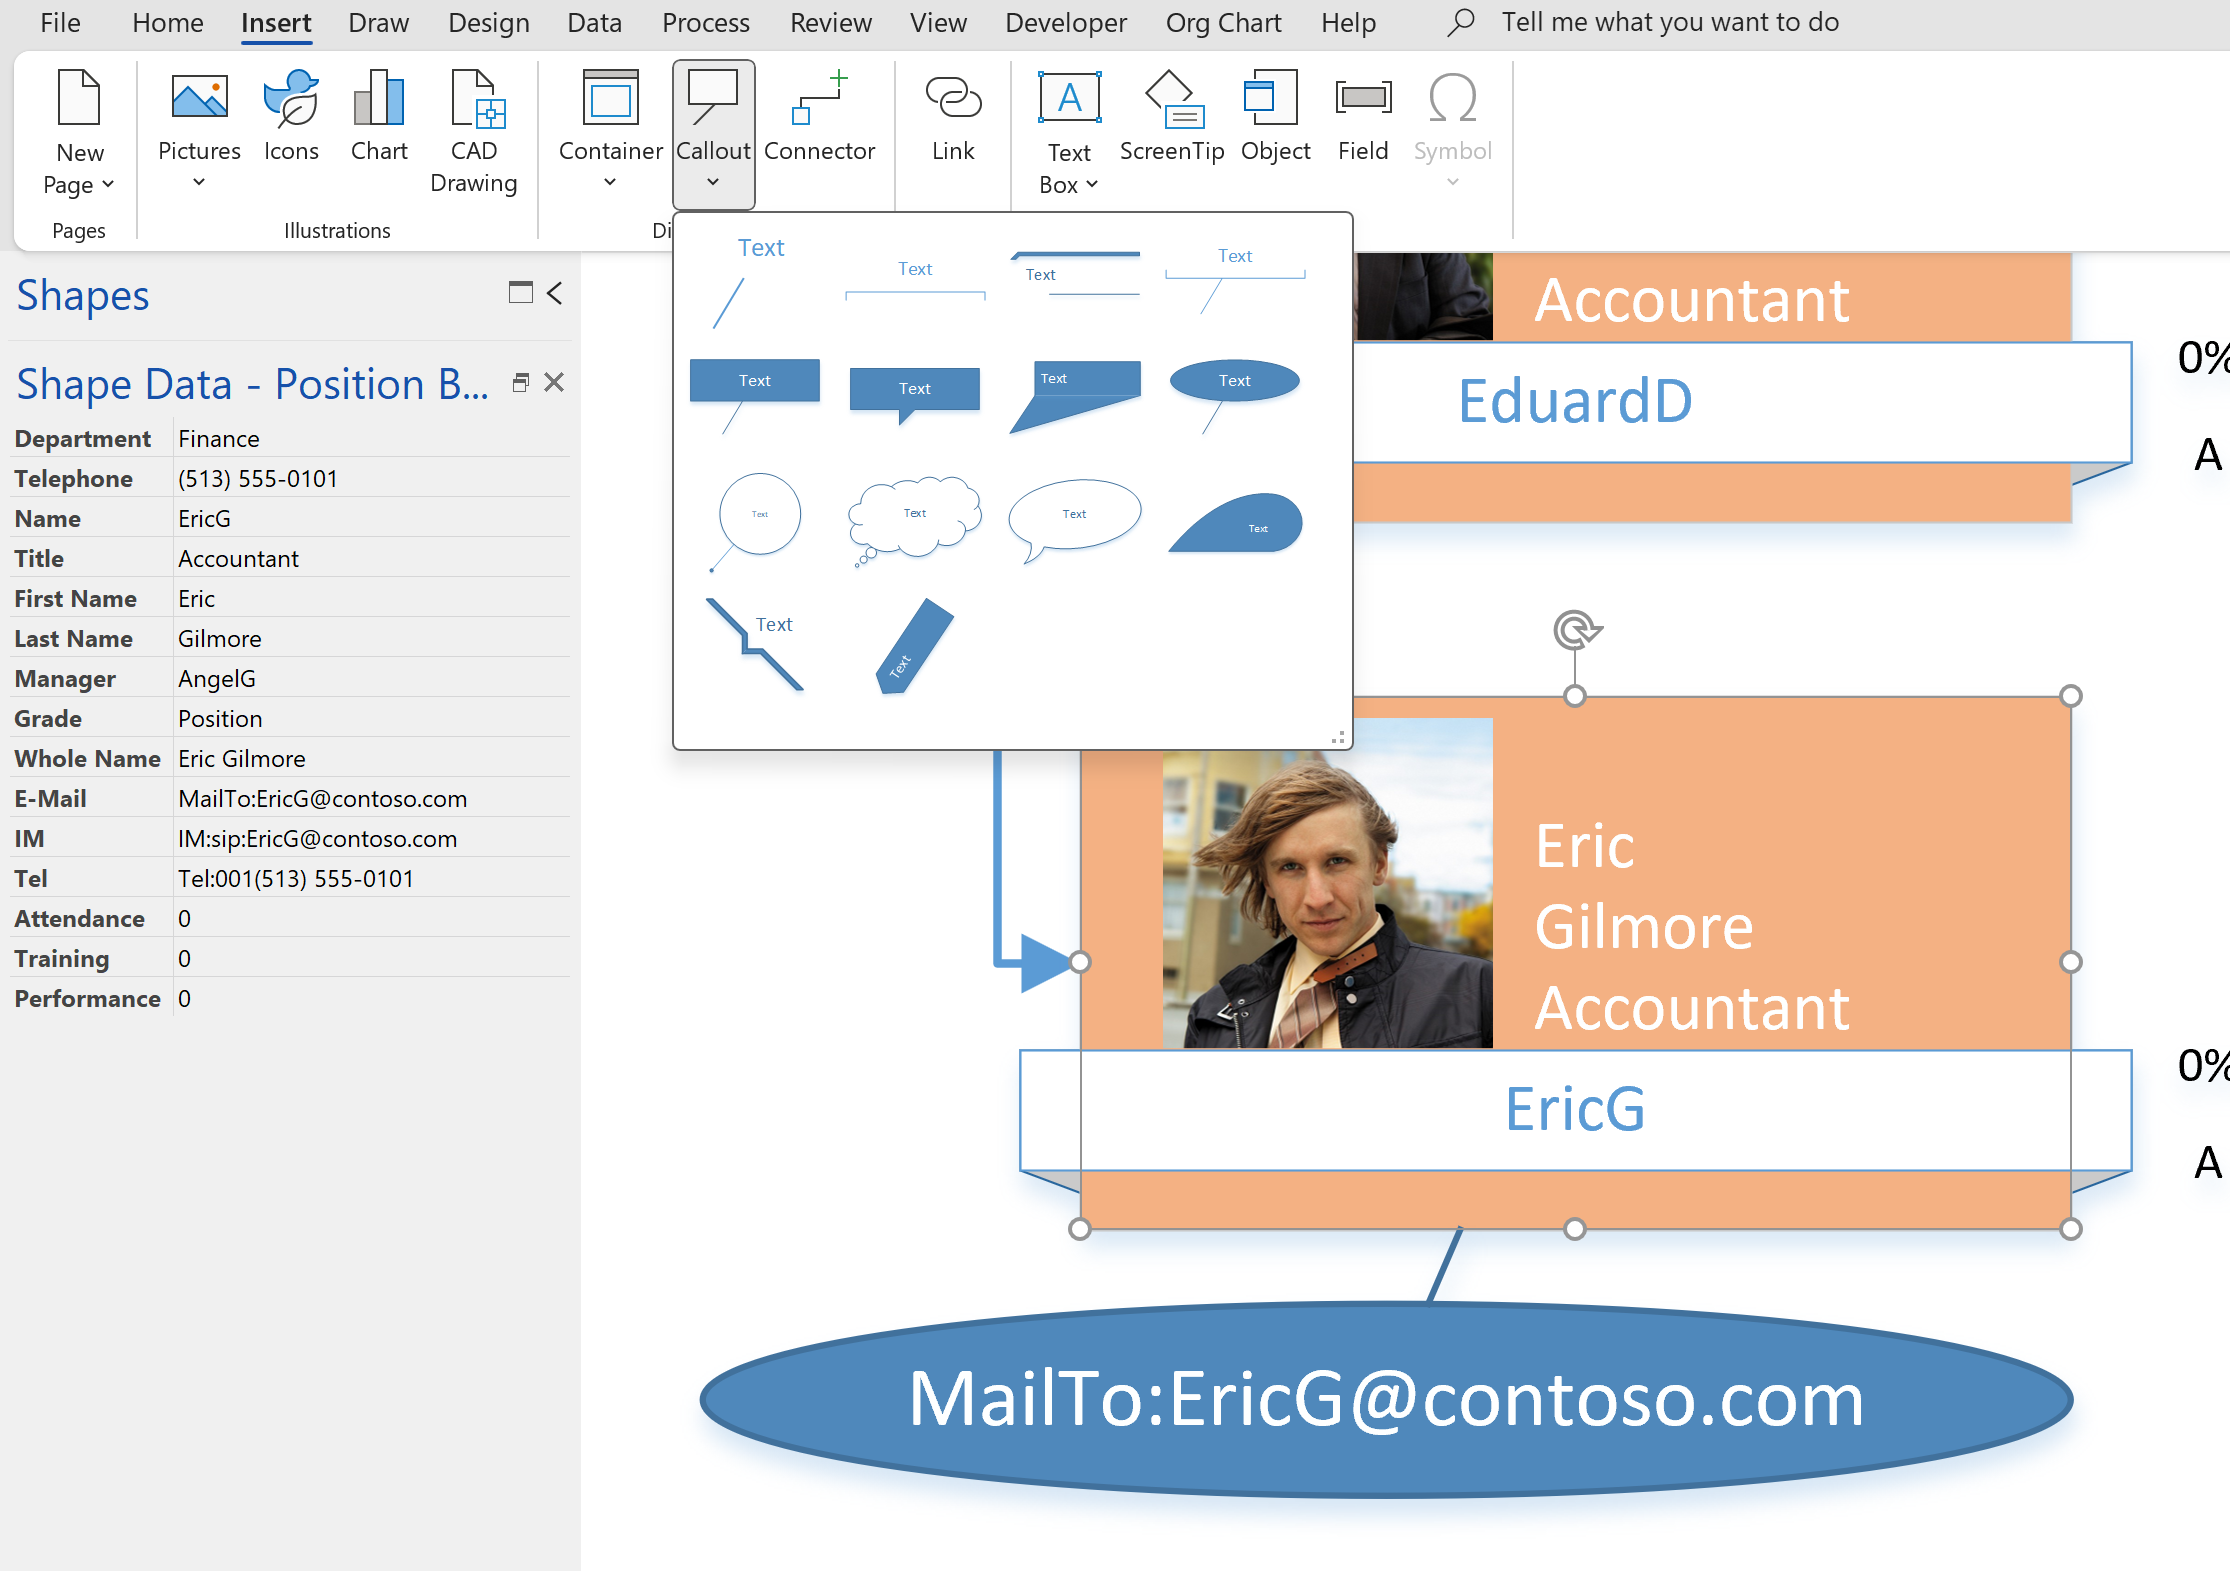
When is a Visio Callout not a Callout?
I have been a Visio user/developer since the mid-1990’s and seen the word “callout” used as part of the name of many master shapes in Visio. The images below show five ways that the term “callout” has been applied to the name of Visio master shapes. Generally, each evolution has been an advance on the…
Nice detective work, David! I need to think about a previously unresolved problem: as obscure as this case is, it could be a factor.