Most Visio users should know that there is a built-in basic report writer. I use it often, but I do get frustrated sometimes. I wrote a chapter about it in my 2007 book (see https://bvisual.net/resources/visualizing-information-with-microsoft-visio/ ), where I explained how you can edit the XML of an external report to change the column headers, but this can be a bit of a pain if the report is embedded in you document. Therefore, I have written some VBA code to provide the ability to edit embedded report column headers.
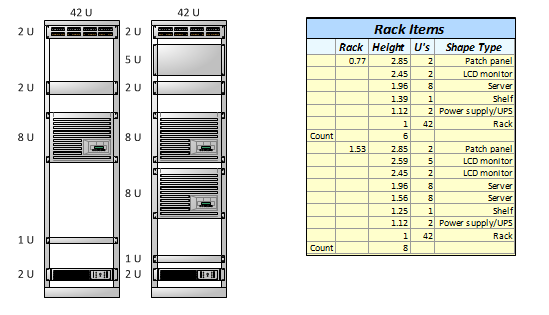
For example, here is a standard report for equipment within a rack:
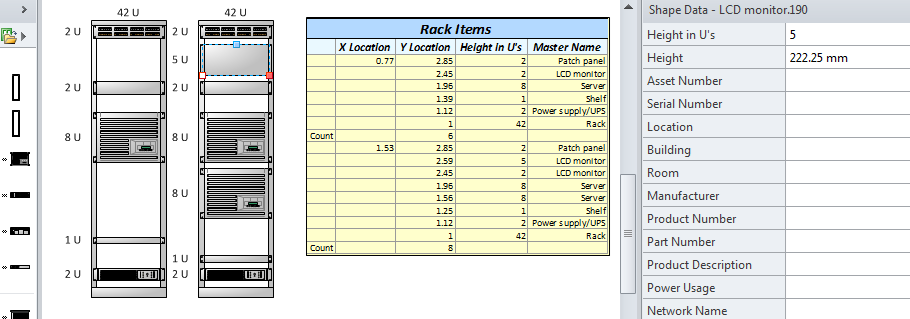
As you can see, there are four columns:
- <X Location>
- <Y Location>
- Height in U’s
- <Master Name>
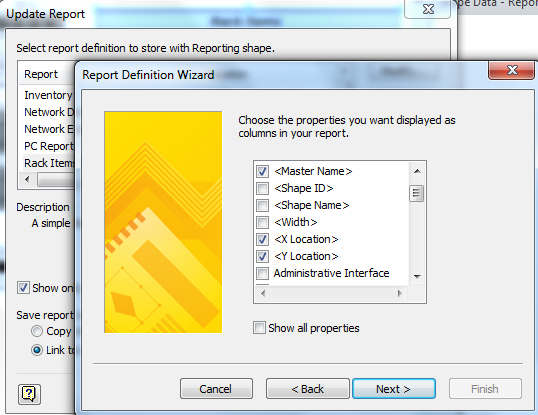
These are the default column headers that you can select using the Report Definition Wizard. The angle brackets, “<…>”, denote that these are not Shape Data or User-defined Cells, but are one of the selected other properties.
I also grouped by then <X Location>, which is the easiest way of grouping by each Rack:
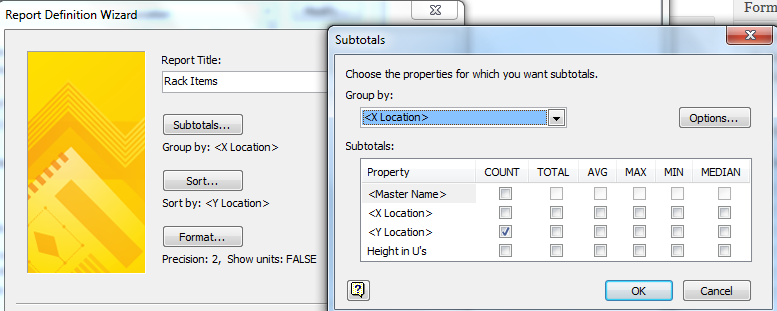
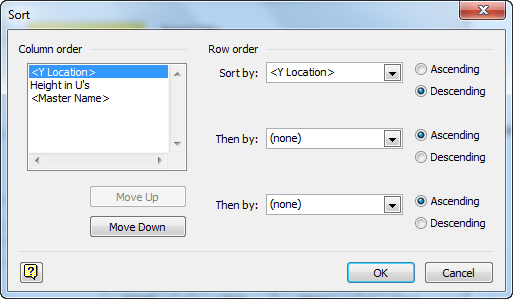
Finally, I sorted by the <Y Location> descending, because it is easier to see the correlation with the Rack elevations.
However, the header text of each these columns do not suit my report, so I want to change them. You can
I have created a small VBA project in a Visio stencil, which you can download from https://1drv.ms/u/s!AoRdXTjKEAo1im91GIZT28KeEDZk
The VBA project within the stencil includes two modules from the Visio SDK Sample Code library (modFormulaToString and modStringToFormulaForString) but also has basic classes for a report definition and report fields:
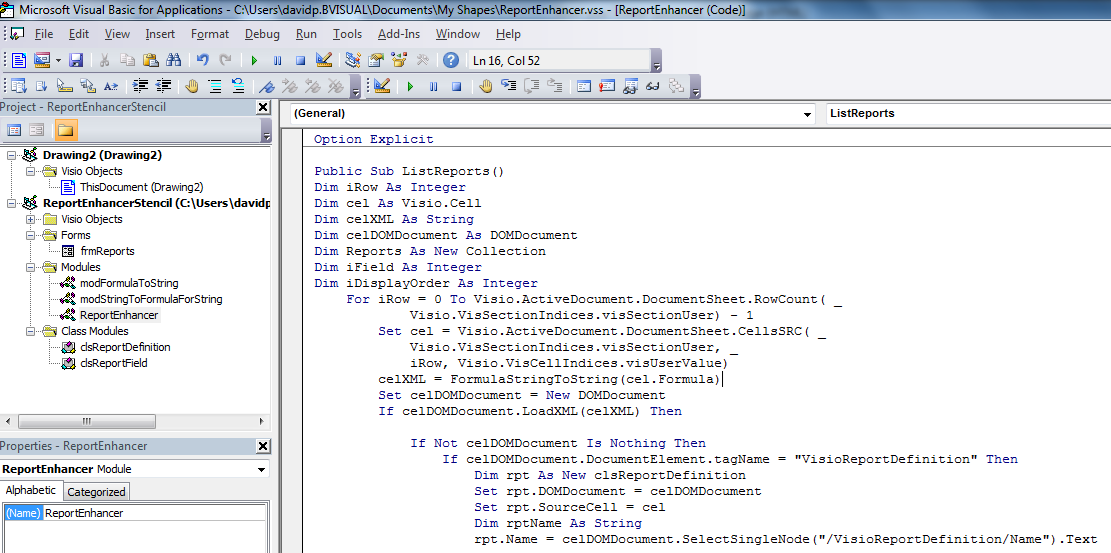
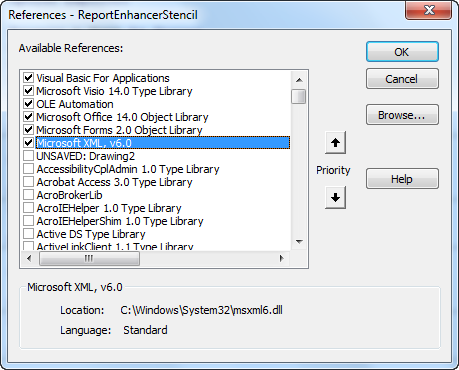
The code required a reference to Microsoft XML (my latest version is v6.0):
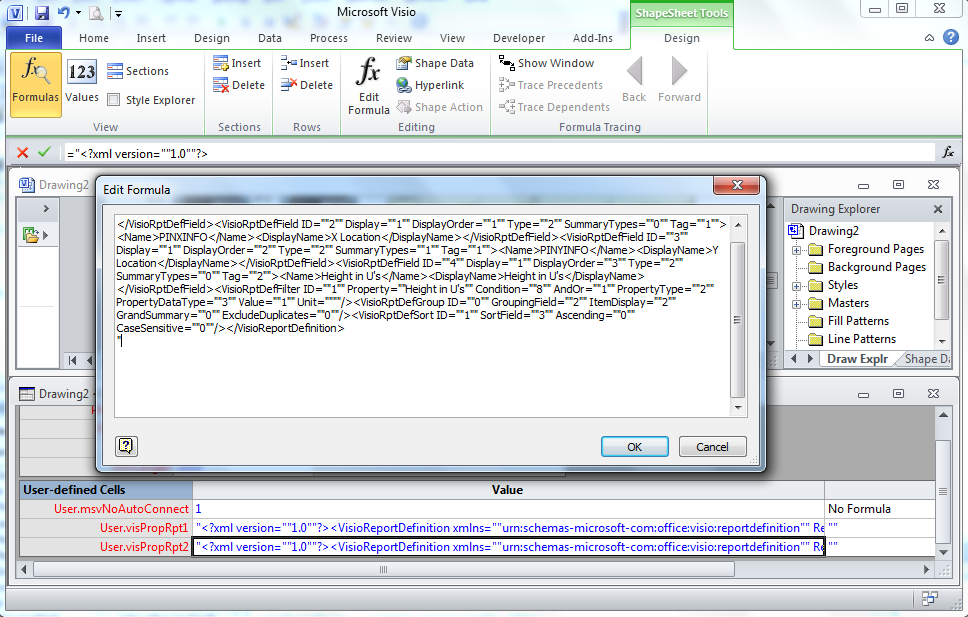
The Report Definitions, of any report that is saved in the document, are stored as strings within User-defined cells in the document’s ShapeSheet:
The code parses the XML text to create objects for each field in each report, then presents them in a form for you to select display names to edit.
If you save this stencil to your “My Shapes” folder (or somewhere else where your Visio looks for stencils), then you can simply open the stencil when you want to use it.
The stencil has just one public sub function, ListReports, which can be easily run from the Macros dialog
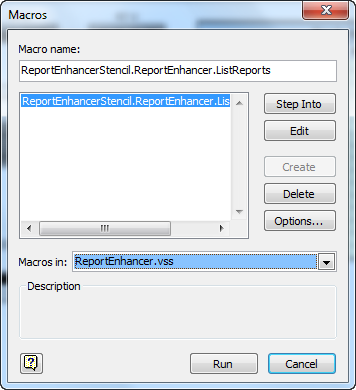
This will present a list of all of the reports within the document.
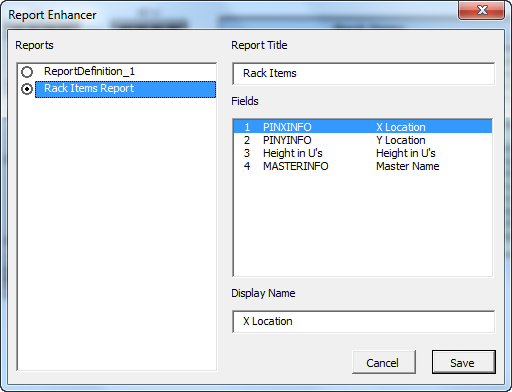
Notice that there are three columns in the Fields list box. The first column is just the display order, and the second column is the internal Name of the column, followed by the DisplayName. So, for example, the X Location column is actually known as PINXINFO internally.
You can then edit the Display Name for each of the columns, as required, and then Save the changes.
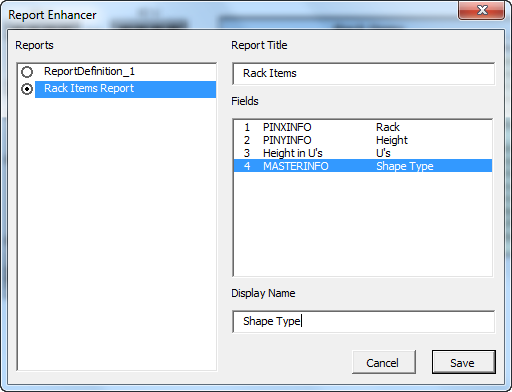
Then, when you run the report again, you will see that the column headers have been changed accordingly.
Fortunately, these changes are persisted in the report definition text, so you can use both the built-in Reports Definition Wizard and this VBA Report Enhancer whenever you like.
Nicely done (as always)
al
Is there a way to add page number and a hyperlink to these reports?that way you go have an index that could take you to a selected item.
You can get yor reports to display the Page number and/or Page name, but you need to add either Shape Data or User-defined cells to hold this. I would normally do this on the master of the shapes … before Linking to Data.
The formulas are
=GUARD(PAGENUMBER())
=GUARD(PAGENAME())
I create a visual index by using the “Off-page reference” shape from the Basic FLowchart Shapes stencil.
Can you show please me an example? Thanks!
Is there any way to include in the report the different hyperlinks in the shapes?
Unfortunately not. The Visio reporting tool does not include that feature. It is fairly trivial to do in code, for example:
Public Sub ListHyperlinks()Dim shp As Visio.Shape
Dim hyp As Visio.Hyperlink
For Each shp In Visio.ActivePage.Shapes
For Each hyp In shp.Hyperlinks
Debug.Print shp.Name, hyp.Row, hyp.Address, hyp.SubAddress, hyp.Description
Next
Next
End Sub
Compile error: user-defined type not defines (celDOMDocument As DOMDocument)
Also, do not see any user cells in the document shapesheet defining the reports
visio 2007
It seems that the DOMDocument objects are now DOMDocument60, so adding the 60 to the end of each Dim line fixed the compile problem, but then there was an issue that Microsoft chnaged the way that the SelectSingleNode(..) method works… https://social.msdn.microsoft.com/Forums/en-US/5ae834d2-59ed-44d6-b6da-0a7bf5795caa/issues-with-selectsinglenode-in-vba-w-msxml6?forum=xmlandnetfx
So, I have updated the vss file now. Please re-download and try again.
Also, the code only checks report definitions that are saved in the document. So try Modify for a Microsoft report definition, and then Save in the drawing at the end ….
I downloaded the stencil again. Got the same error, so I added the “60” as you stated above.
It went a little further, then got the old “variable unset” error on this line…
rpt.Name = celDOMDocument.SelectSingleNode(“/VisioReportDefinition/Name”).Text
suspect it would have occurred again.
Also, even after saving the report in the document, I still see nothing in the pages shapesheet that looks anything like a report definition.
oops, nevermind on the report in drawing. I was looking at the page shapesheet NOT the document shapesheet where it was!
Interesting stuff Mr Parker.
Is it possible to produce reports in a transposed manner? I want to generate a mass balance table with the properties( data headings) in rows and the shape data in columns rather than the other way around.
Regards,
Peter
Not really possible directly, but this is quite possible in Excel once you have exported the data from Visio.