The Visio visual in Power BI provides many new opportunities to blend the extraordinary capabilities of Power BI to connect to an unparallelled number of data sources and visualizations, with the vast amount of Visio diagrams created for wide variety of purposes.
This will enable you to visualize your business in an intelligent and insightful way, that has never been previously possible. We can show you how to ensure that you are creating and utilizing these Visio data graphics in the most efficient manner.
Synchronize multiple Visio visuals simply
You can use multilple Visio visuals on the same PowerBI tab, and have their data synchronized, making it easy to see the context of the filtered values. Colors can be used to represent different values to increase comprehension.
If the above does not display properly then go to bit.ly/VisioPowerBIOrgPlan
Overlay icons and data bars for immediacy
Font symbol characters can be used as icons or data bars to automatically display different values, making them instantly recognisable.
If the above does not display properly then go to bit.ly/VisioDC
Get a free guide to Visio and Power BI.
Latest blog articles about Visio and Power BI
Teams Tuesday Podcast Recording about Visio
I am delighted to share the link to my recent demonstration and conversation with fellow MVP Peter Ward about Visio in Teams. We discussed more than just Visio … and I look a bit like Max Headroom! (more…)
Visio Presentations for the Microsoft Ignite The Tour 2020
Just when we thought the pandemic was coming to an end, another variant appears to scupper our plans. So, resuming in-person events is delayed, and the world isn’t safe until the world is immunised. Therefore, I decided to make the presentations that I was going to be presenting on the abandoned Microsoft Ignite The Tour…
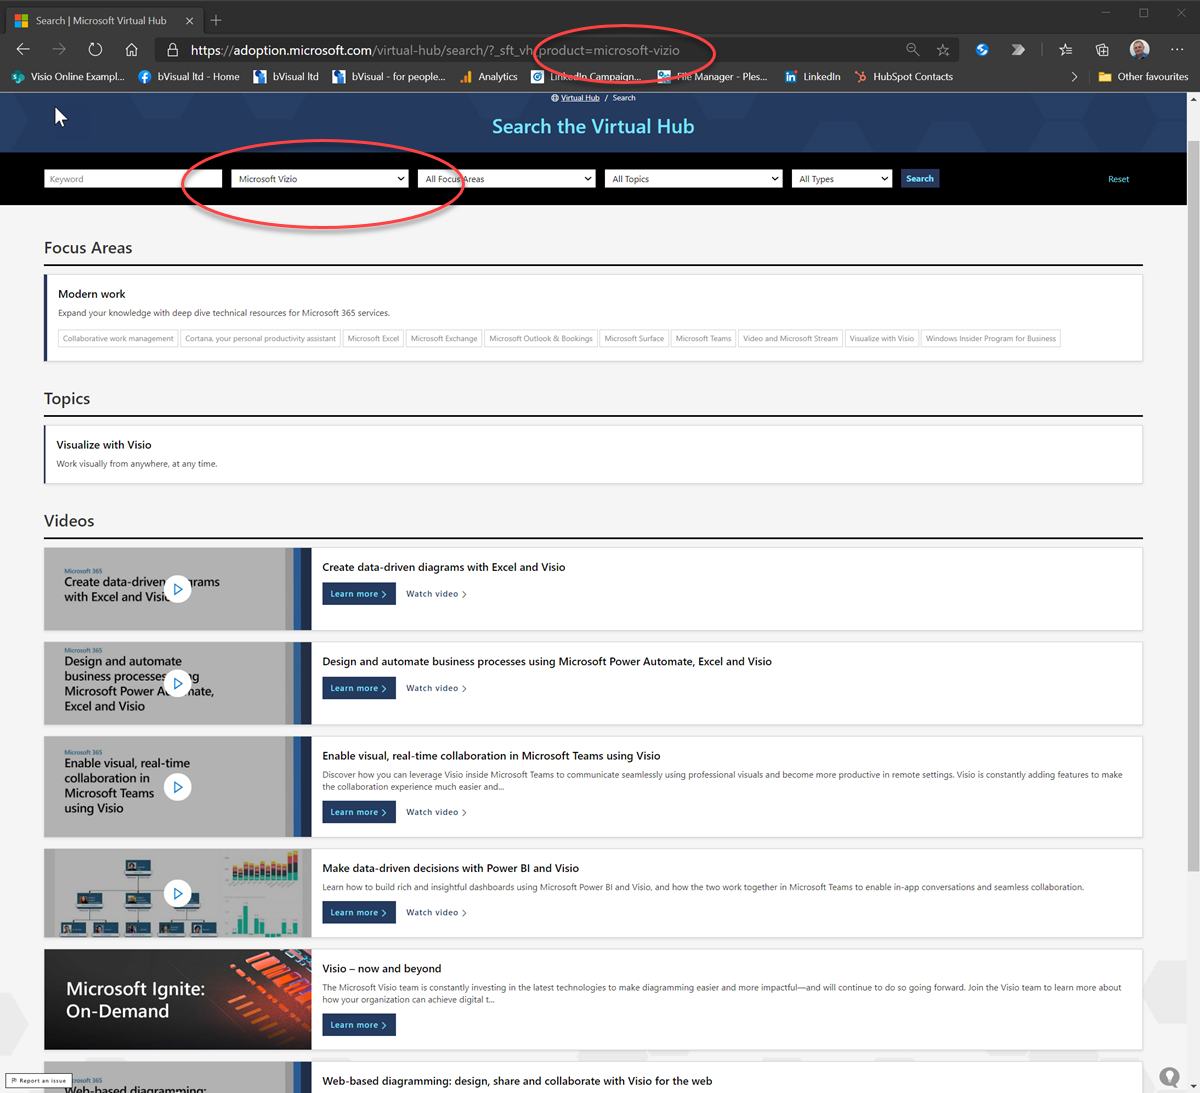
Visio is NOT Vizio!
Update 1 : Microsoft read this post and immediately corrected the spelling so the following now works : https://adoption.microsoft.com/virtual-hub/search/?_sft_vh_product=microsoft-visio 🙂 Update 2 : Mr VisGuy! “spelt” is the same as “spelled” outside USA! Aarghh! What kind of message is sent out if a company does not know how to spell the name of their own…
My sessions at MS Ignite the Tour 2020 London
I was pleased to present two sessions at London ExCel last week about Visio. Attendance was good, maybe too good because some could not get close enough to hear. There was a lot of background noise, and my presentations were too long for the 15 minutes slot, but content was eagerly received. I told everyone…
Countries of the World in Power BI with Flags
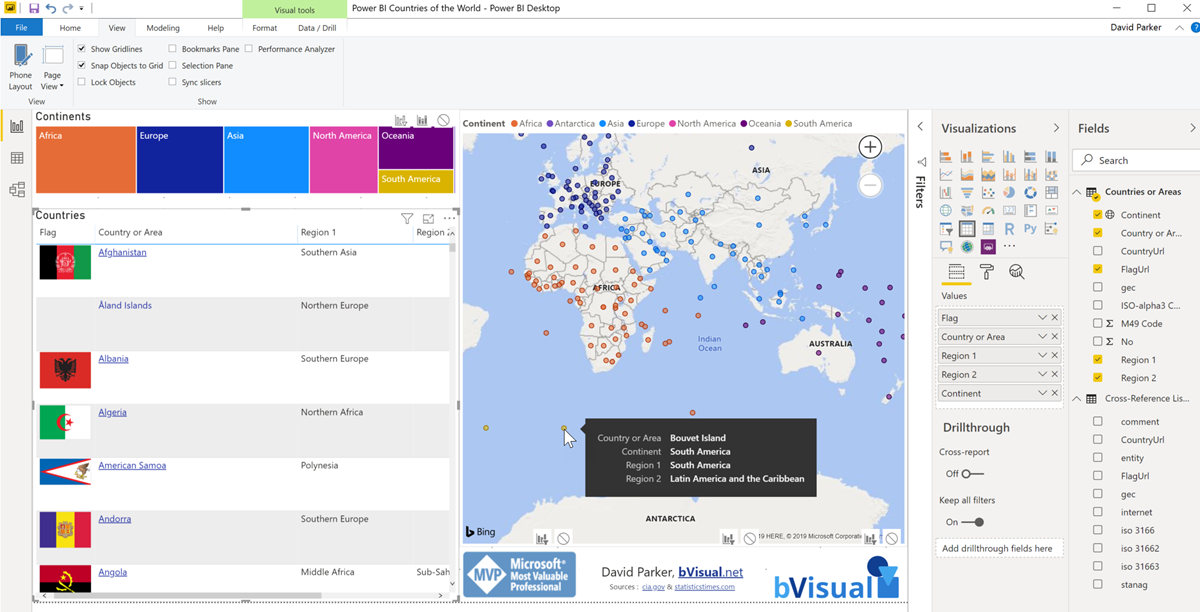
I like Power BI, and the latest update features the ability to set a custom web url onto another column. So, I couldn’t resist trying it in the example below. Notice that the Country or Area values are hyperlinks to the url of the country page in the CIA World Factbook. [UPDATE Oct 2021: The…
Overcoming ‘We can’t open your file in Visio because it exceeds the shape count limit’ in Power BI
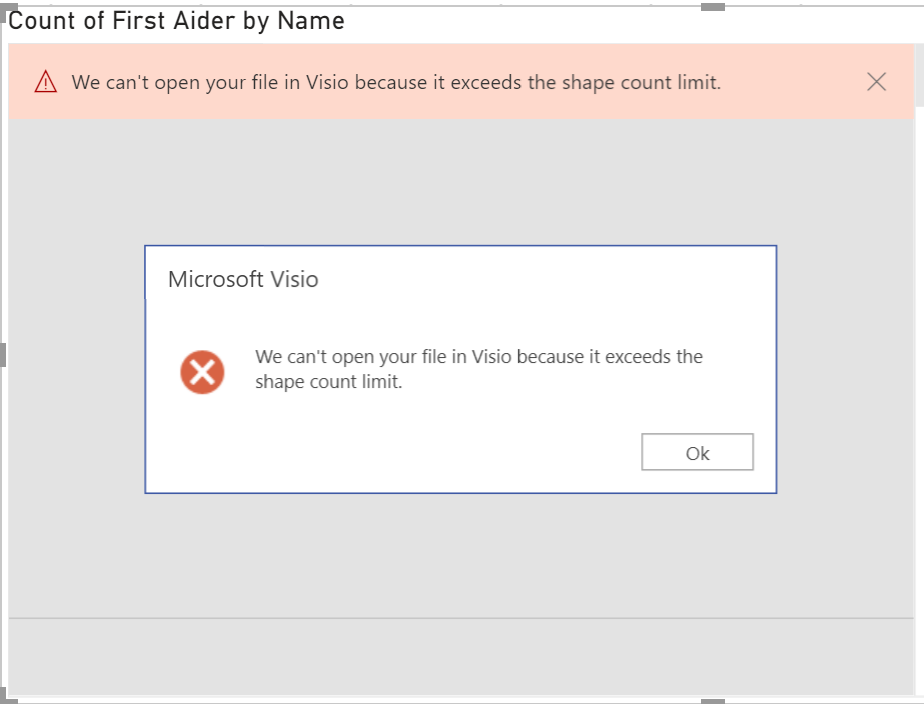
If you are one of the increasing number of Power BI users that have discovered that the Visio Visual gives you the great ability to include Visio diagrams in your dashboard, then you may have come across the following error, ‘We can’t open your file in Visio because it exceeds the shape count limit’ in…


