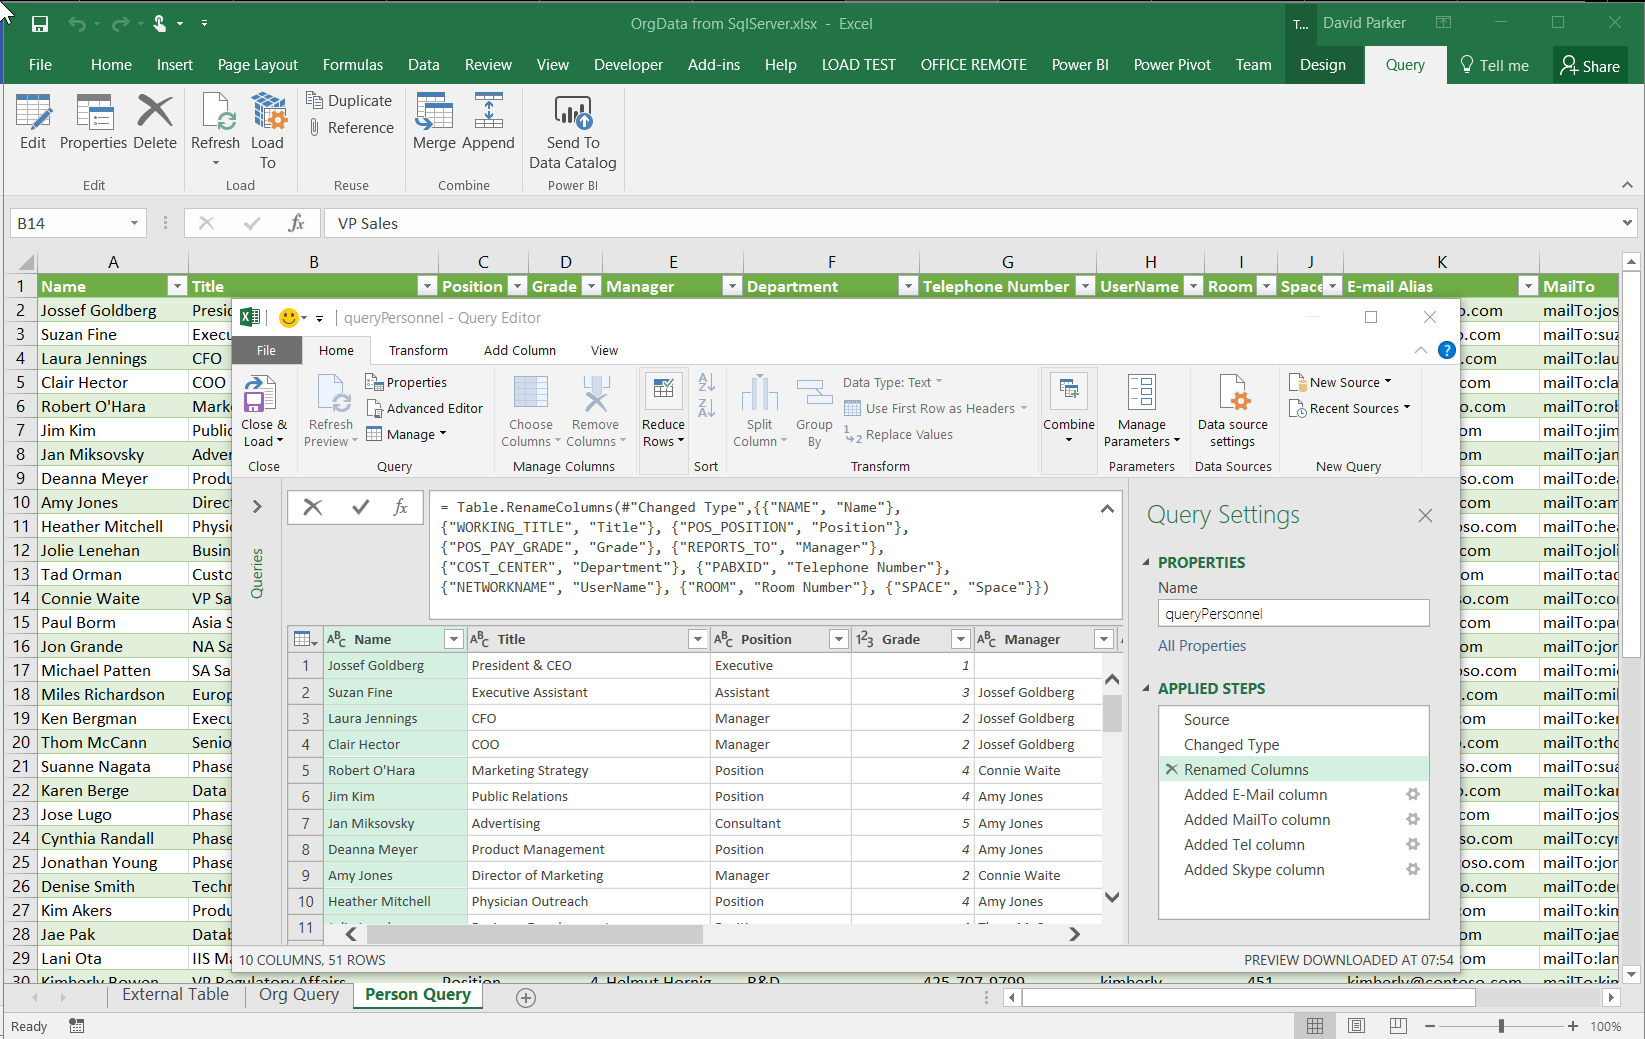
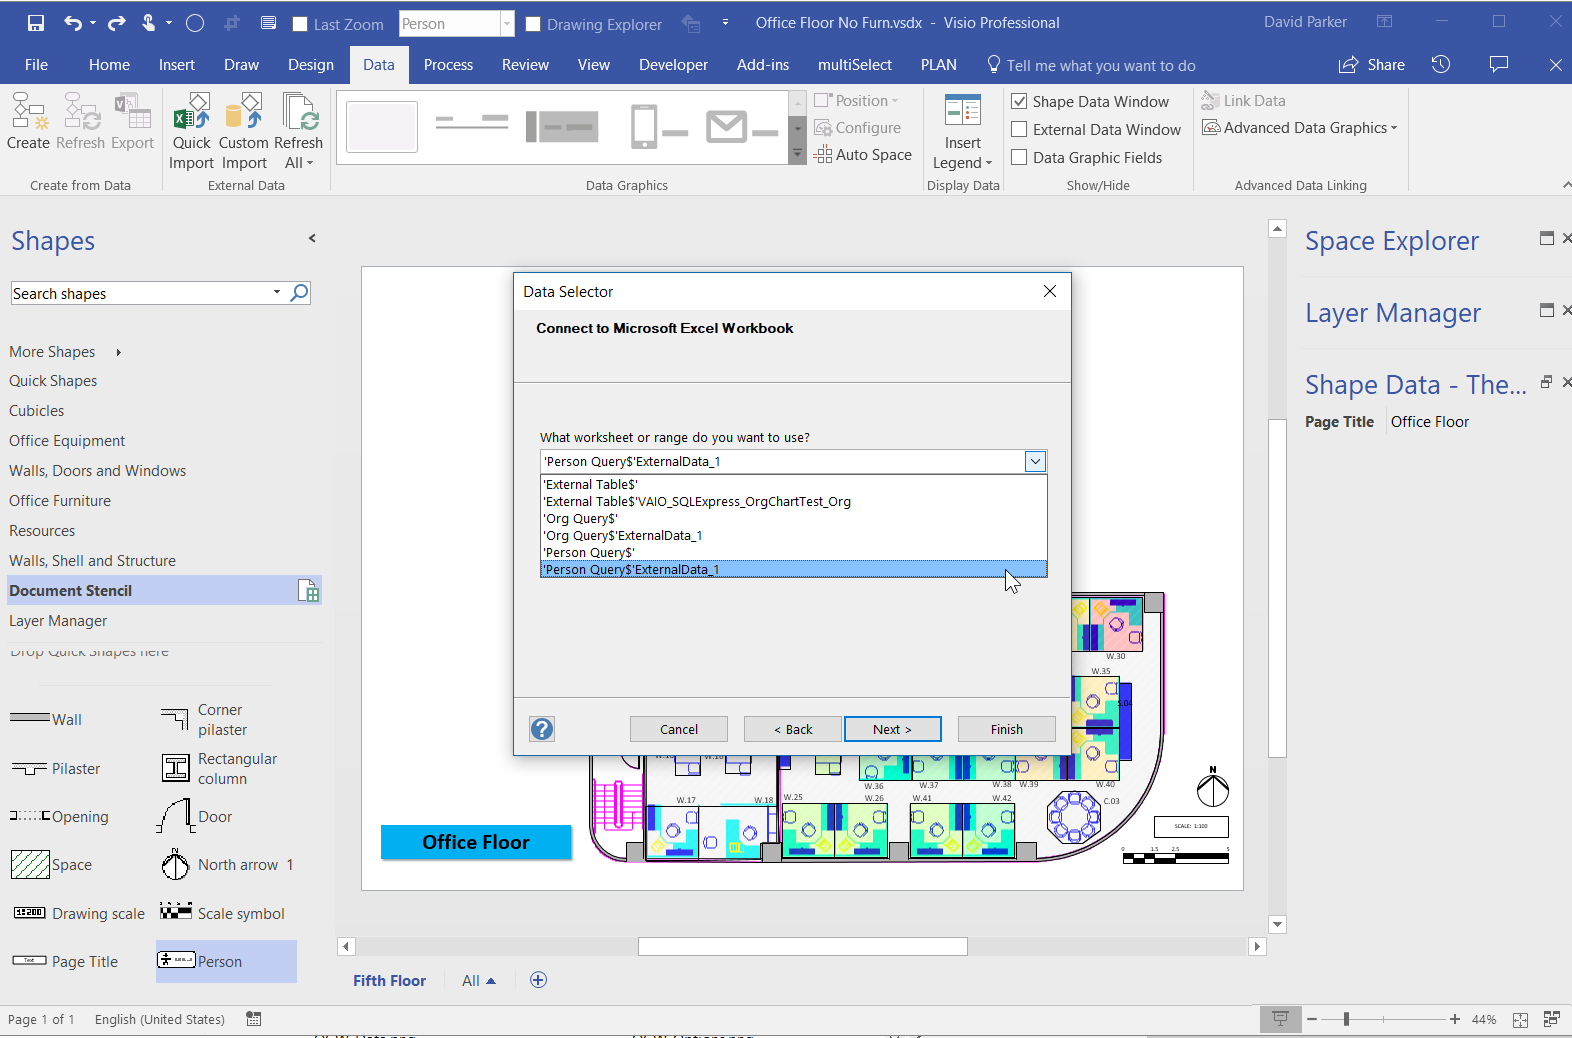
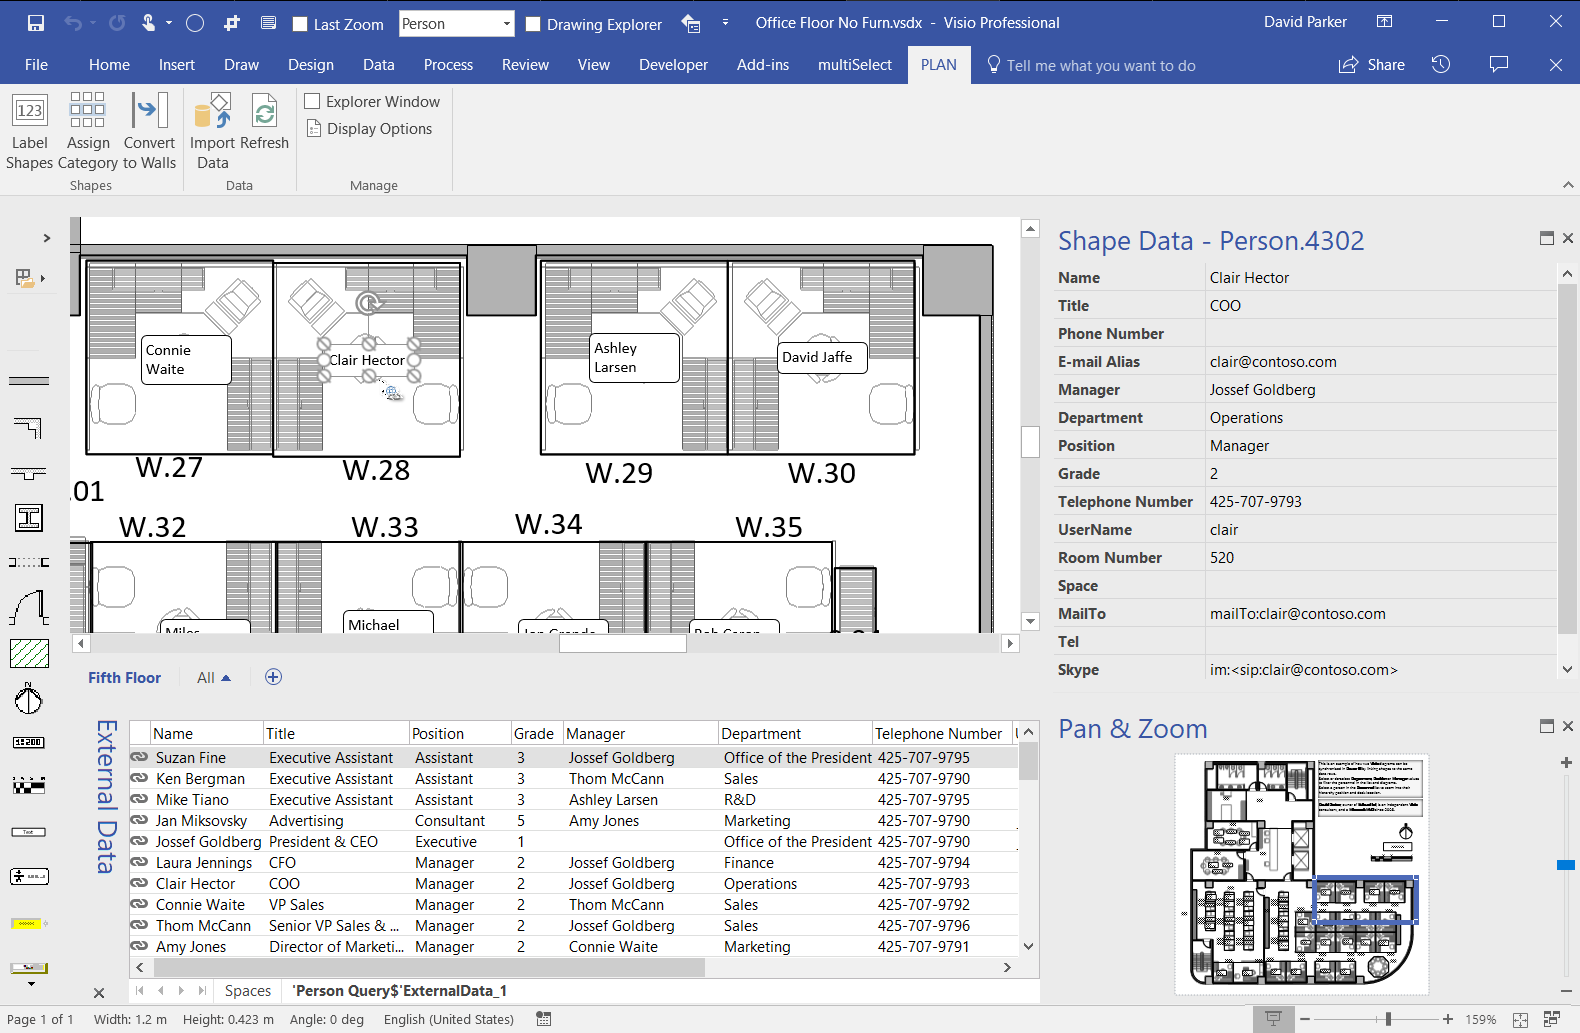
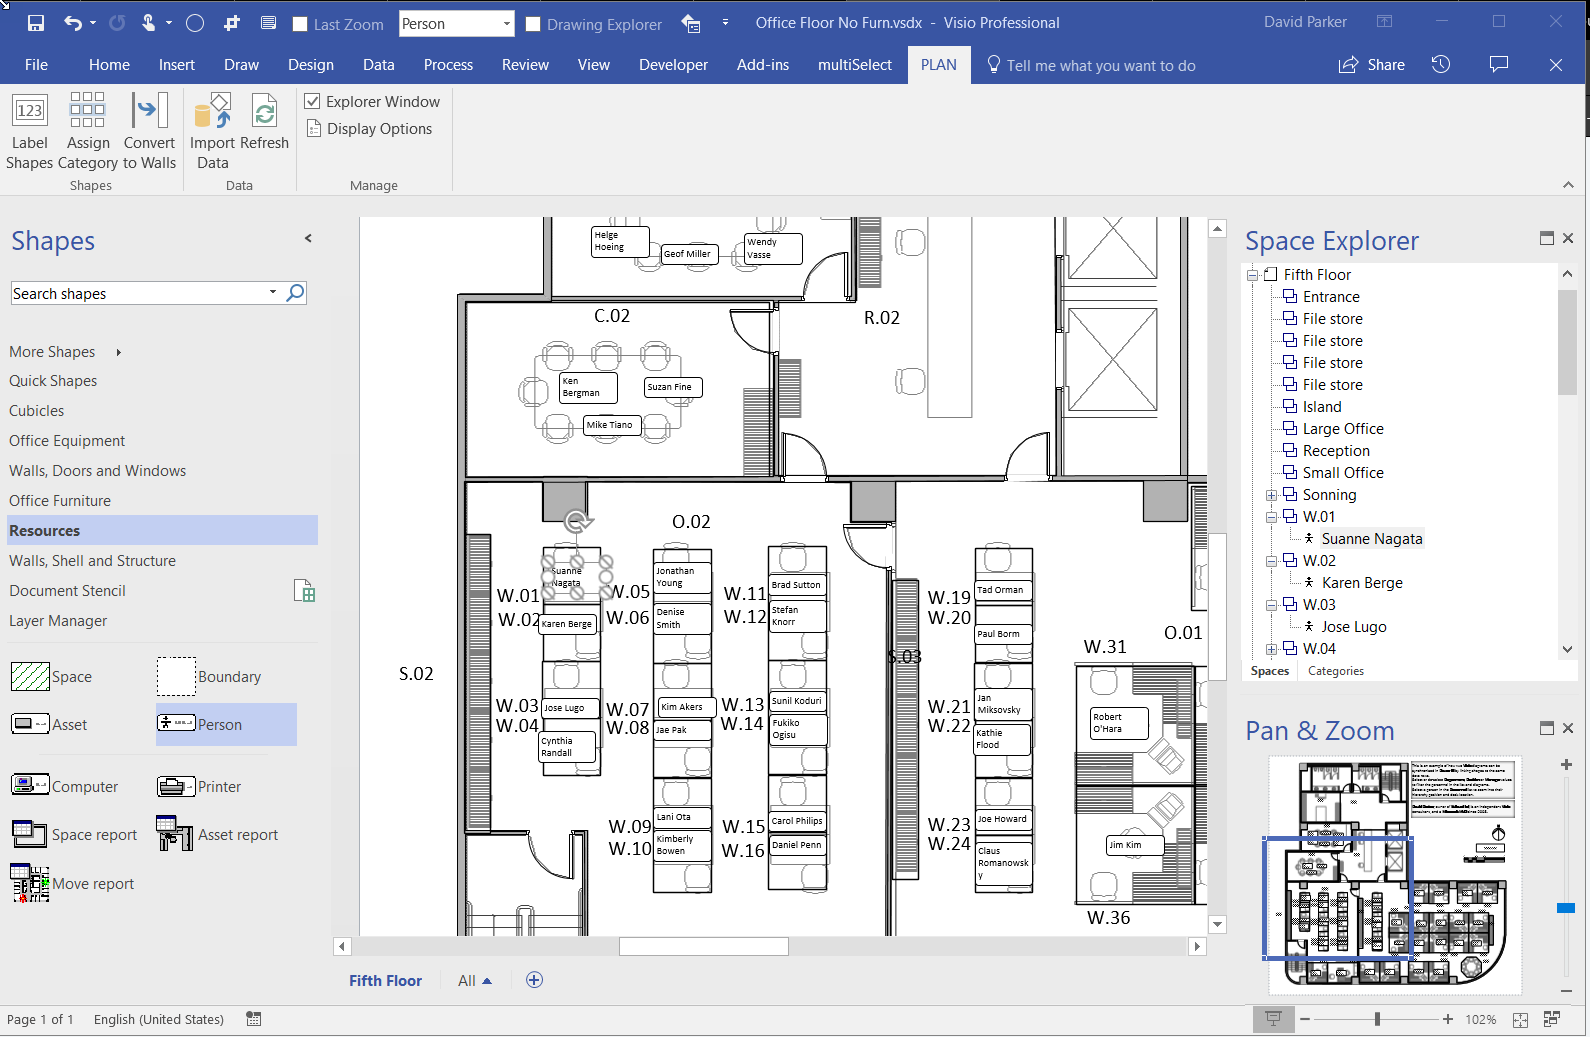
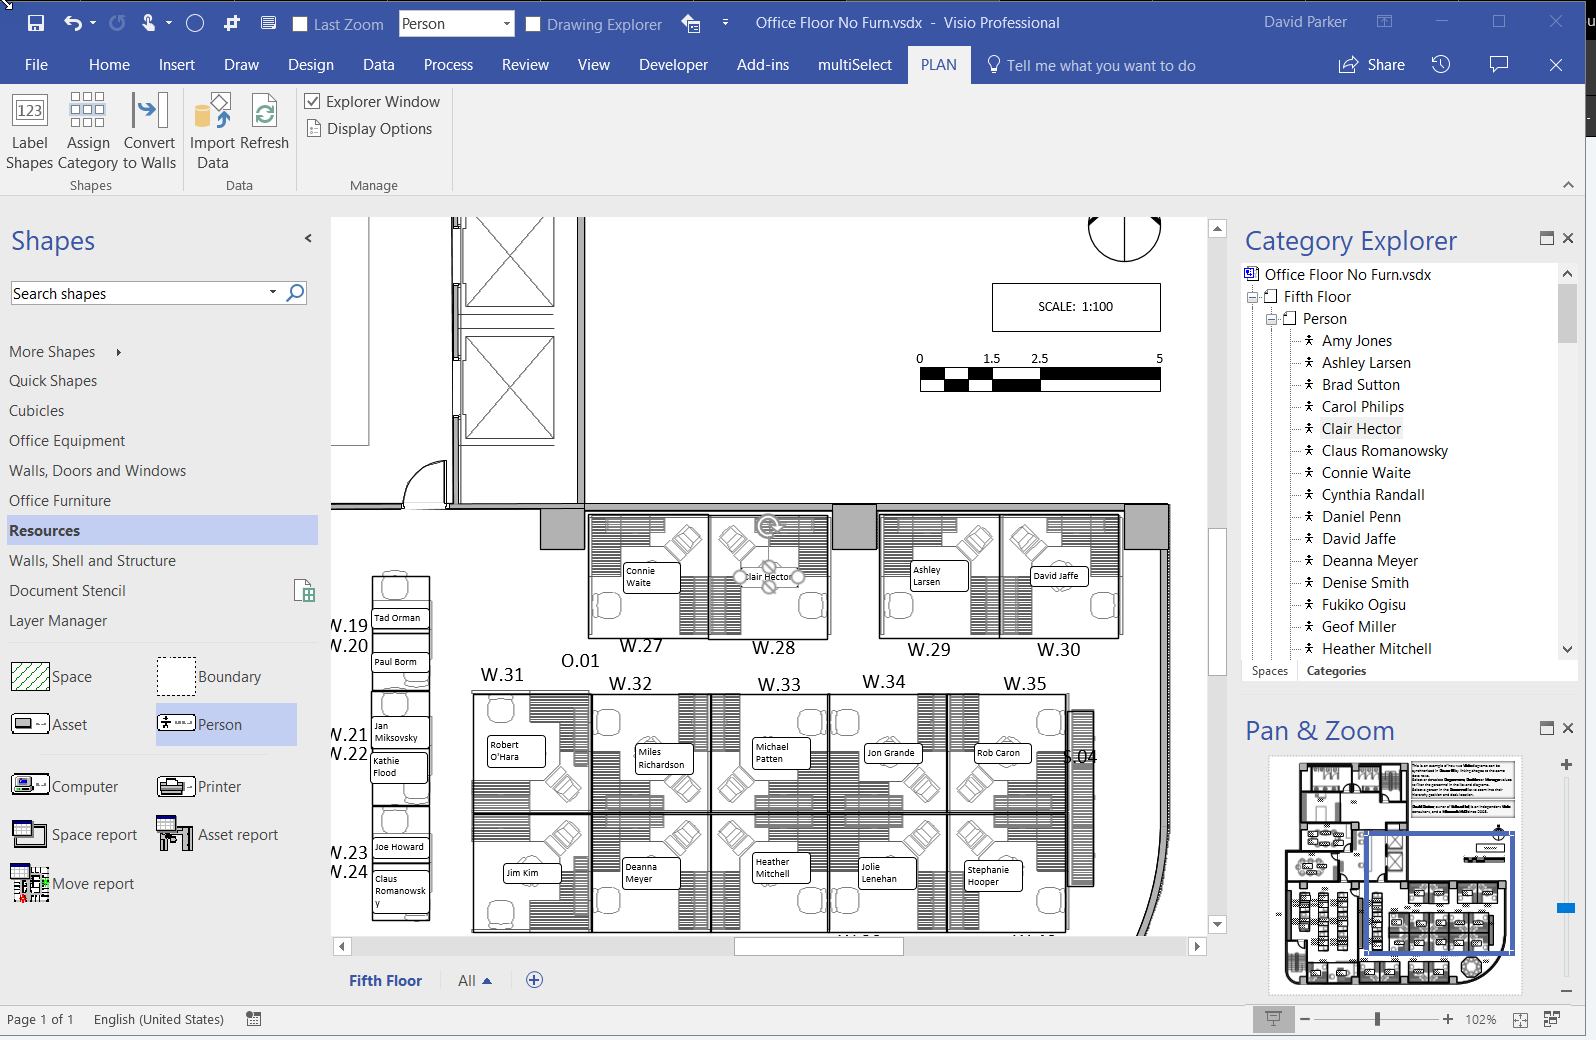
My last article, Aliasing Data Columns for #Visio Organization Chart Wizard , mentioned the slight anomalies in the default Shape Data rows for the Organization Chart shapes and the Resources / Person shape. This prompted me to create an alternative view of the same data that can be linked to the Person shapes on a floor plan, and then to use the preview Visio Custom Visual in Power BI to display both views of personnel synchronised by the same data. This demonstrates how easy it is to create an effective dashboard for locating personnel locations and their position within an organisational hierarchy at the same time!
Visio Online
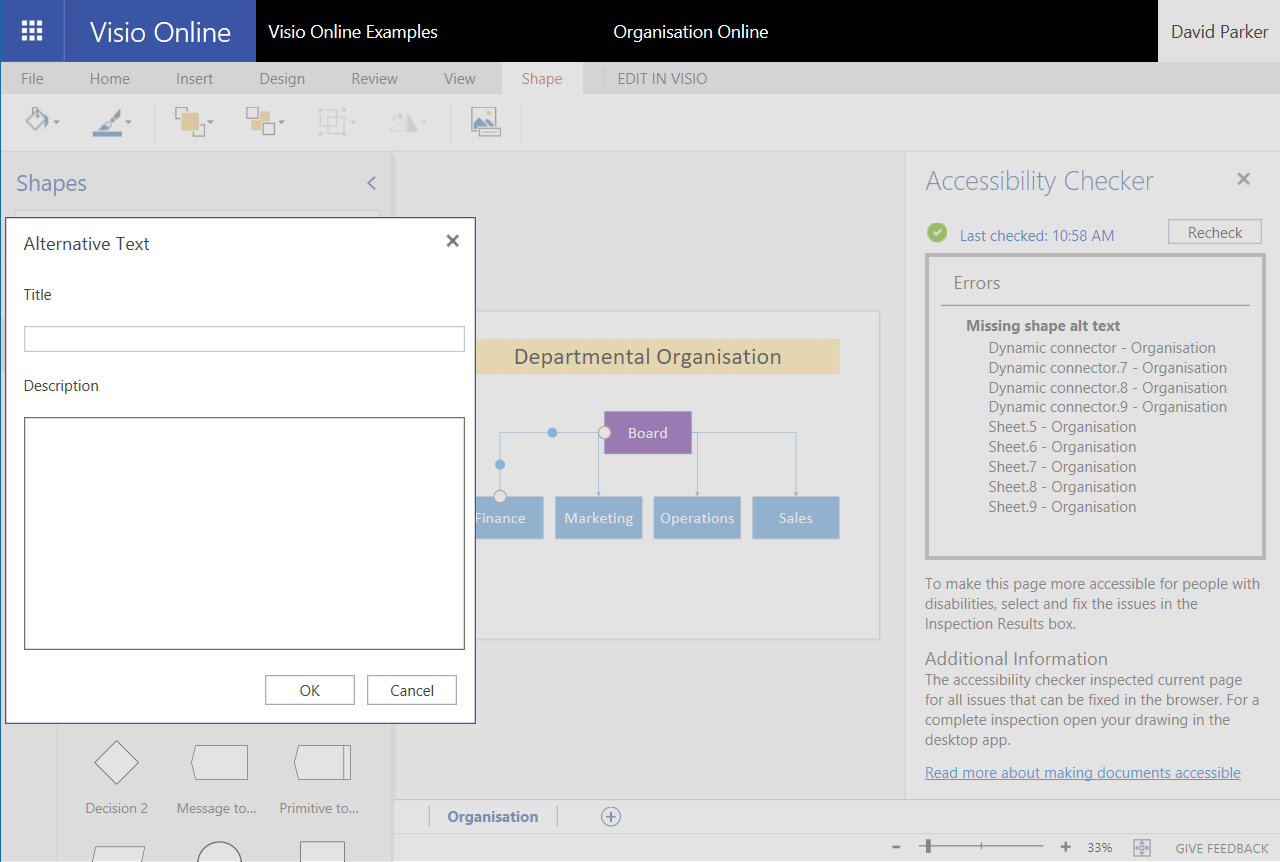
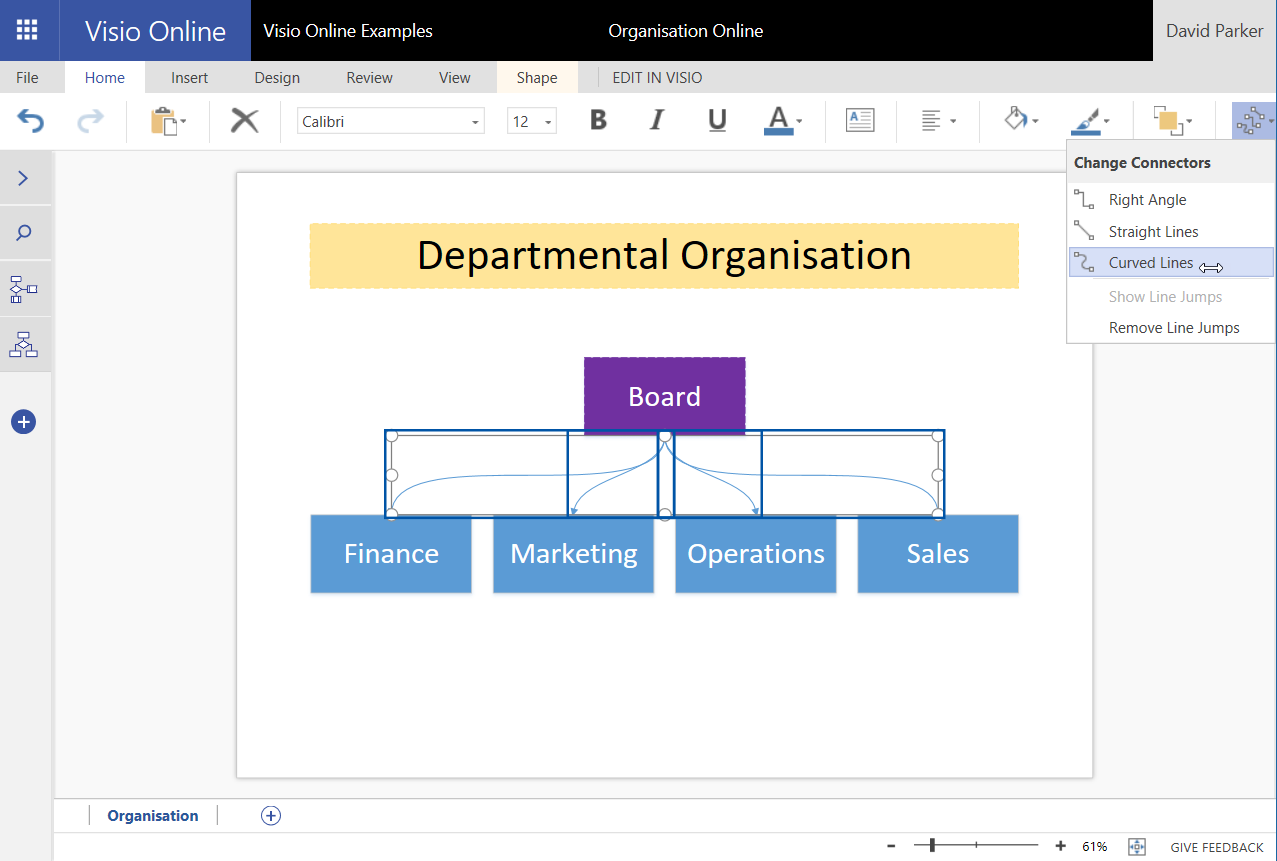
Create & edit Visio diagrams in browser
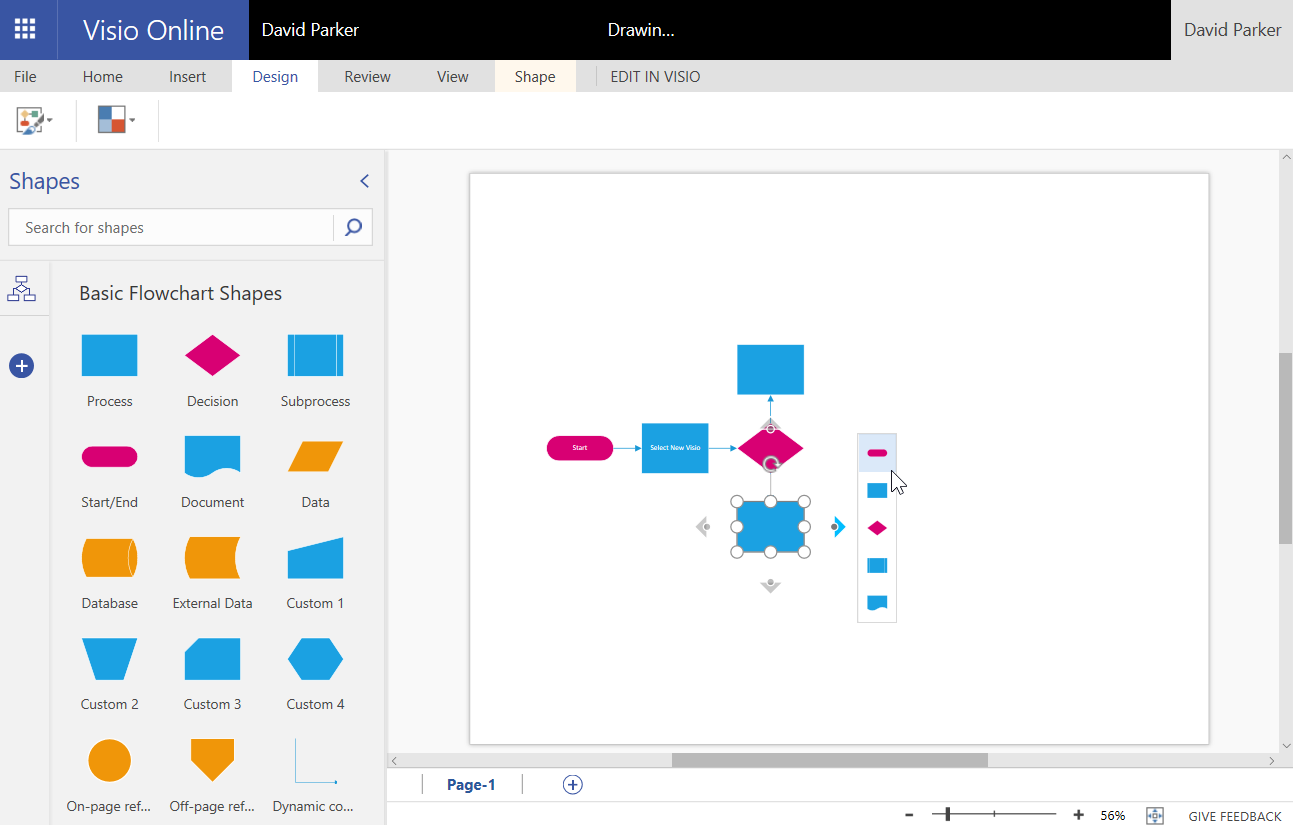
Visio Online is now generally available! You can read more about it here , but what does it mean? Well, if you have Visio Pro for Office 365 (like me) then you should find that it is now converted to Visio Online Plan 2, which includes Visio Online as well. Visio Online Plan 1 does not include Visio Pro for Office 365, but these users can view all Visio documents, and can also create and edit simple ones (see the FAQ for more details).
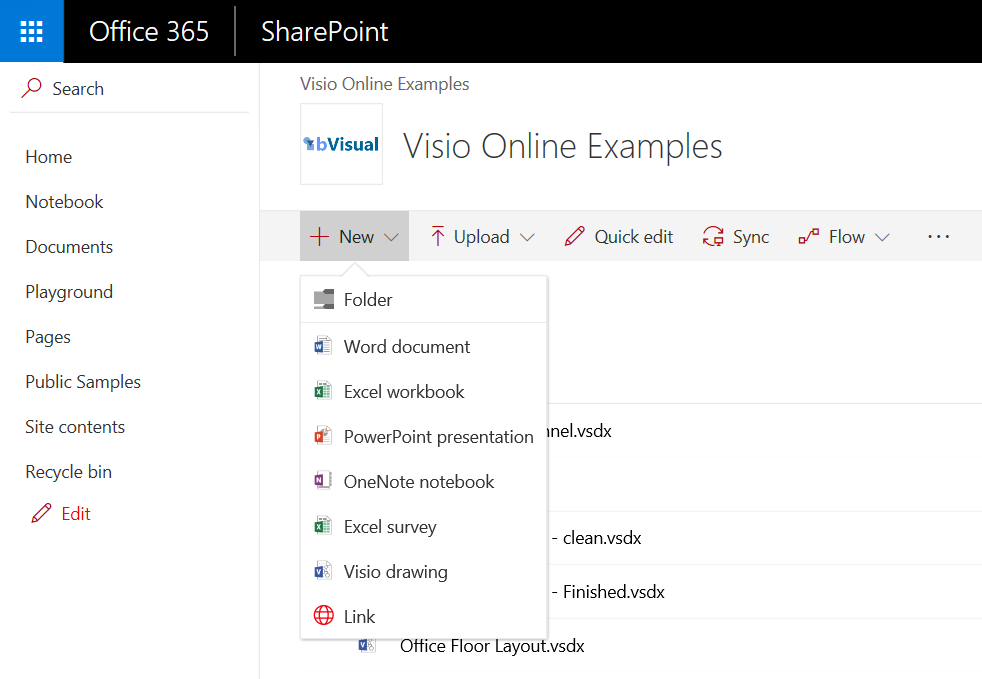
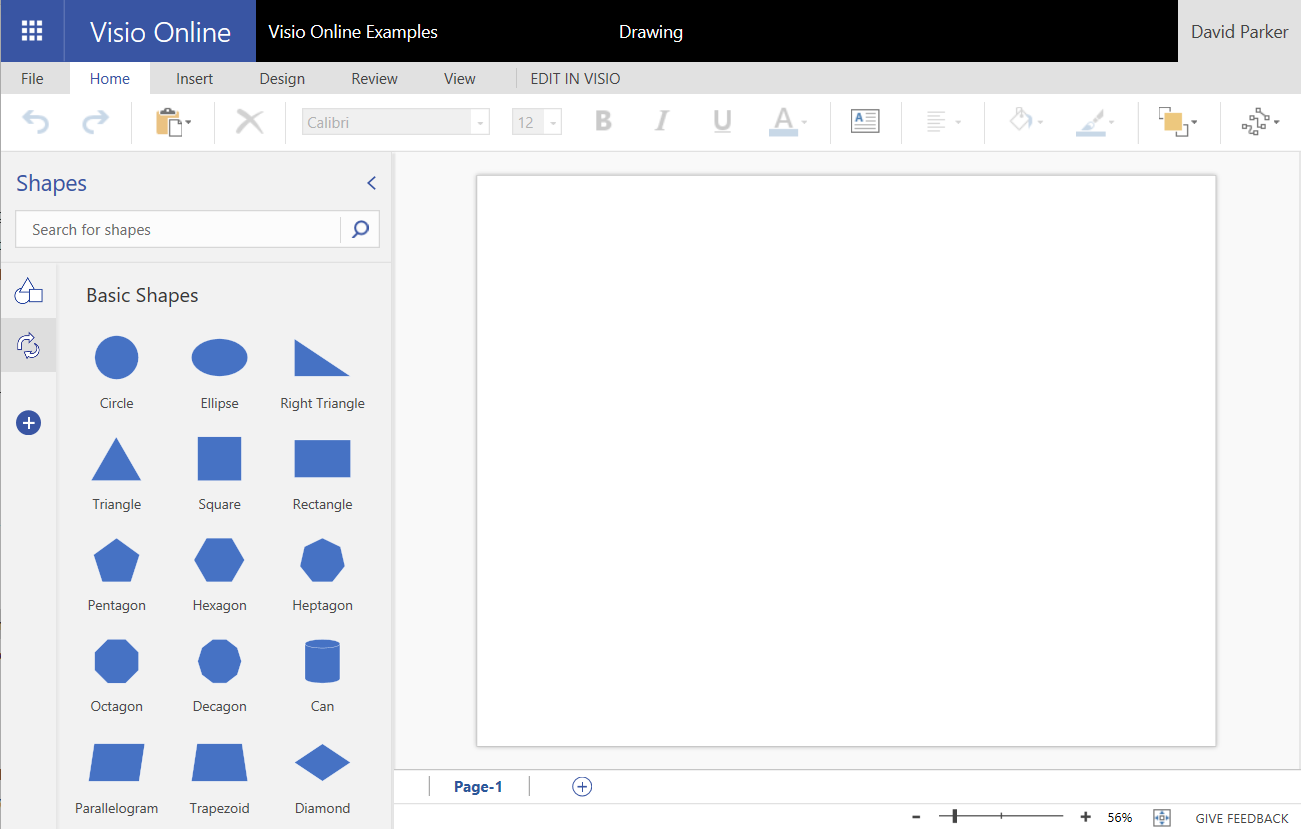
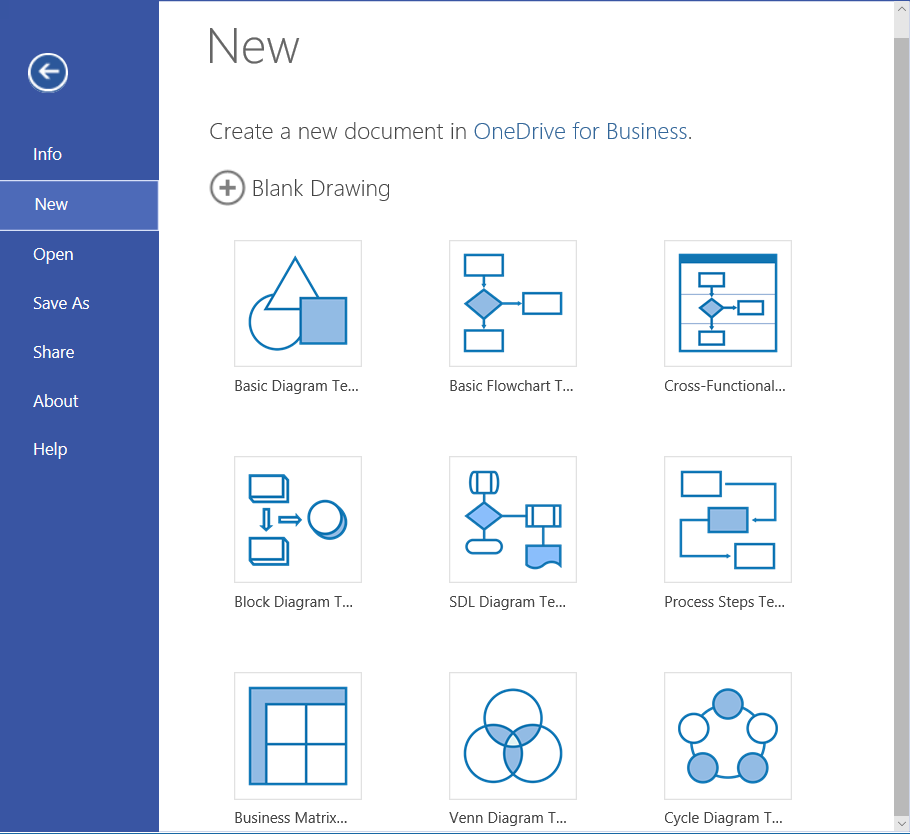
Selecting a New / Visio Drawing in my Office 365 tenant now opens a Basic Diagram in Visio Online. I can then choose to create a diagram from a different template using File / New.
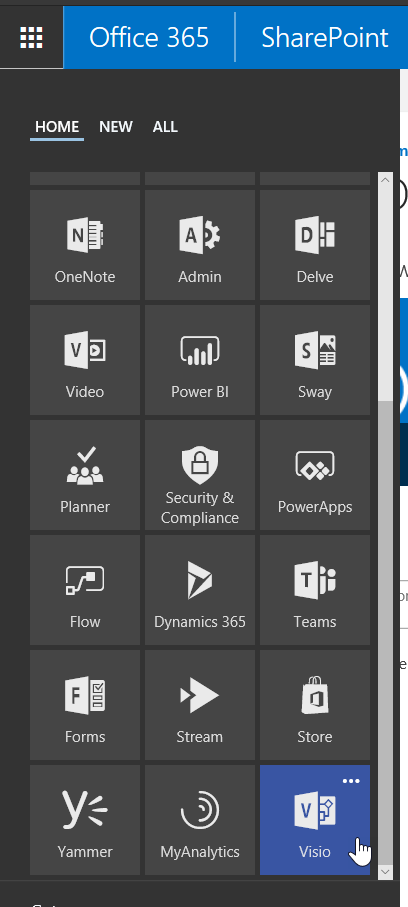
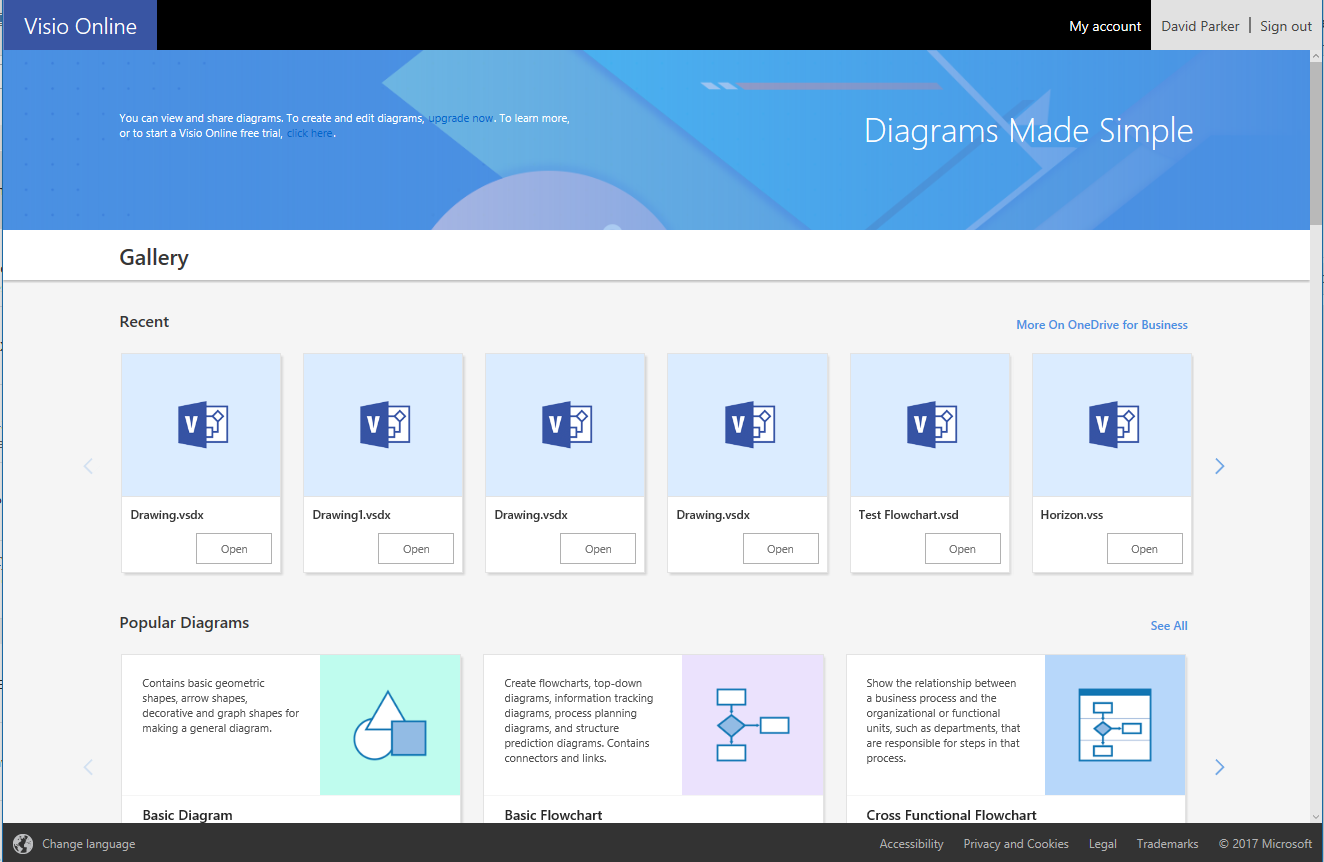
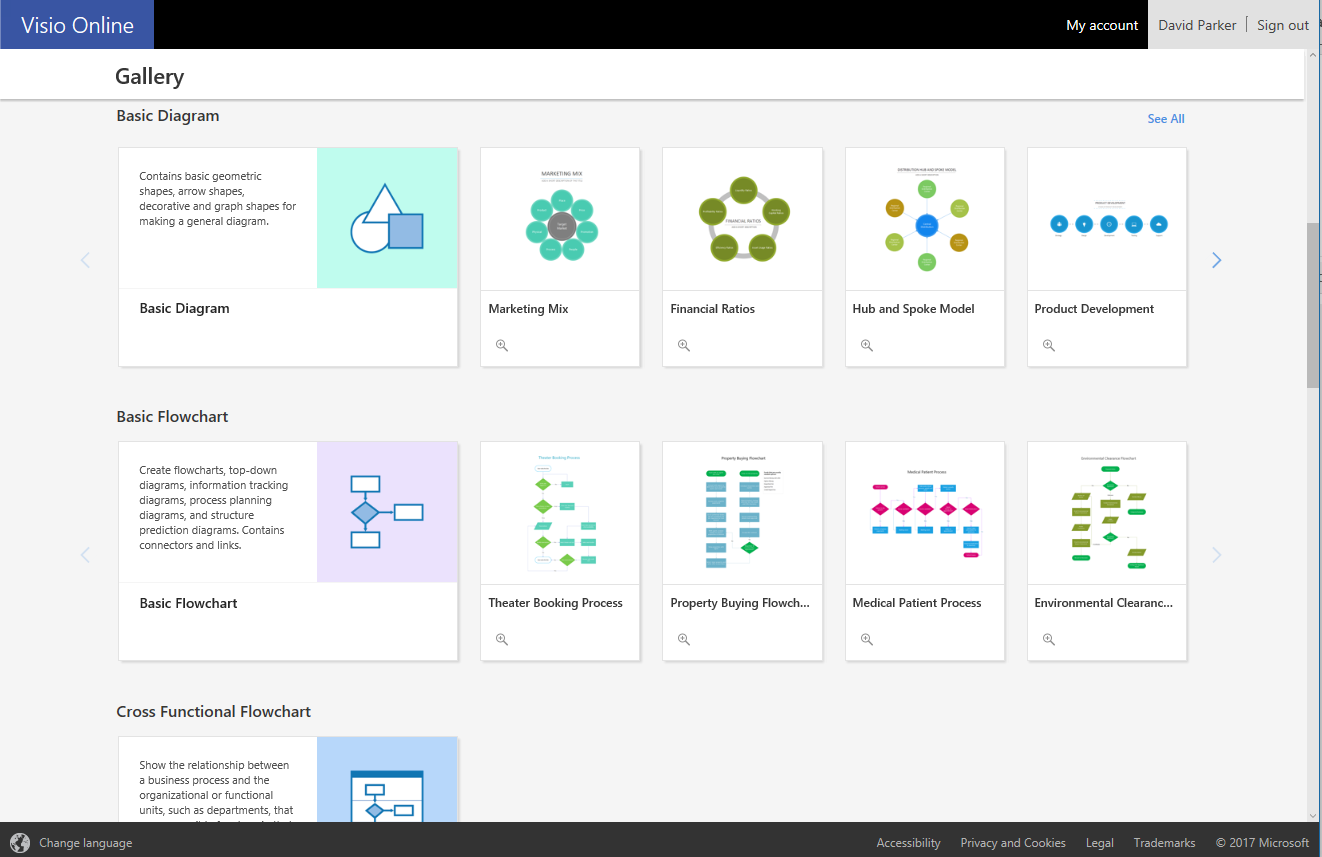
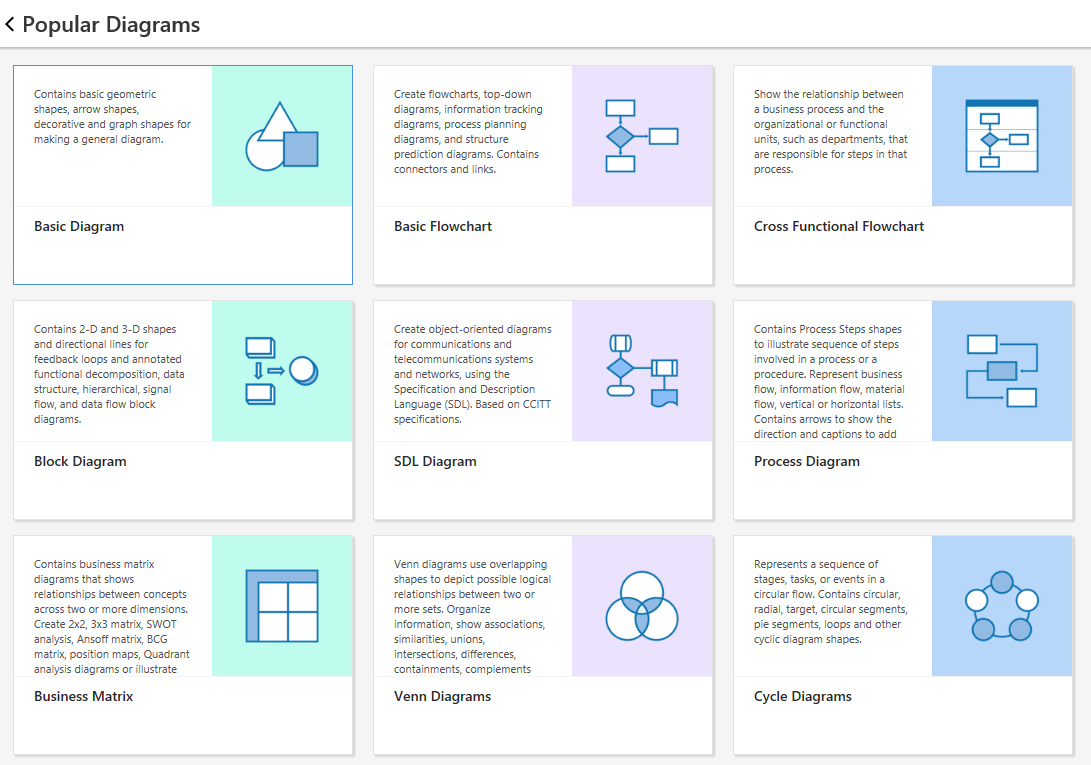
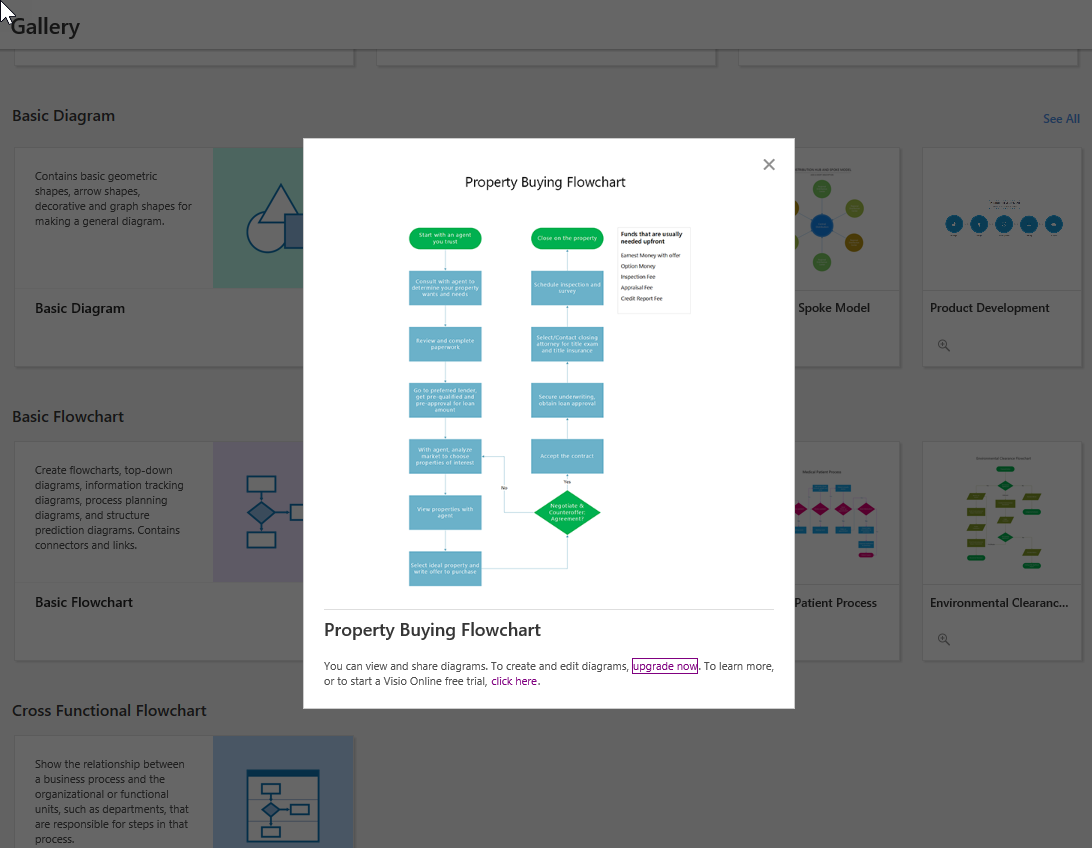
I would also expect to be able to access Visio Online from the waffle menu in the top left of my Office 365 client. This takes me to the Visio Online Gallery, where I can open existing diagrams, or view Popular Diagram templates. At the moment, it only invites me to purchase or upgrade my subscription, but I assume that they will soon be starter diagrams for me to edit
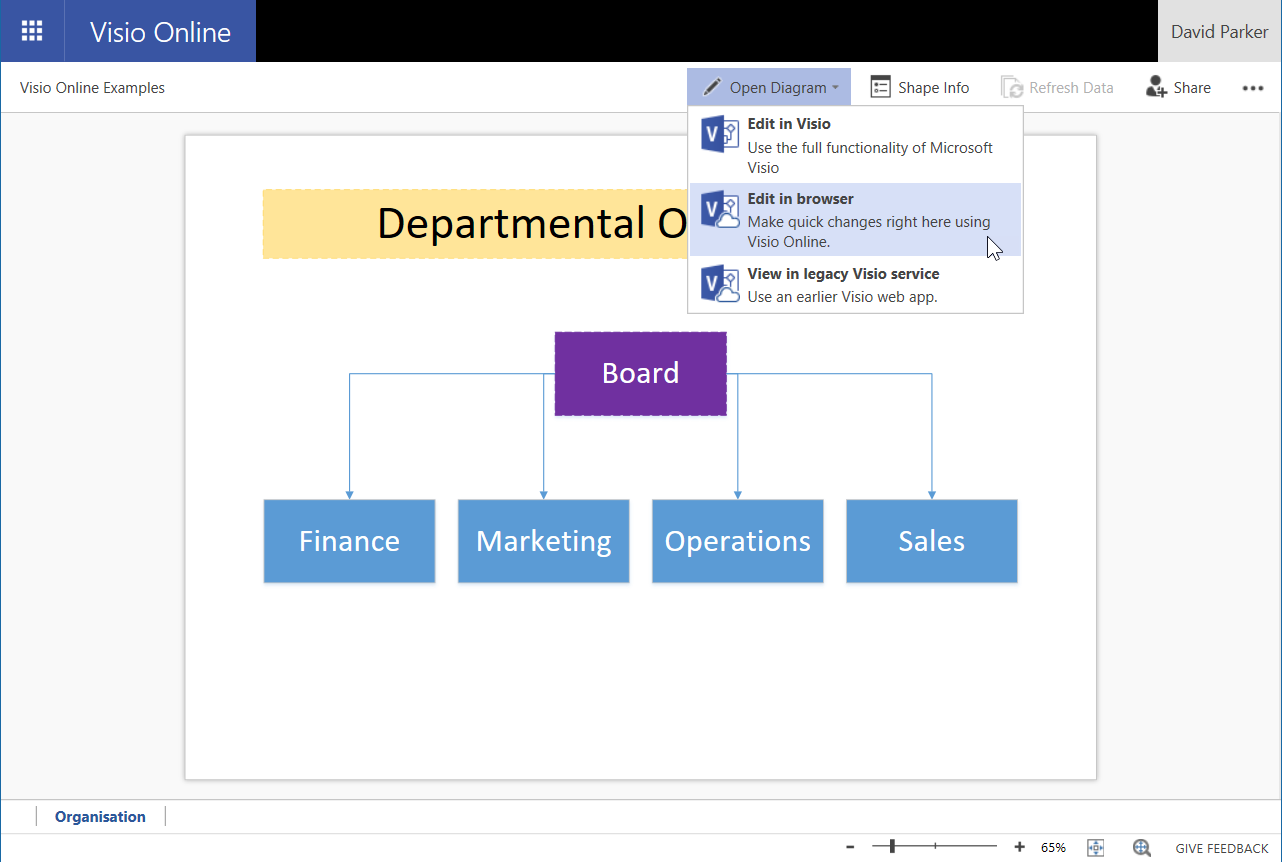
I can also edit some existing simple diagrams that I have selected to view online.
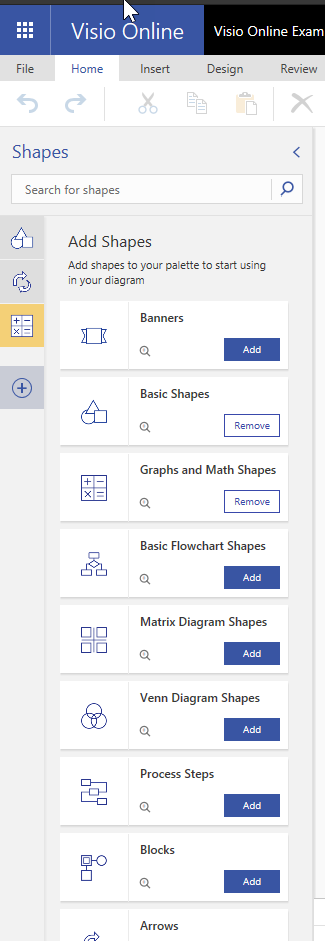
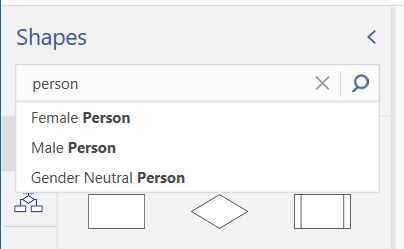
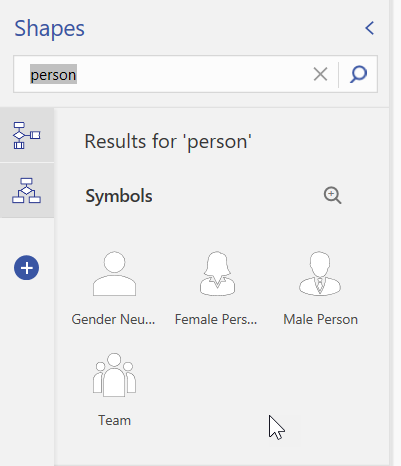
The Shapes search feature looks pretty useful … perhaps it will provide access to third party shapes in the future too!
Visio Online is not as full-featured as Visio desktop editions, but it is really great to see this lightweight editor (at last). It works with the native Visio files, so no need for any conversion, but there are some limitations on file size and features that can be opened by the web version. There are some users who may only need this, but others will still want the desktop, especially Visio Pro for Office 365, because they have more demanding needs, such as Shape Data and links to data sources. It may even be enough for some Mac users out there too, who have long wished to be able to view and edit Visio diagrams without a Visio-clone or converter.
Keep it up Microsoft! Well done.
Countdown to MSIgnite for Visio sessions
Only a couple of days to go before Microsoft Ignite conference starts here in Orlando. Yes, I am here a week early to “acclimatize” 🙂 , but I have not been idle since I will be presenting in three sessions!
[Read more…] about Countdown to MSIgnite for Visio sessionsAdding clicks to infographics with Visio visual for PowerBI
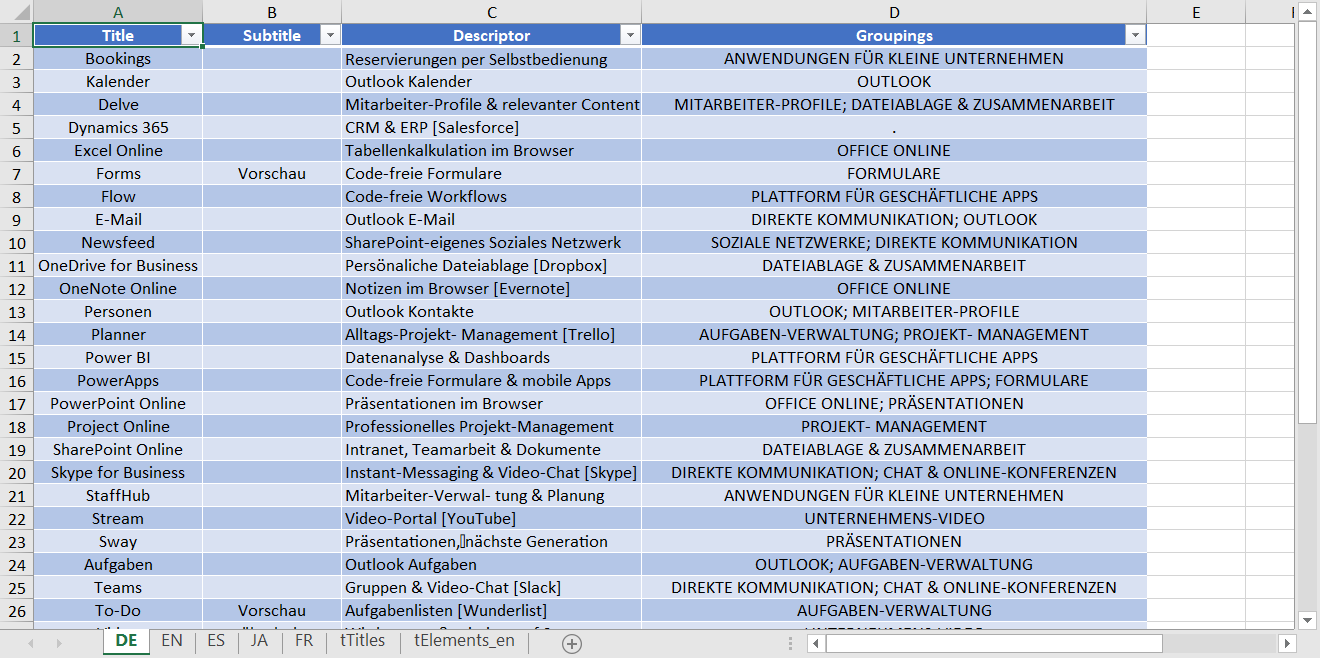
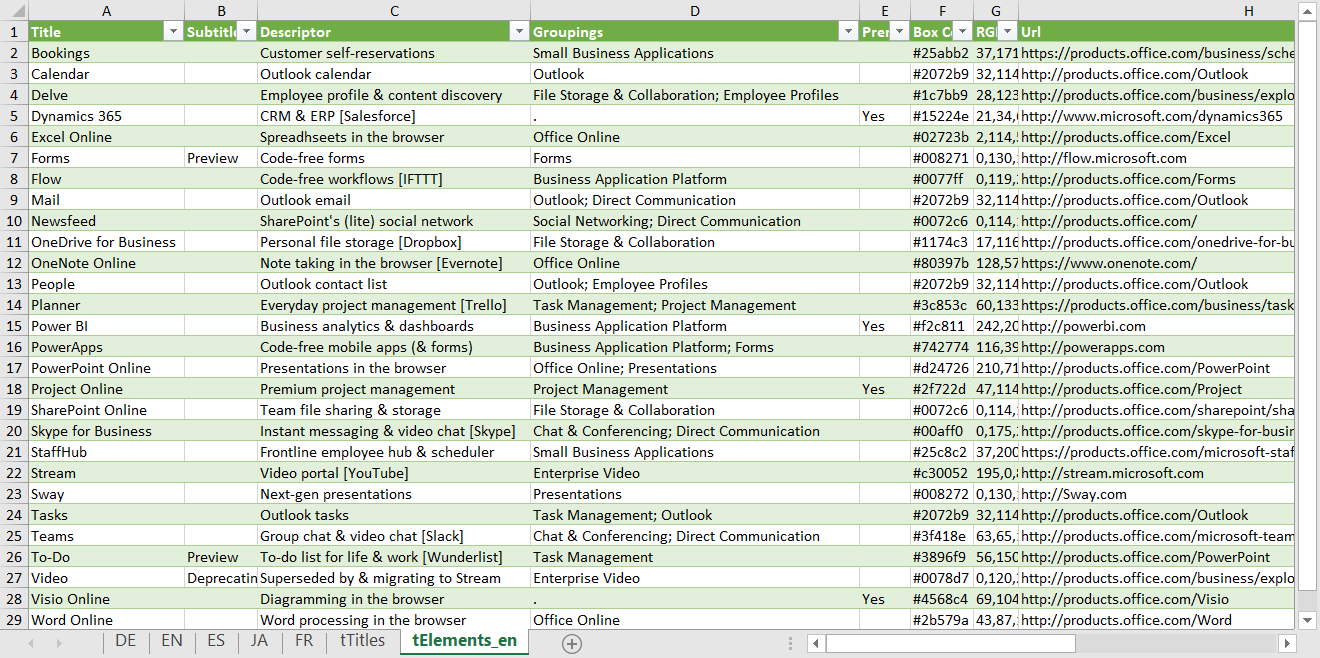
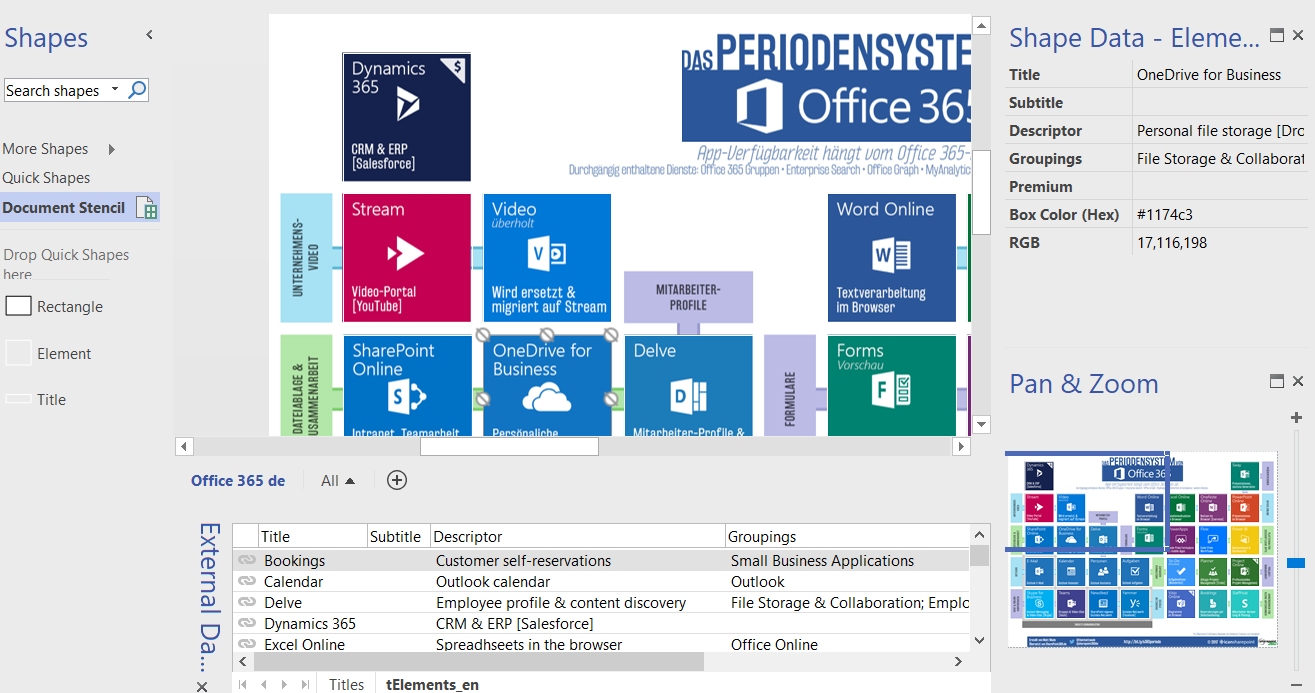
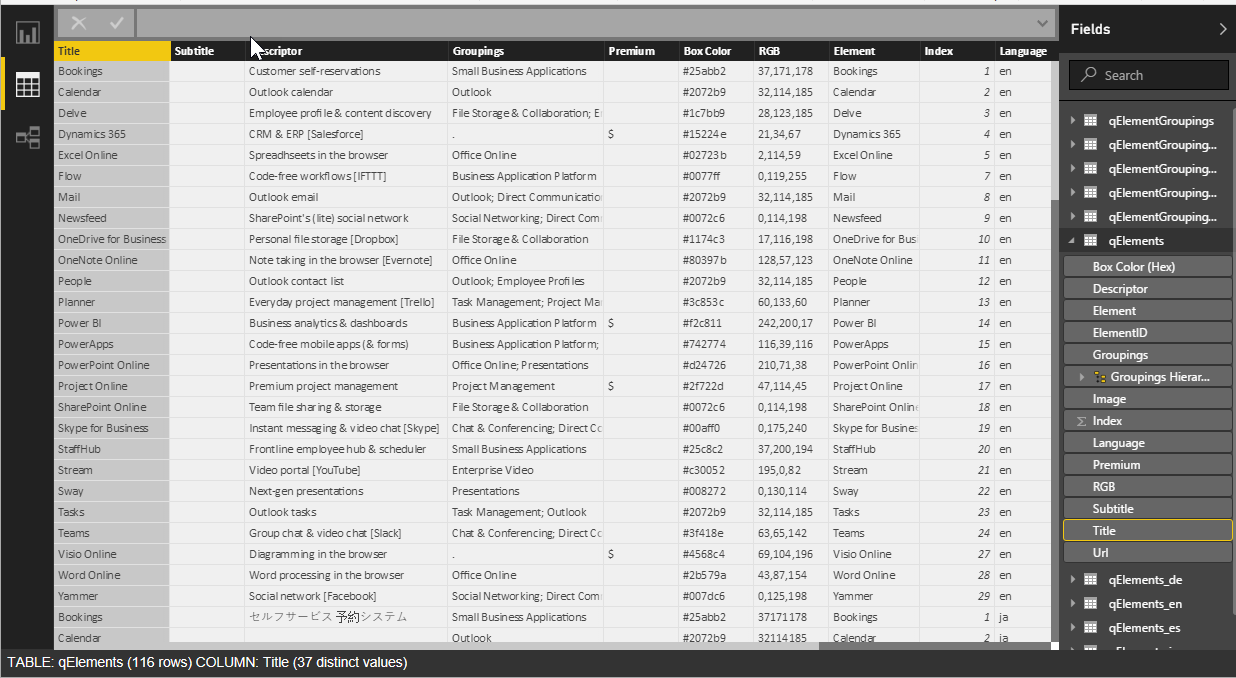
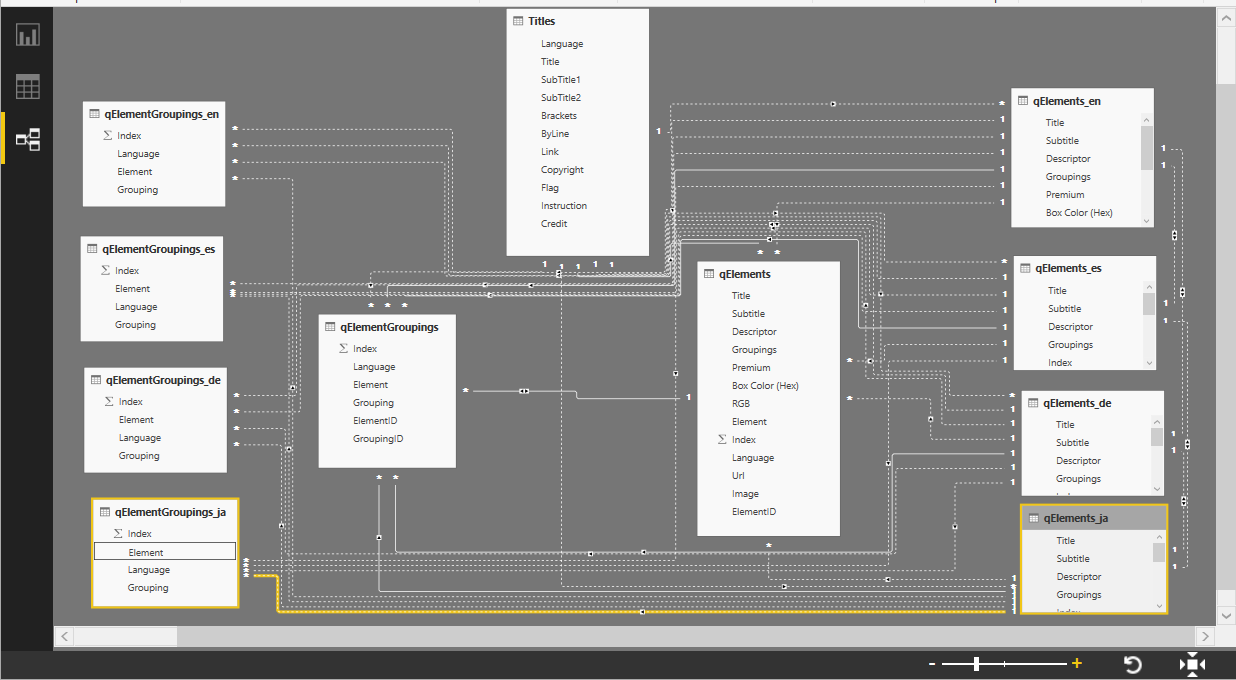
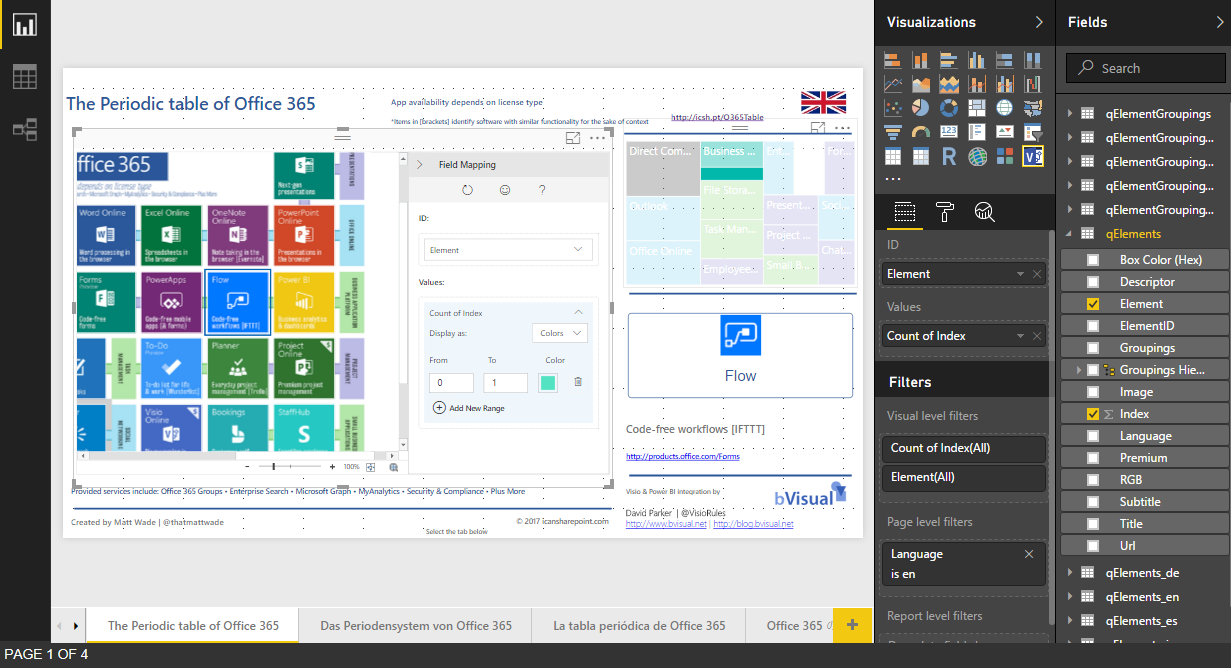
Office 365 is a truly remarkable success story, but it is often difficult to understand what each of the parts actually do, or what it is actually in each edition. Microsoft are always adding applications and services to the various editions, or retiring ones that have been superseded. If I can’t see it, I can’t understand it, so I was very interested to see the Periodic Table of Office 365 infographic created by Matt Wade, a SharePoint guru who keeps an eye on these changes ( see http://icsh.pt/O365Table ). It really helps in comprehending the current Office 365 applications and their purpose. Indeed, I have seen his graphic go through many iterations over the last few months, and it will continue to change. However, it was not clickable, and I am a visual data guy, so I contacted him, and offered to integrate his infographic into a Power BI now that the Visio custom visual is available. I then found out that there are several different language versions of his infographic out there on the web, translated by other SharePoint professionals in his network.
[Read more…] about Adding clicks to infographics with Visio visual for PowerBIPreviewing the Visio Custom Visual in PowerBI
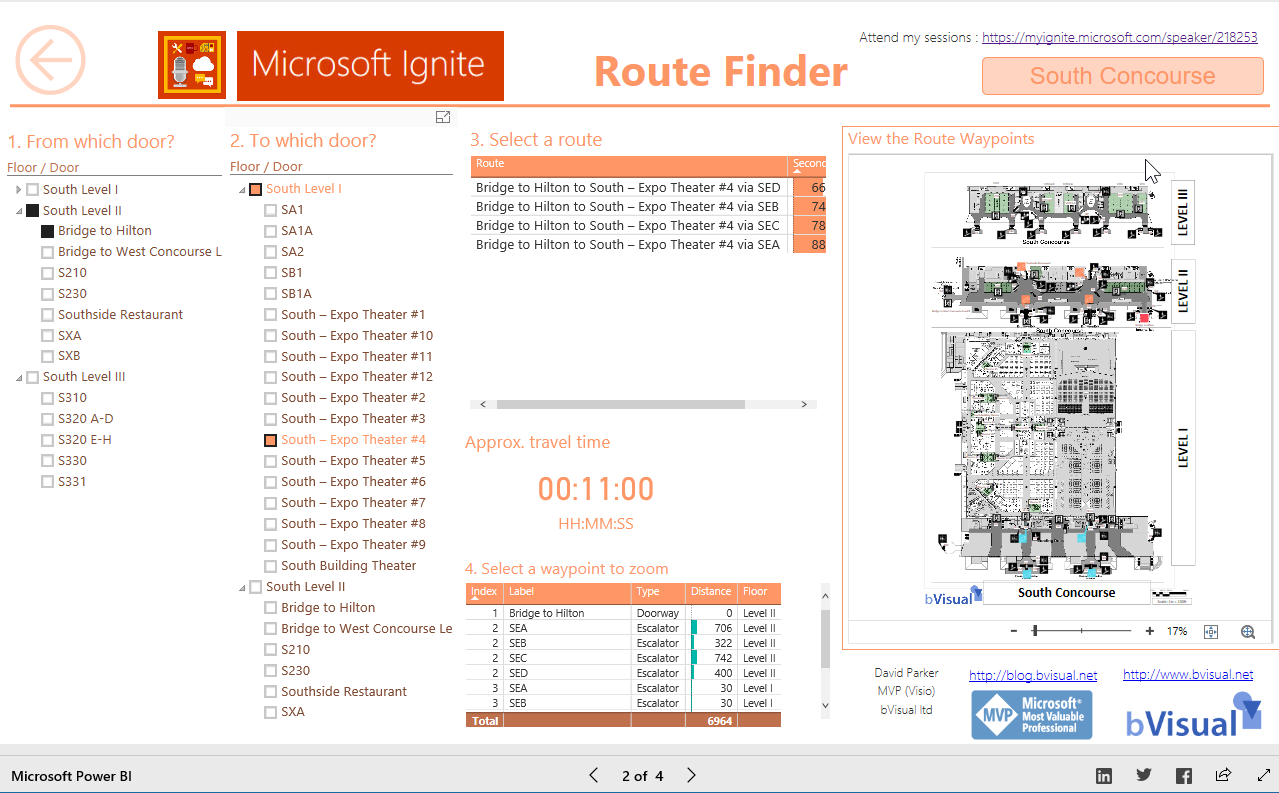
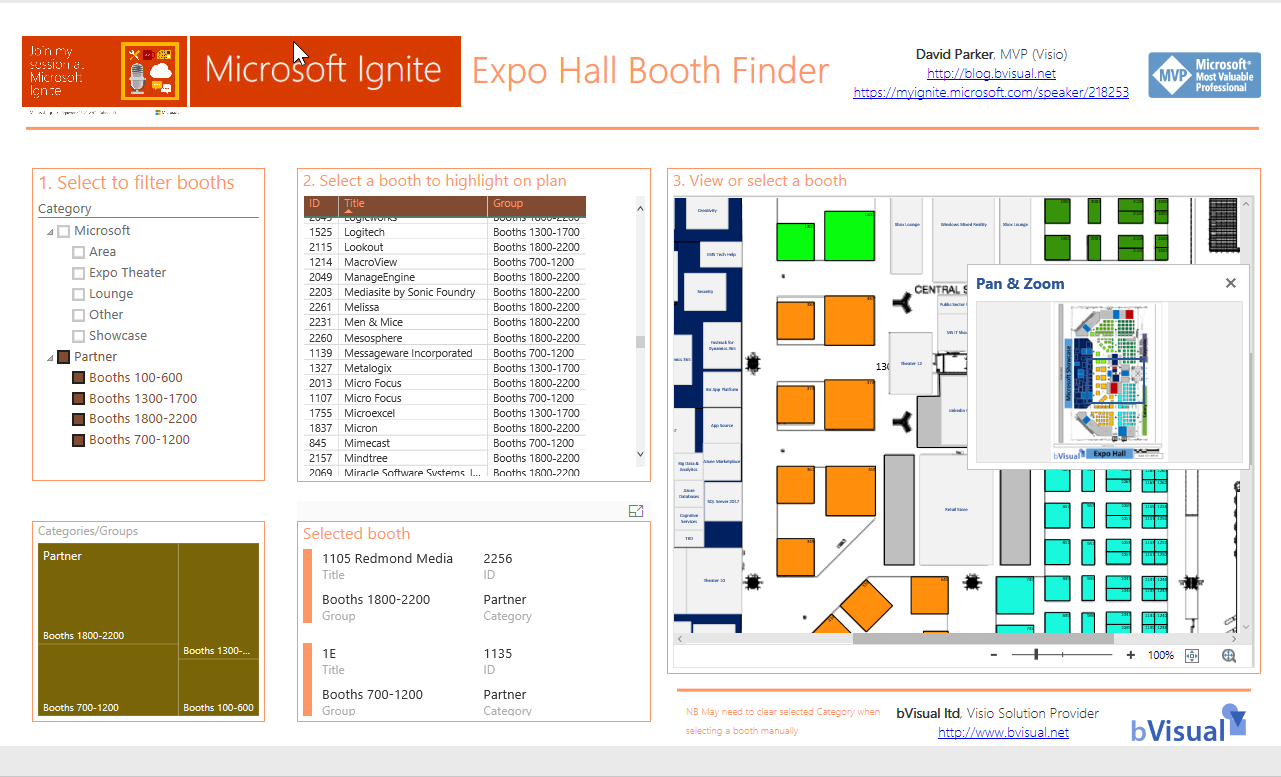
It is time to talk about the new Visio custom visual for PowerBI. You may have read about it at Visio Power BI example and Add Visio visualizations to Power BI reports, but I wanted to add my findings. First, it is great to see this feature, but it is not yet the finished article. However, I hope I can show that it can be an extremely useful addition to the business intelligence toolset from Microsoft. I think that the existing Link Data to Shapes and Data Graphics features in Visio desktop are considered to be Operational Intelligence capabilities, whereas this new custom visual for PowerBI is definitely Business Intelligence. This is a different discipline, and I have been developing some guidelines for good practice when using Visio with PowerBI. In this article, I will demonstrate how I created a PowerBI dashboard using graphics and data from last years Microsoft Ignite conference.
Let me set the expectations because I am working with a preview of the Visio custom visual.
[Read more…] about Previewing the Visio Custom Visual in PowerBIProblems viewing and printing embedded Dwg files in Visio
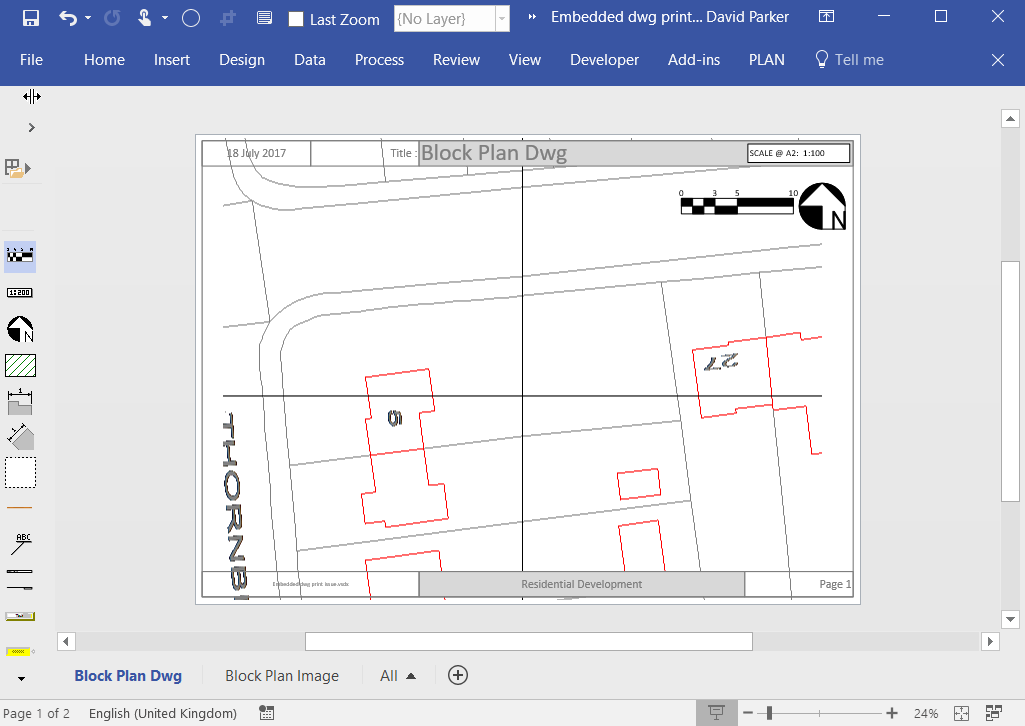
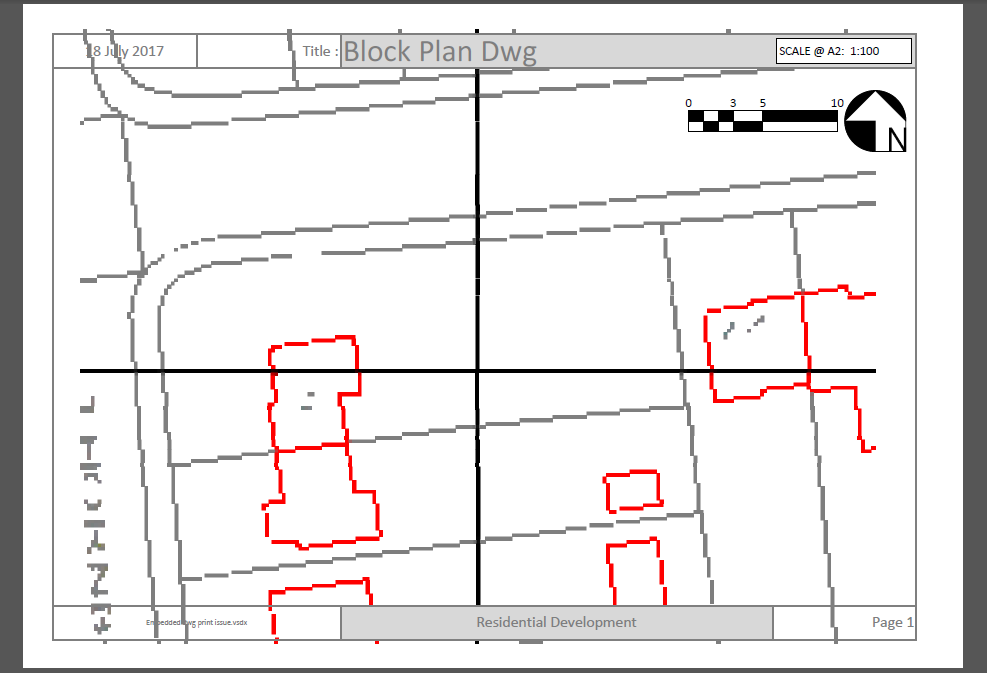
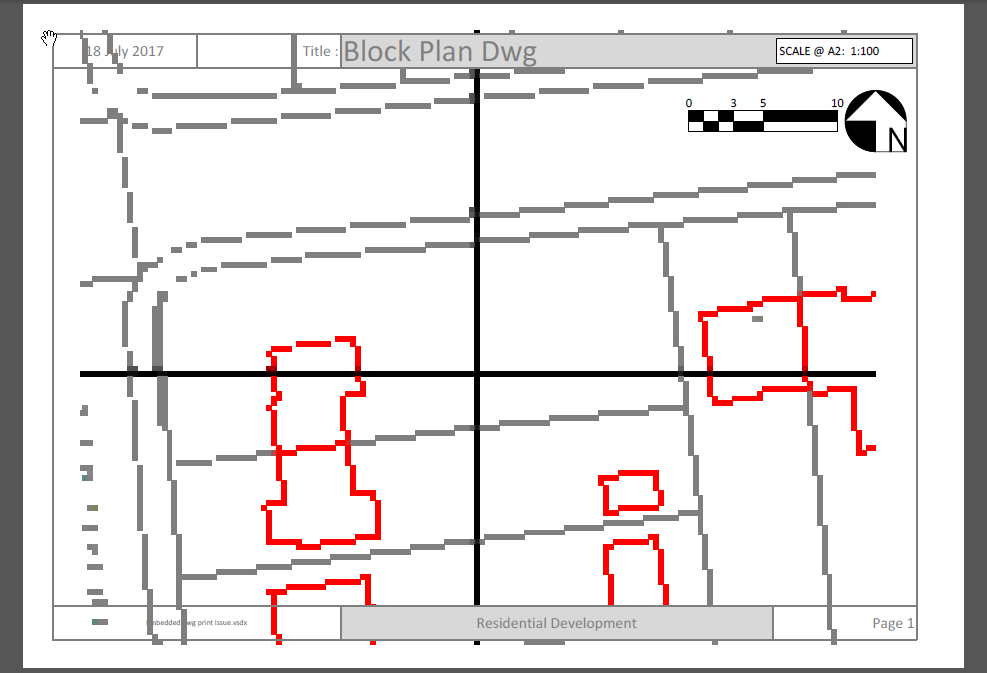
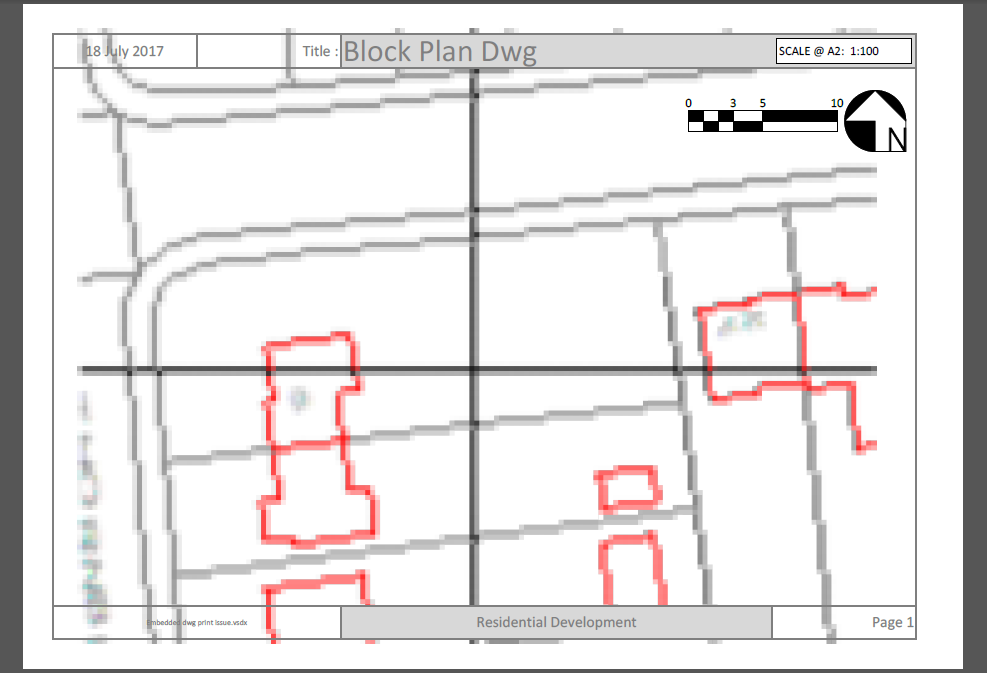
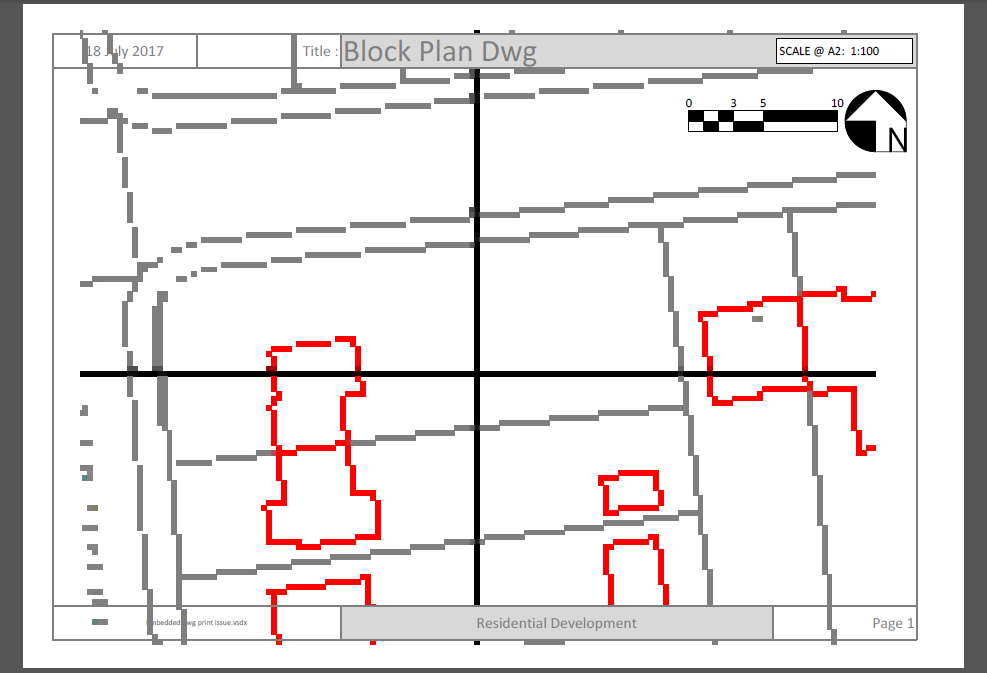
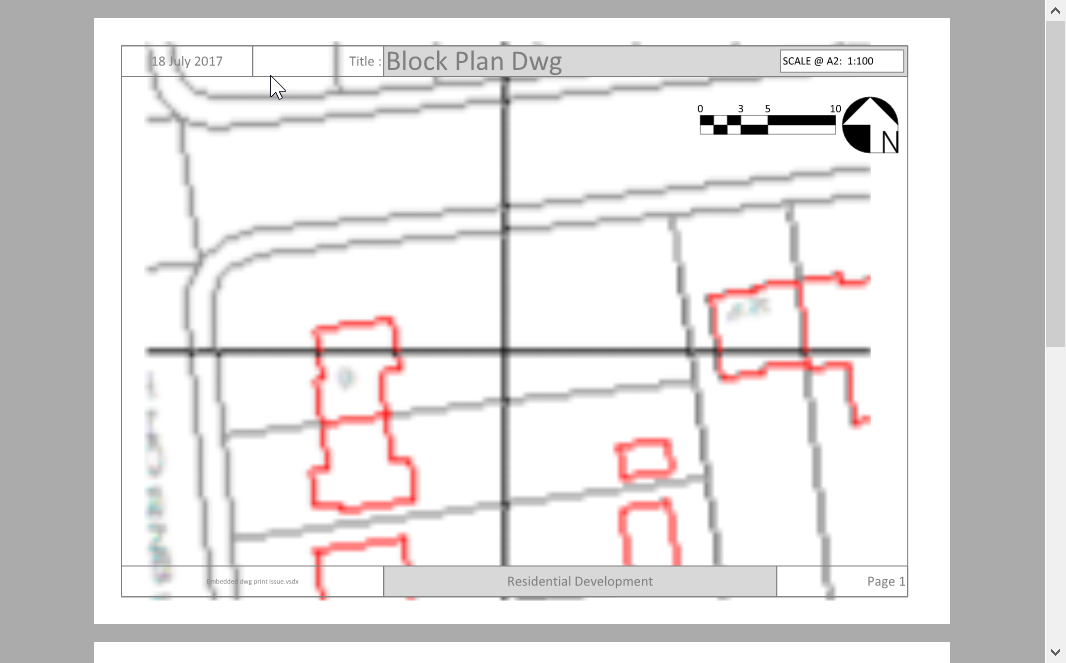
I recently had to buy a Dwg file of a residential area for a planning application. I naturally wanted to use this Dwg file to scale in Visio, and everything looked great. The property lines were slightly jagged because of the scaling, but were quite acceptable. However, when it came to printing or saving as Pdf, I discovered a big problem … the Dwg image was either completely absent or extremely jagged!
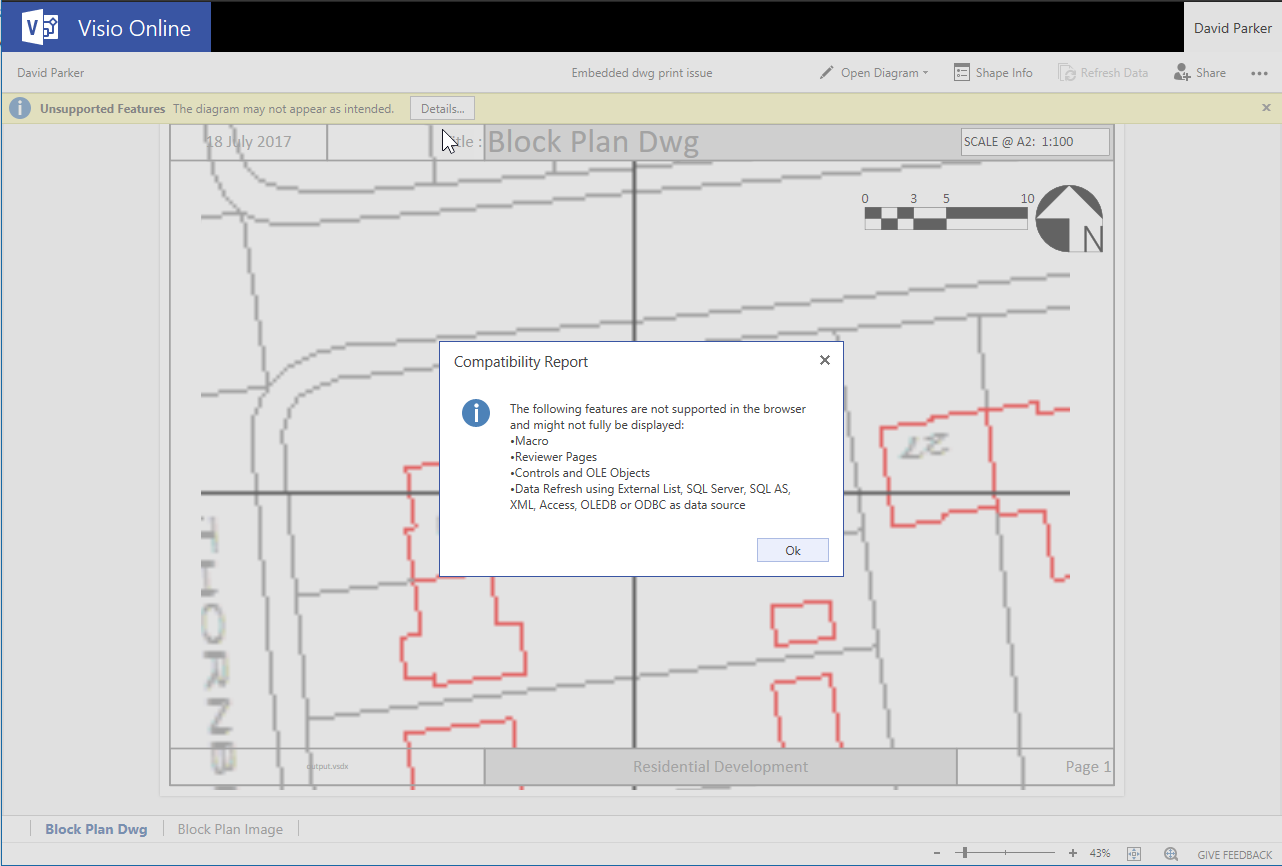
I tested 5 different products for creating pdfs from Visio, and none of them were usable. I tried saving as Oxps, and using Visio Online, or just printing … not good either. Only Visio itself and Visio Viewer rendered satisfactorily!
This is the file used in the test : https://1drv.ms/u/s!AqkzN8kb1lAzpNJ6DhX1ETd_9SkcIw
The products tested were:
