Visio 2013 has (at last) brought us the Metro file format, otherwise known as Open Packaging Conventions (OPC) standard (ISO 29500, Part 2)! You can read about Open Packaging Conventions Fundamentals at http://msdn.microsoft.com/en-us/library/windows/desktop/dd742818(v=vs.85).aspx.
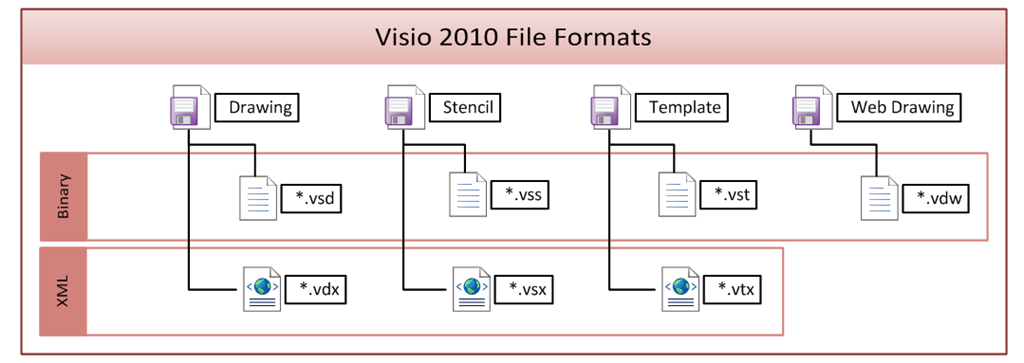
Visio file formats were unchanged for versions 2003, 2007 and 2010, except that Visio 2010 saw the addition of the *.vdw format, which is basically the *.vsd with a XAML overlay added. There were two choices of file formats – the Visio binary format or the verbose DataDiagramML Xml format.