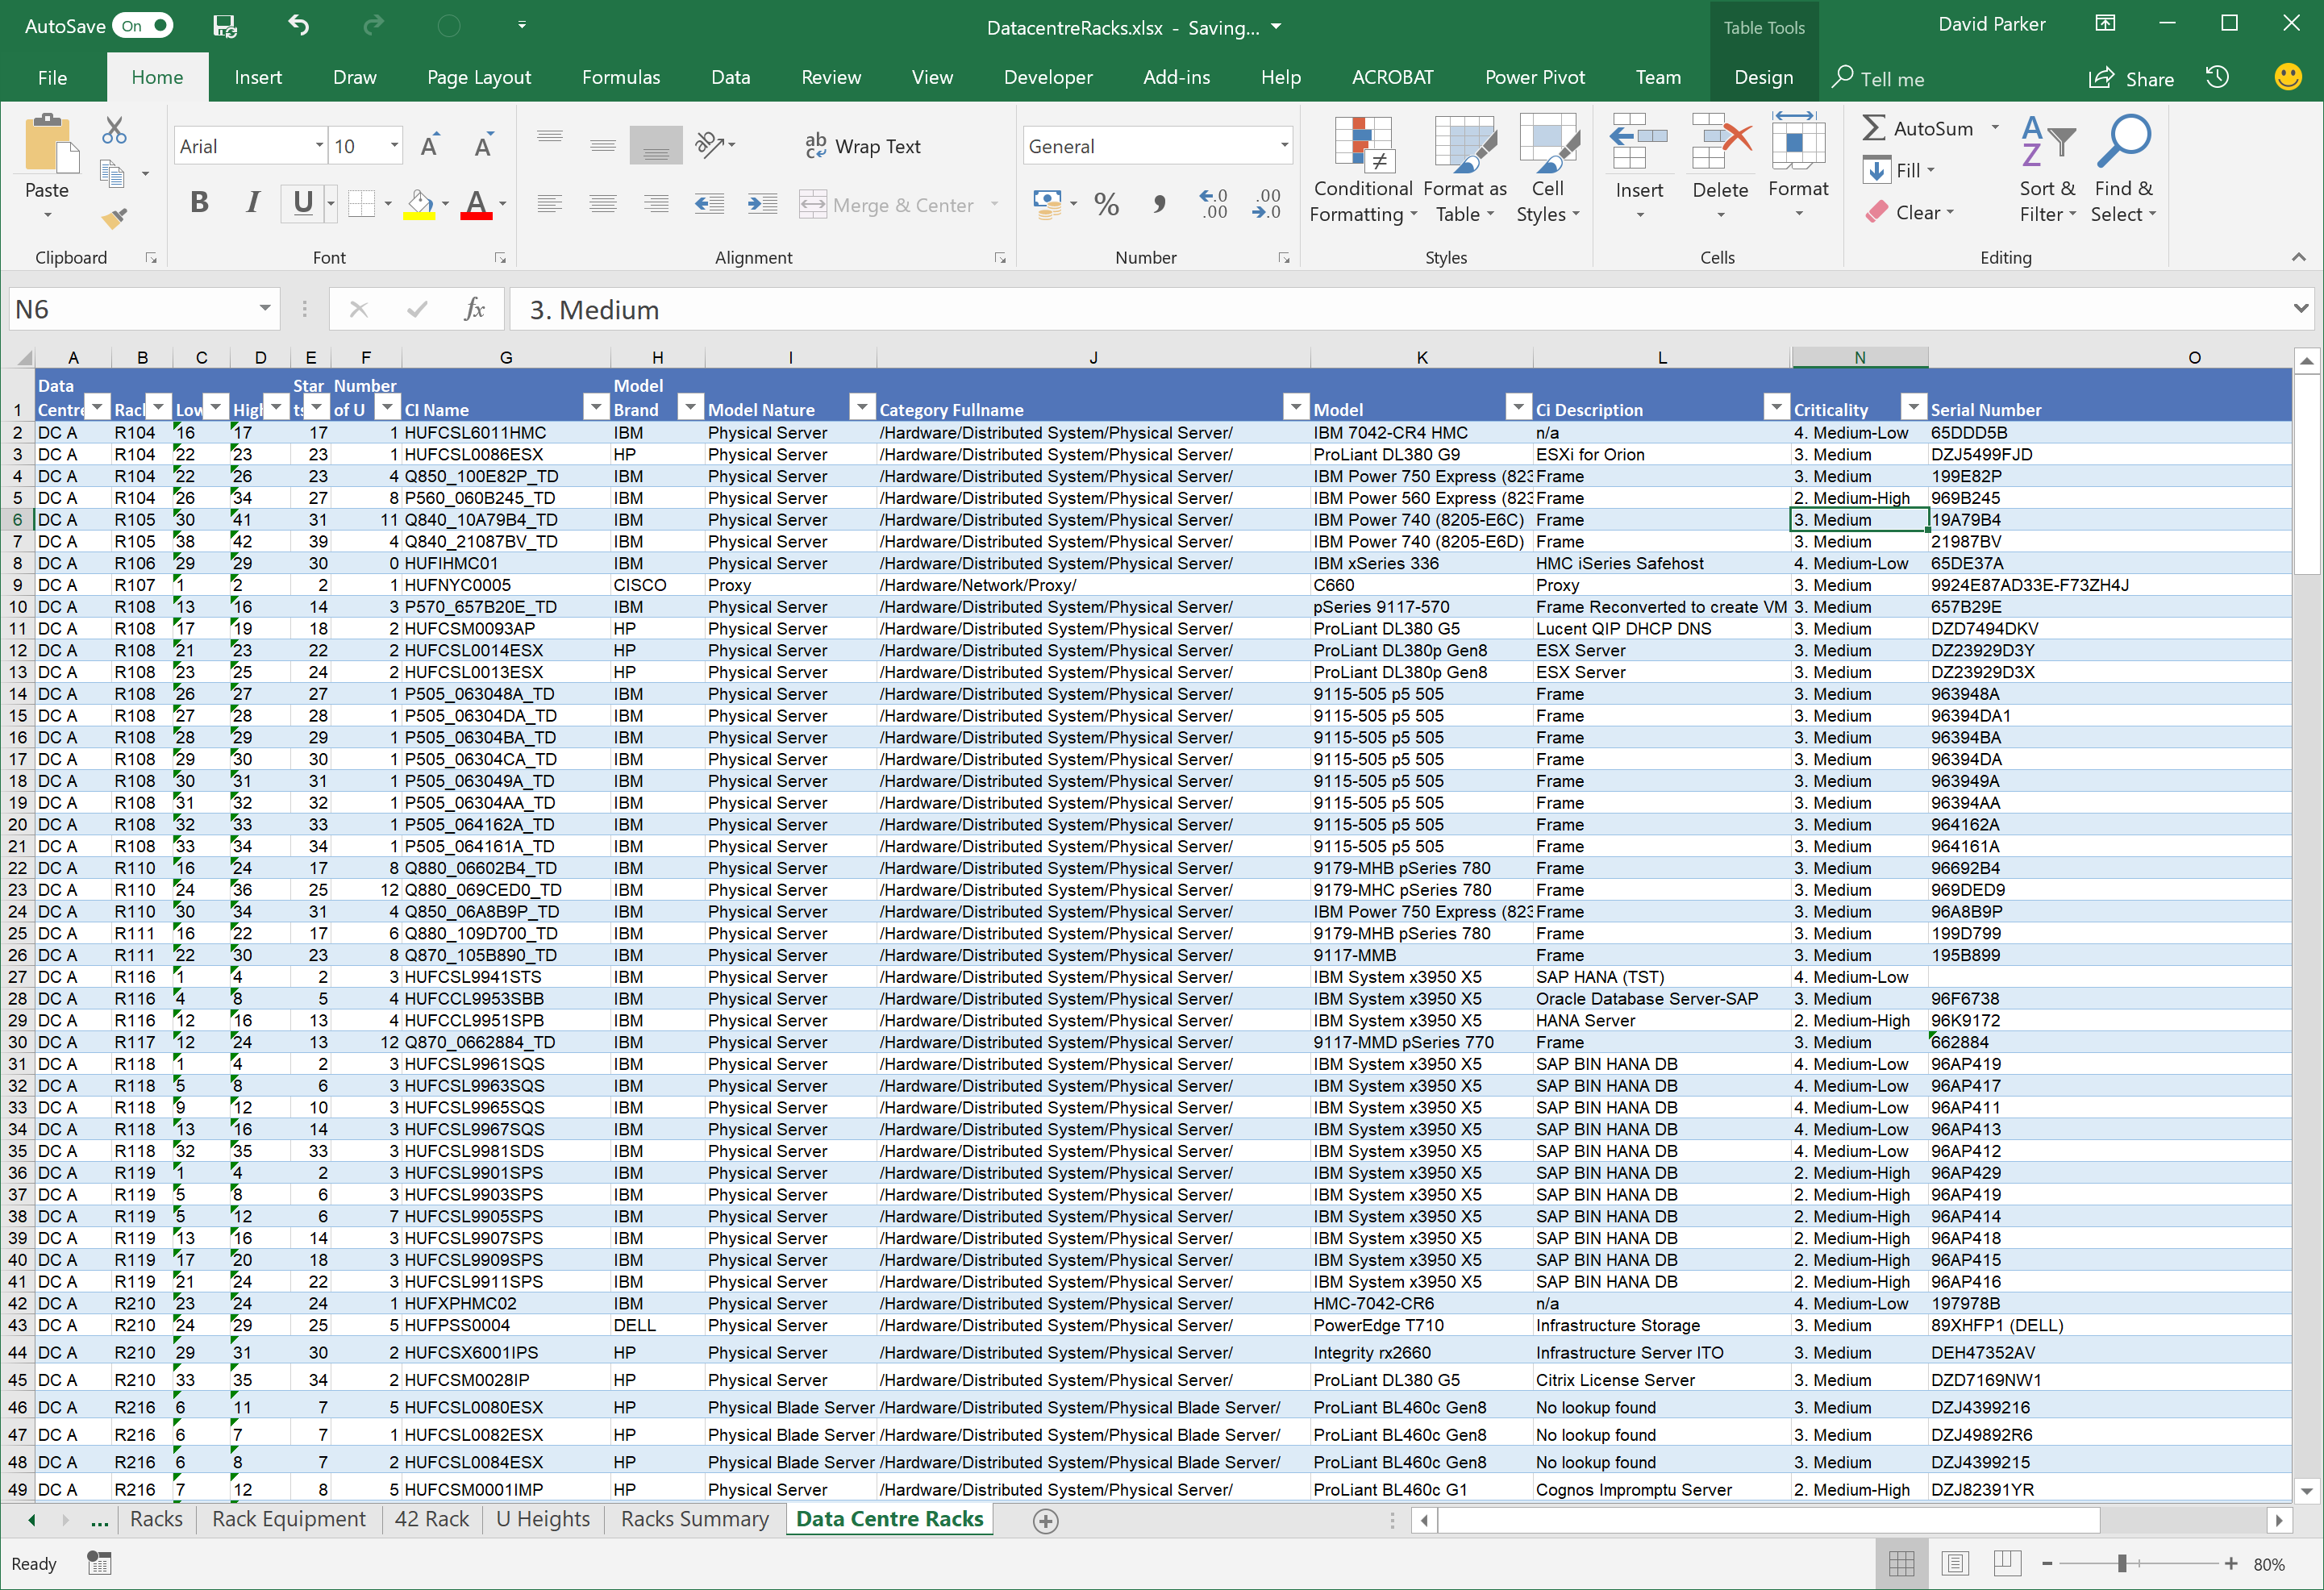
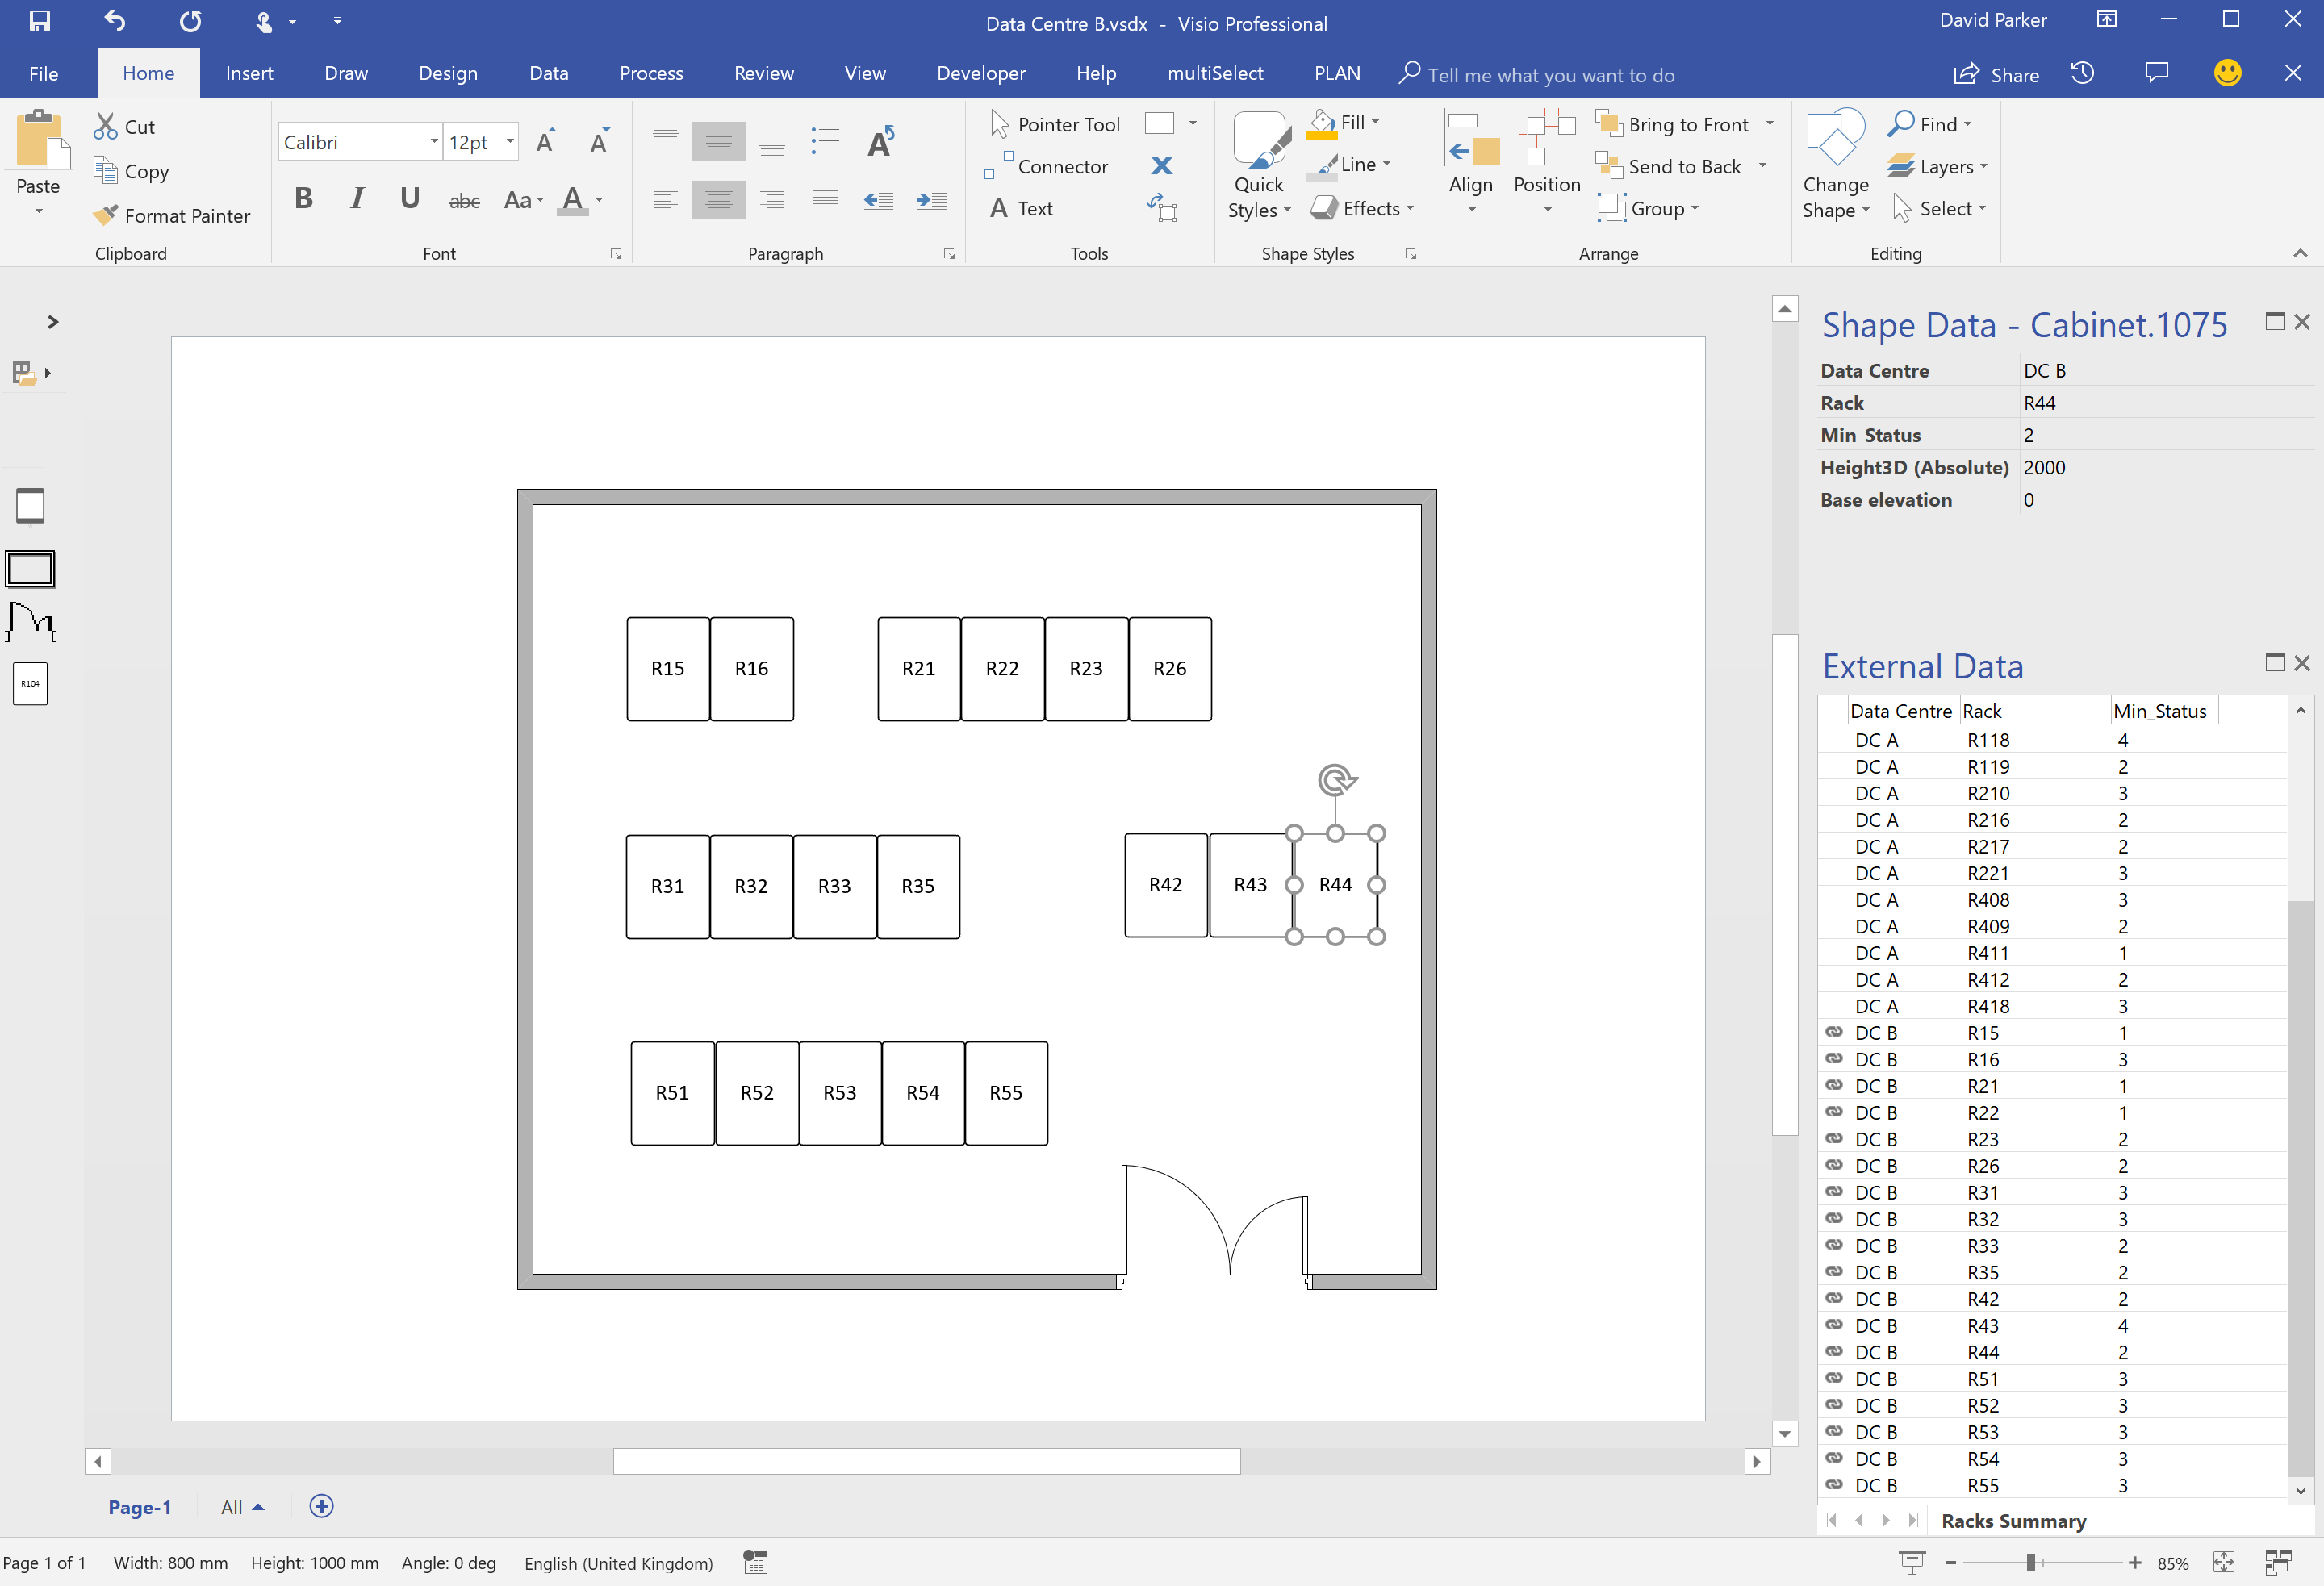
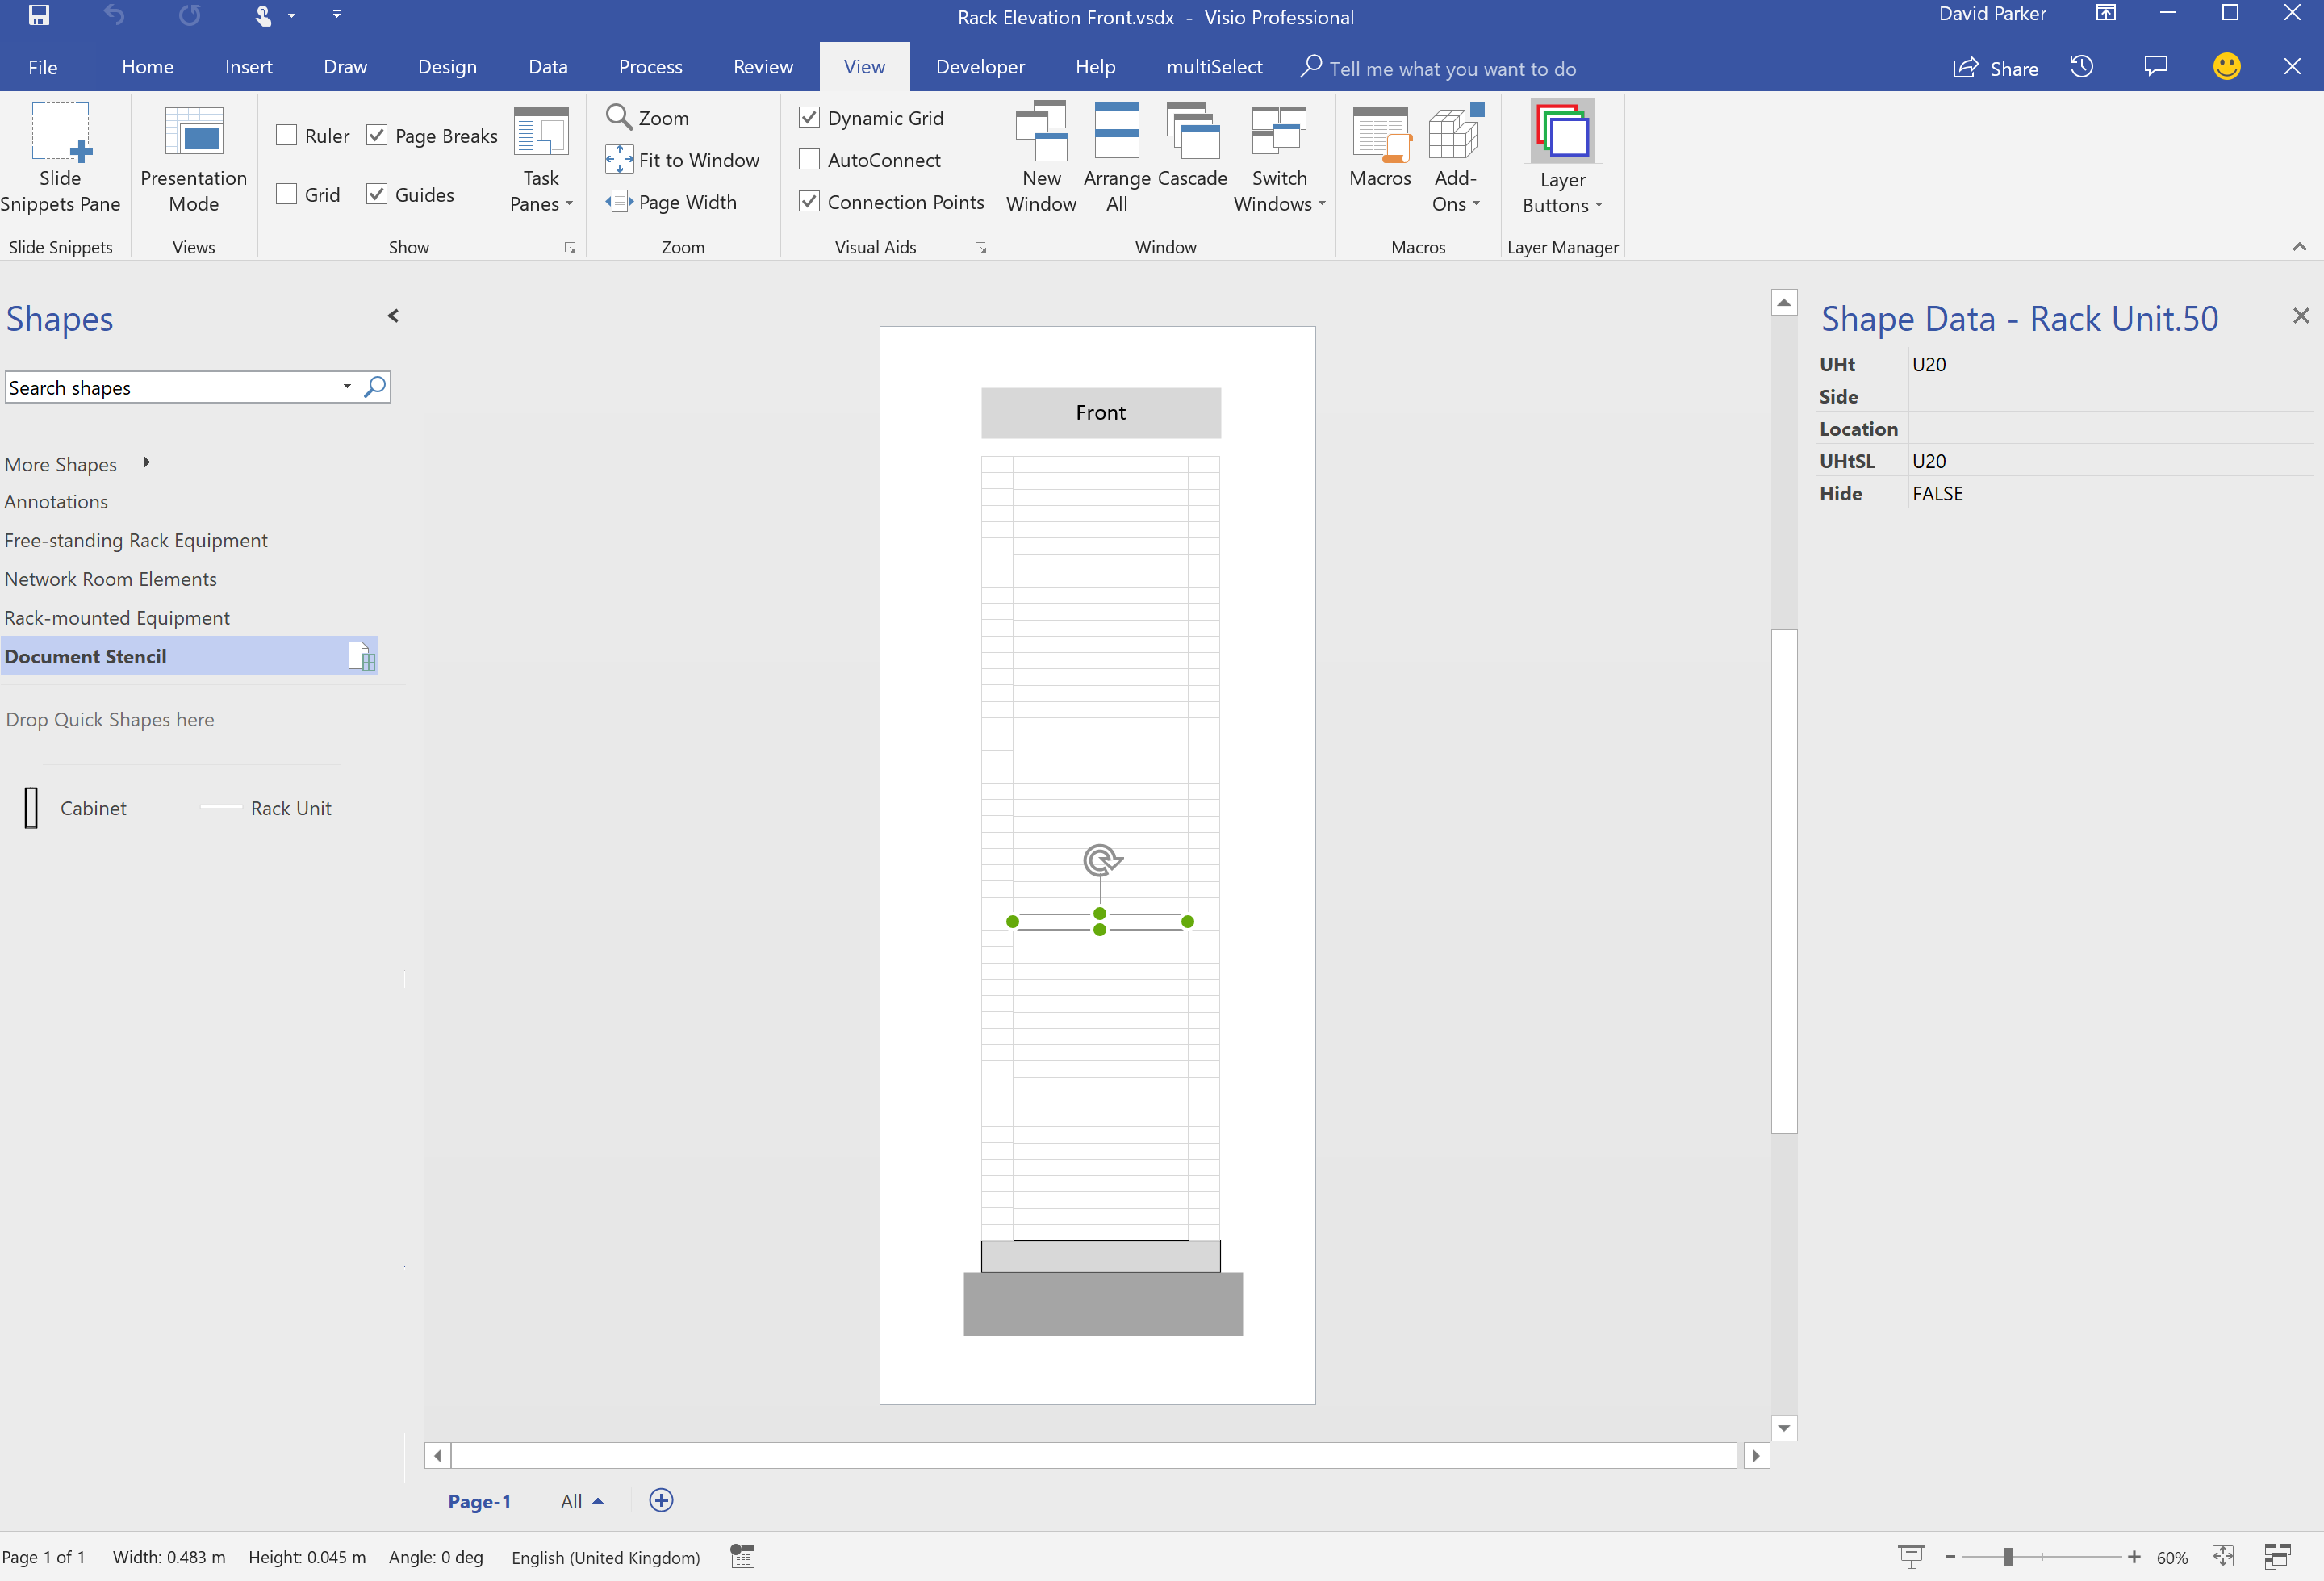
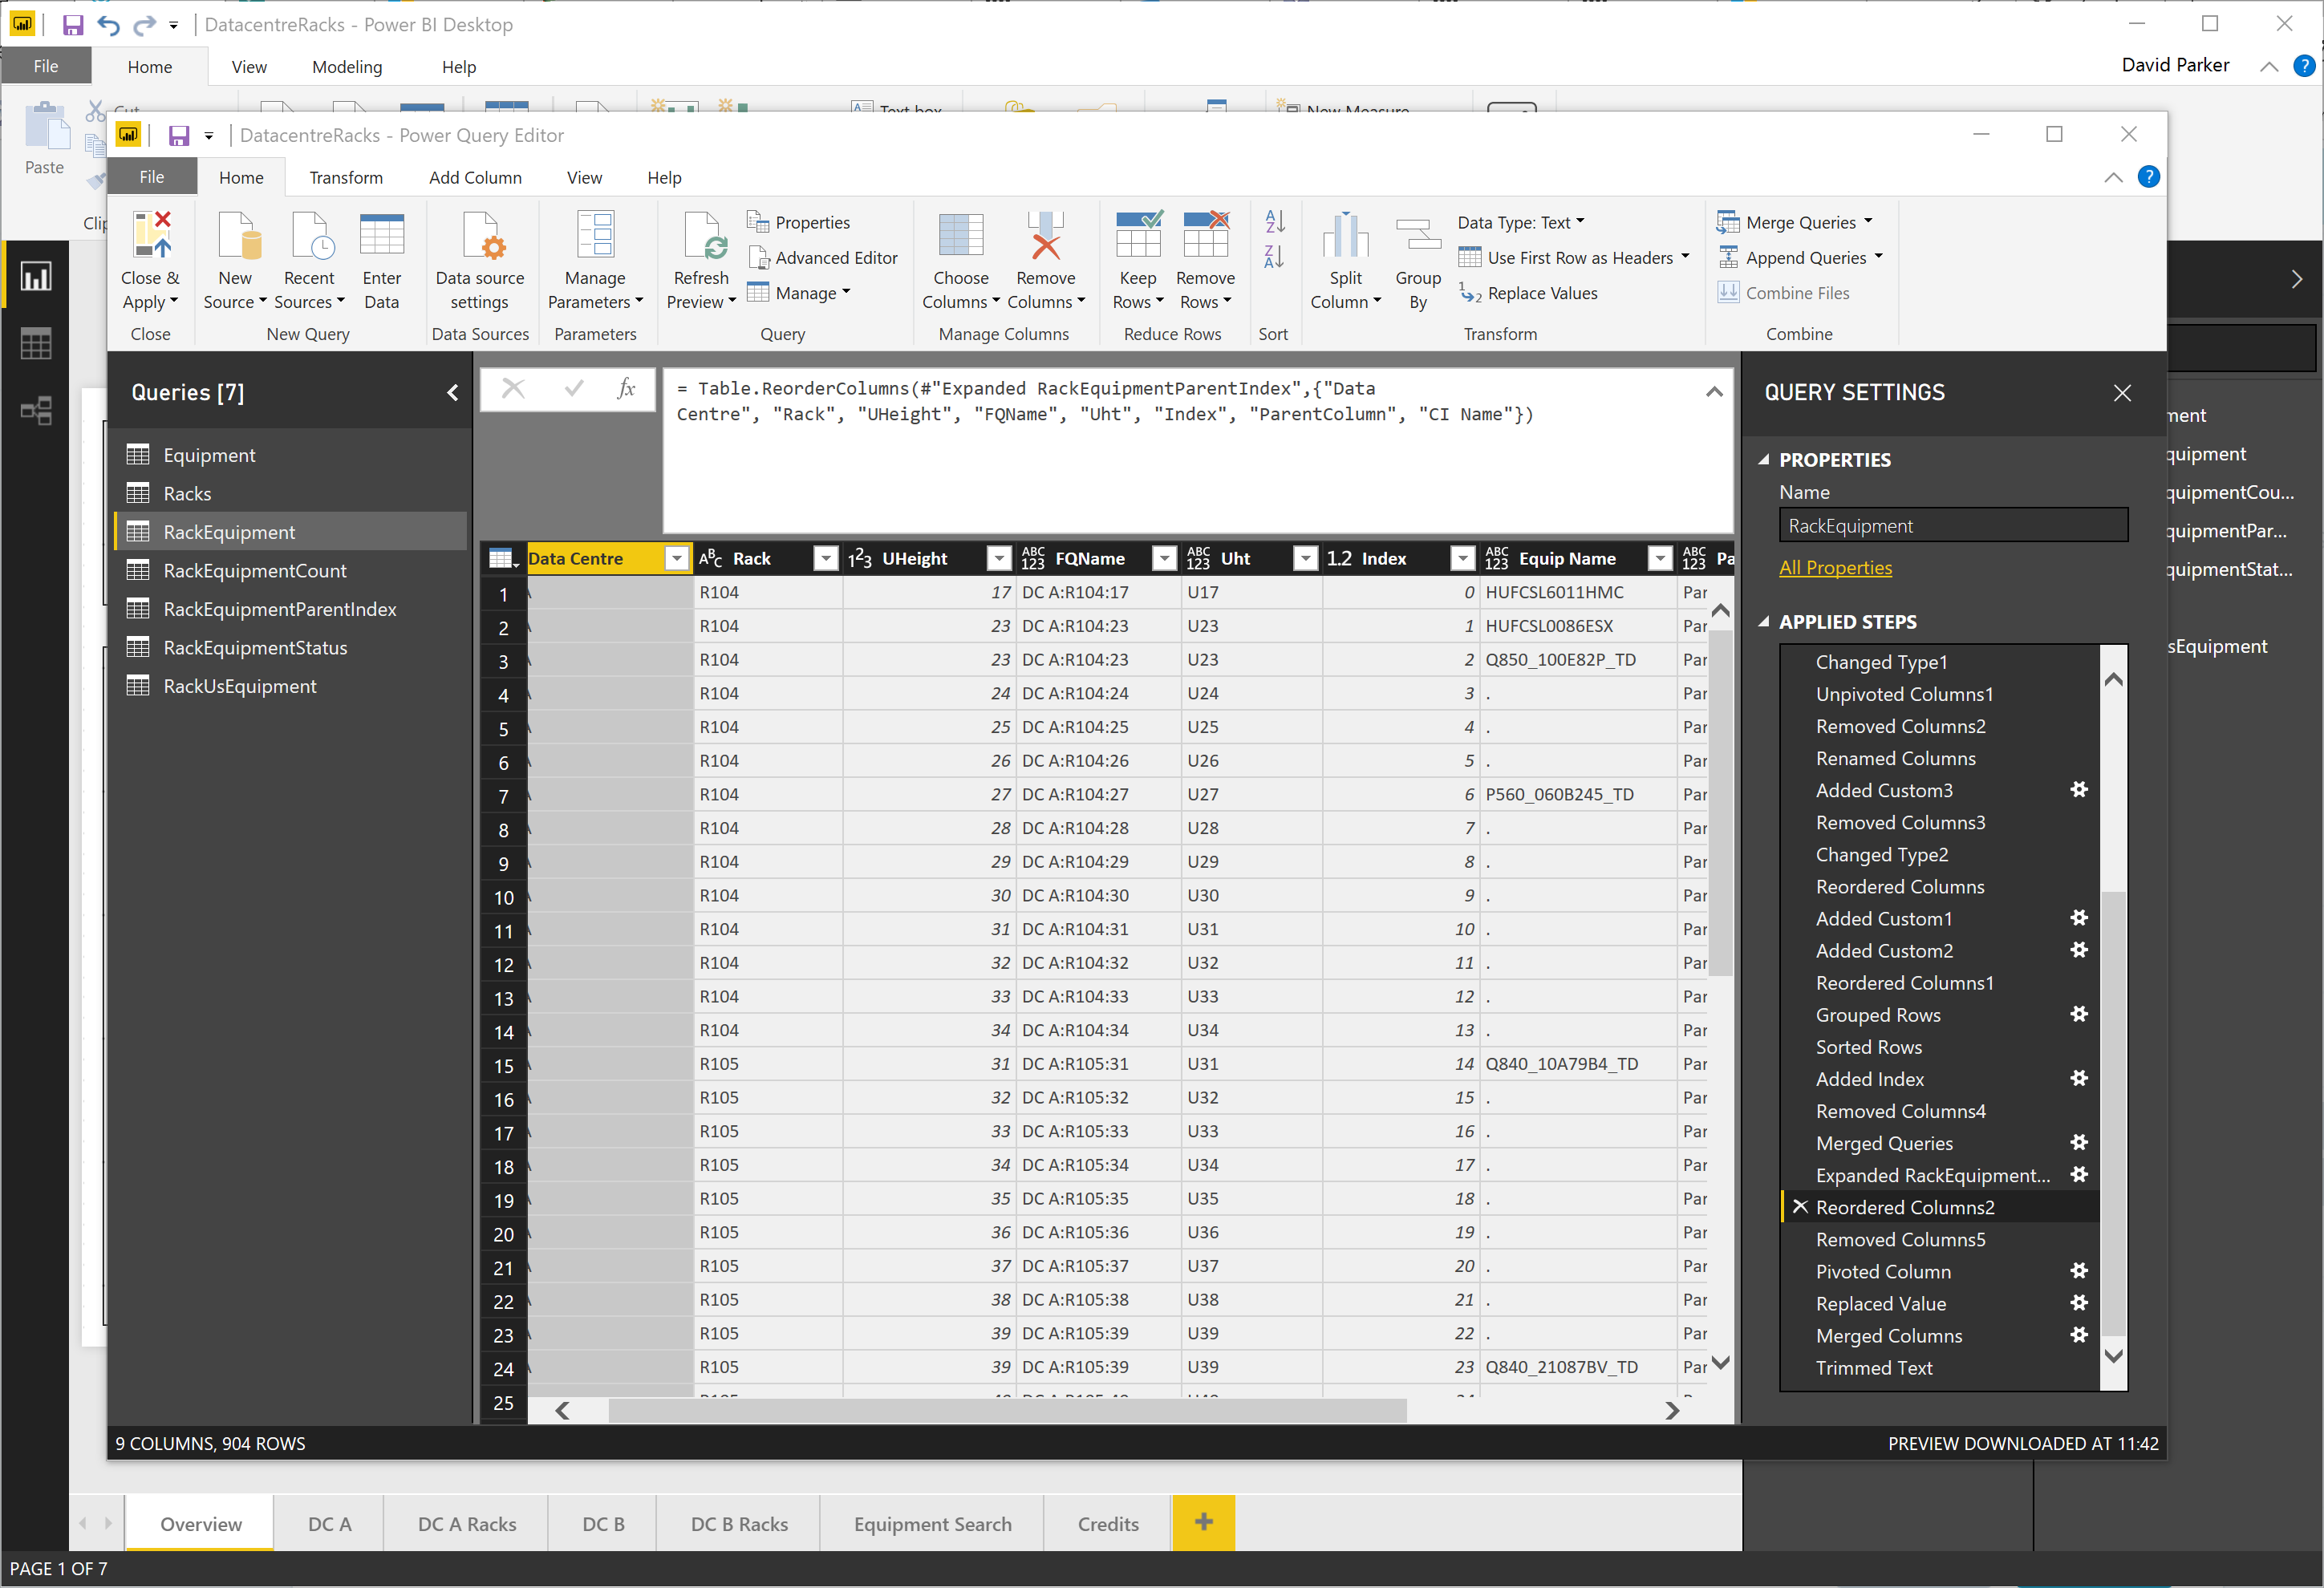
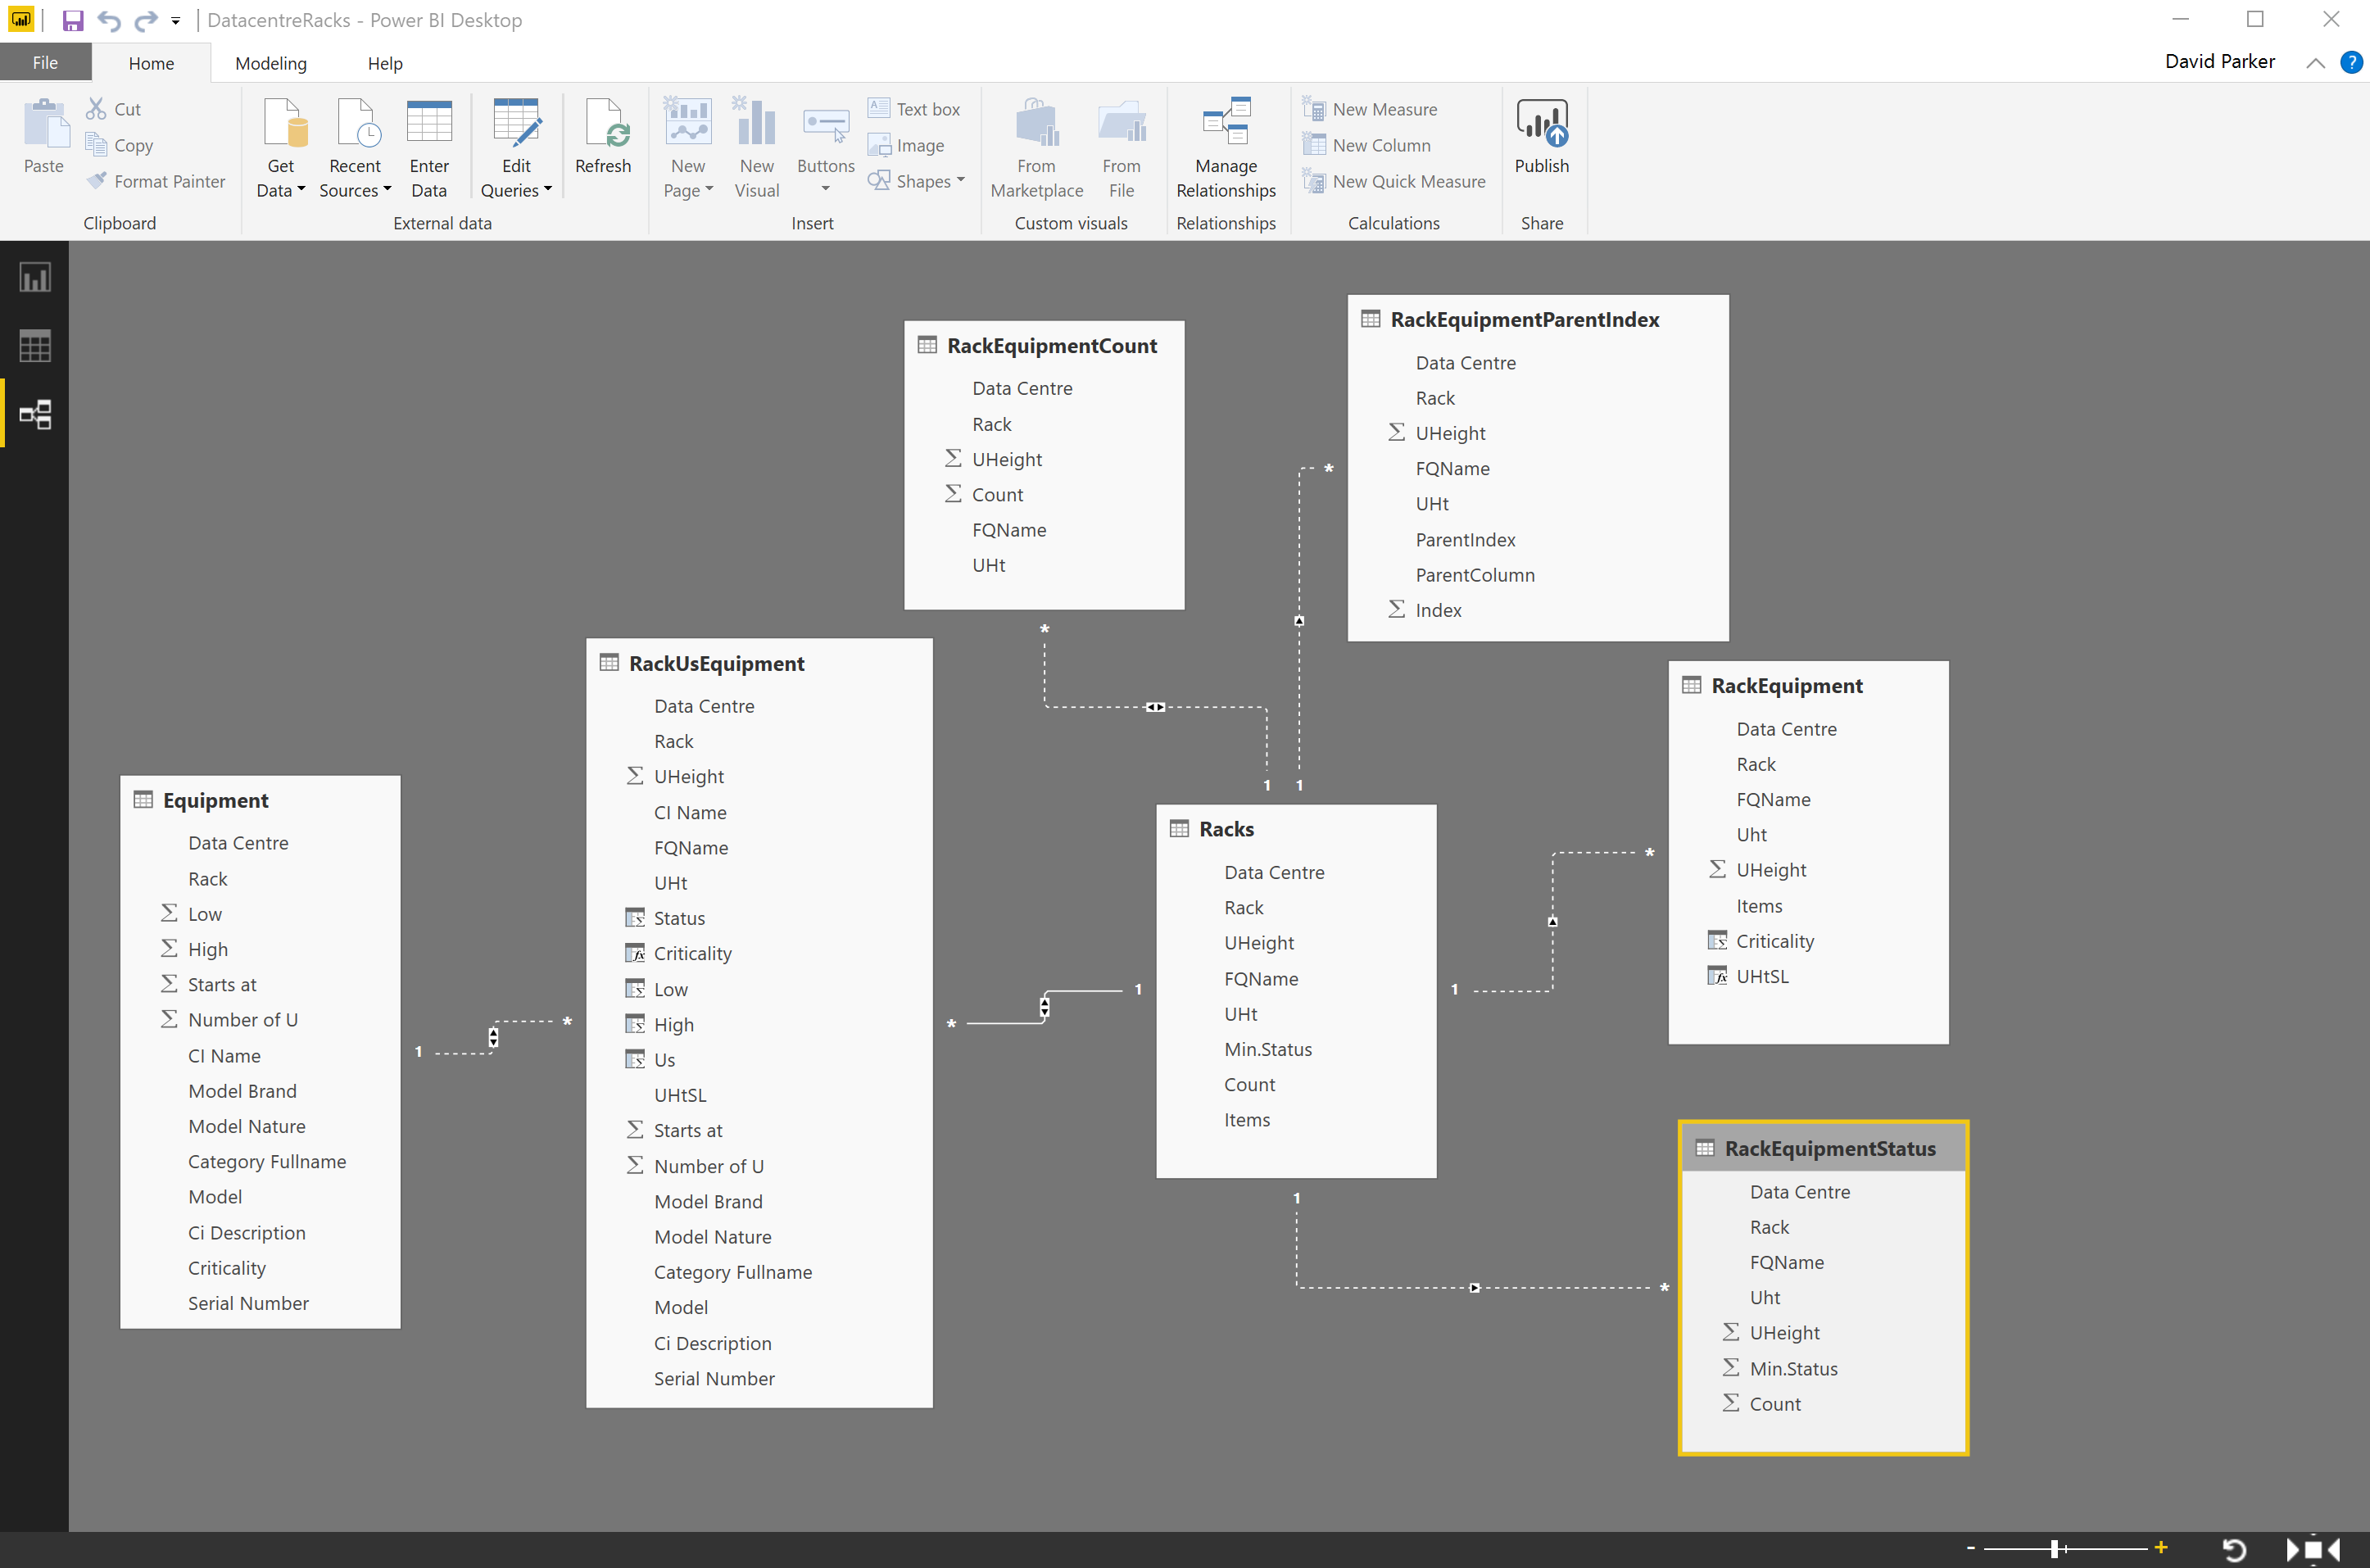
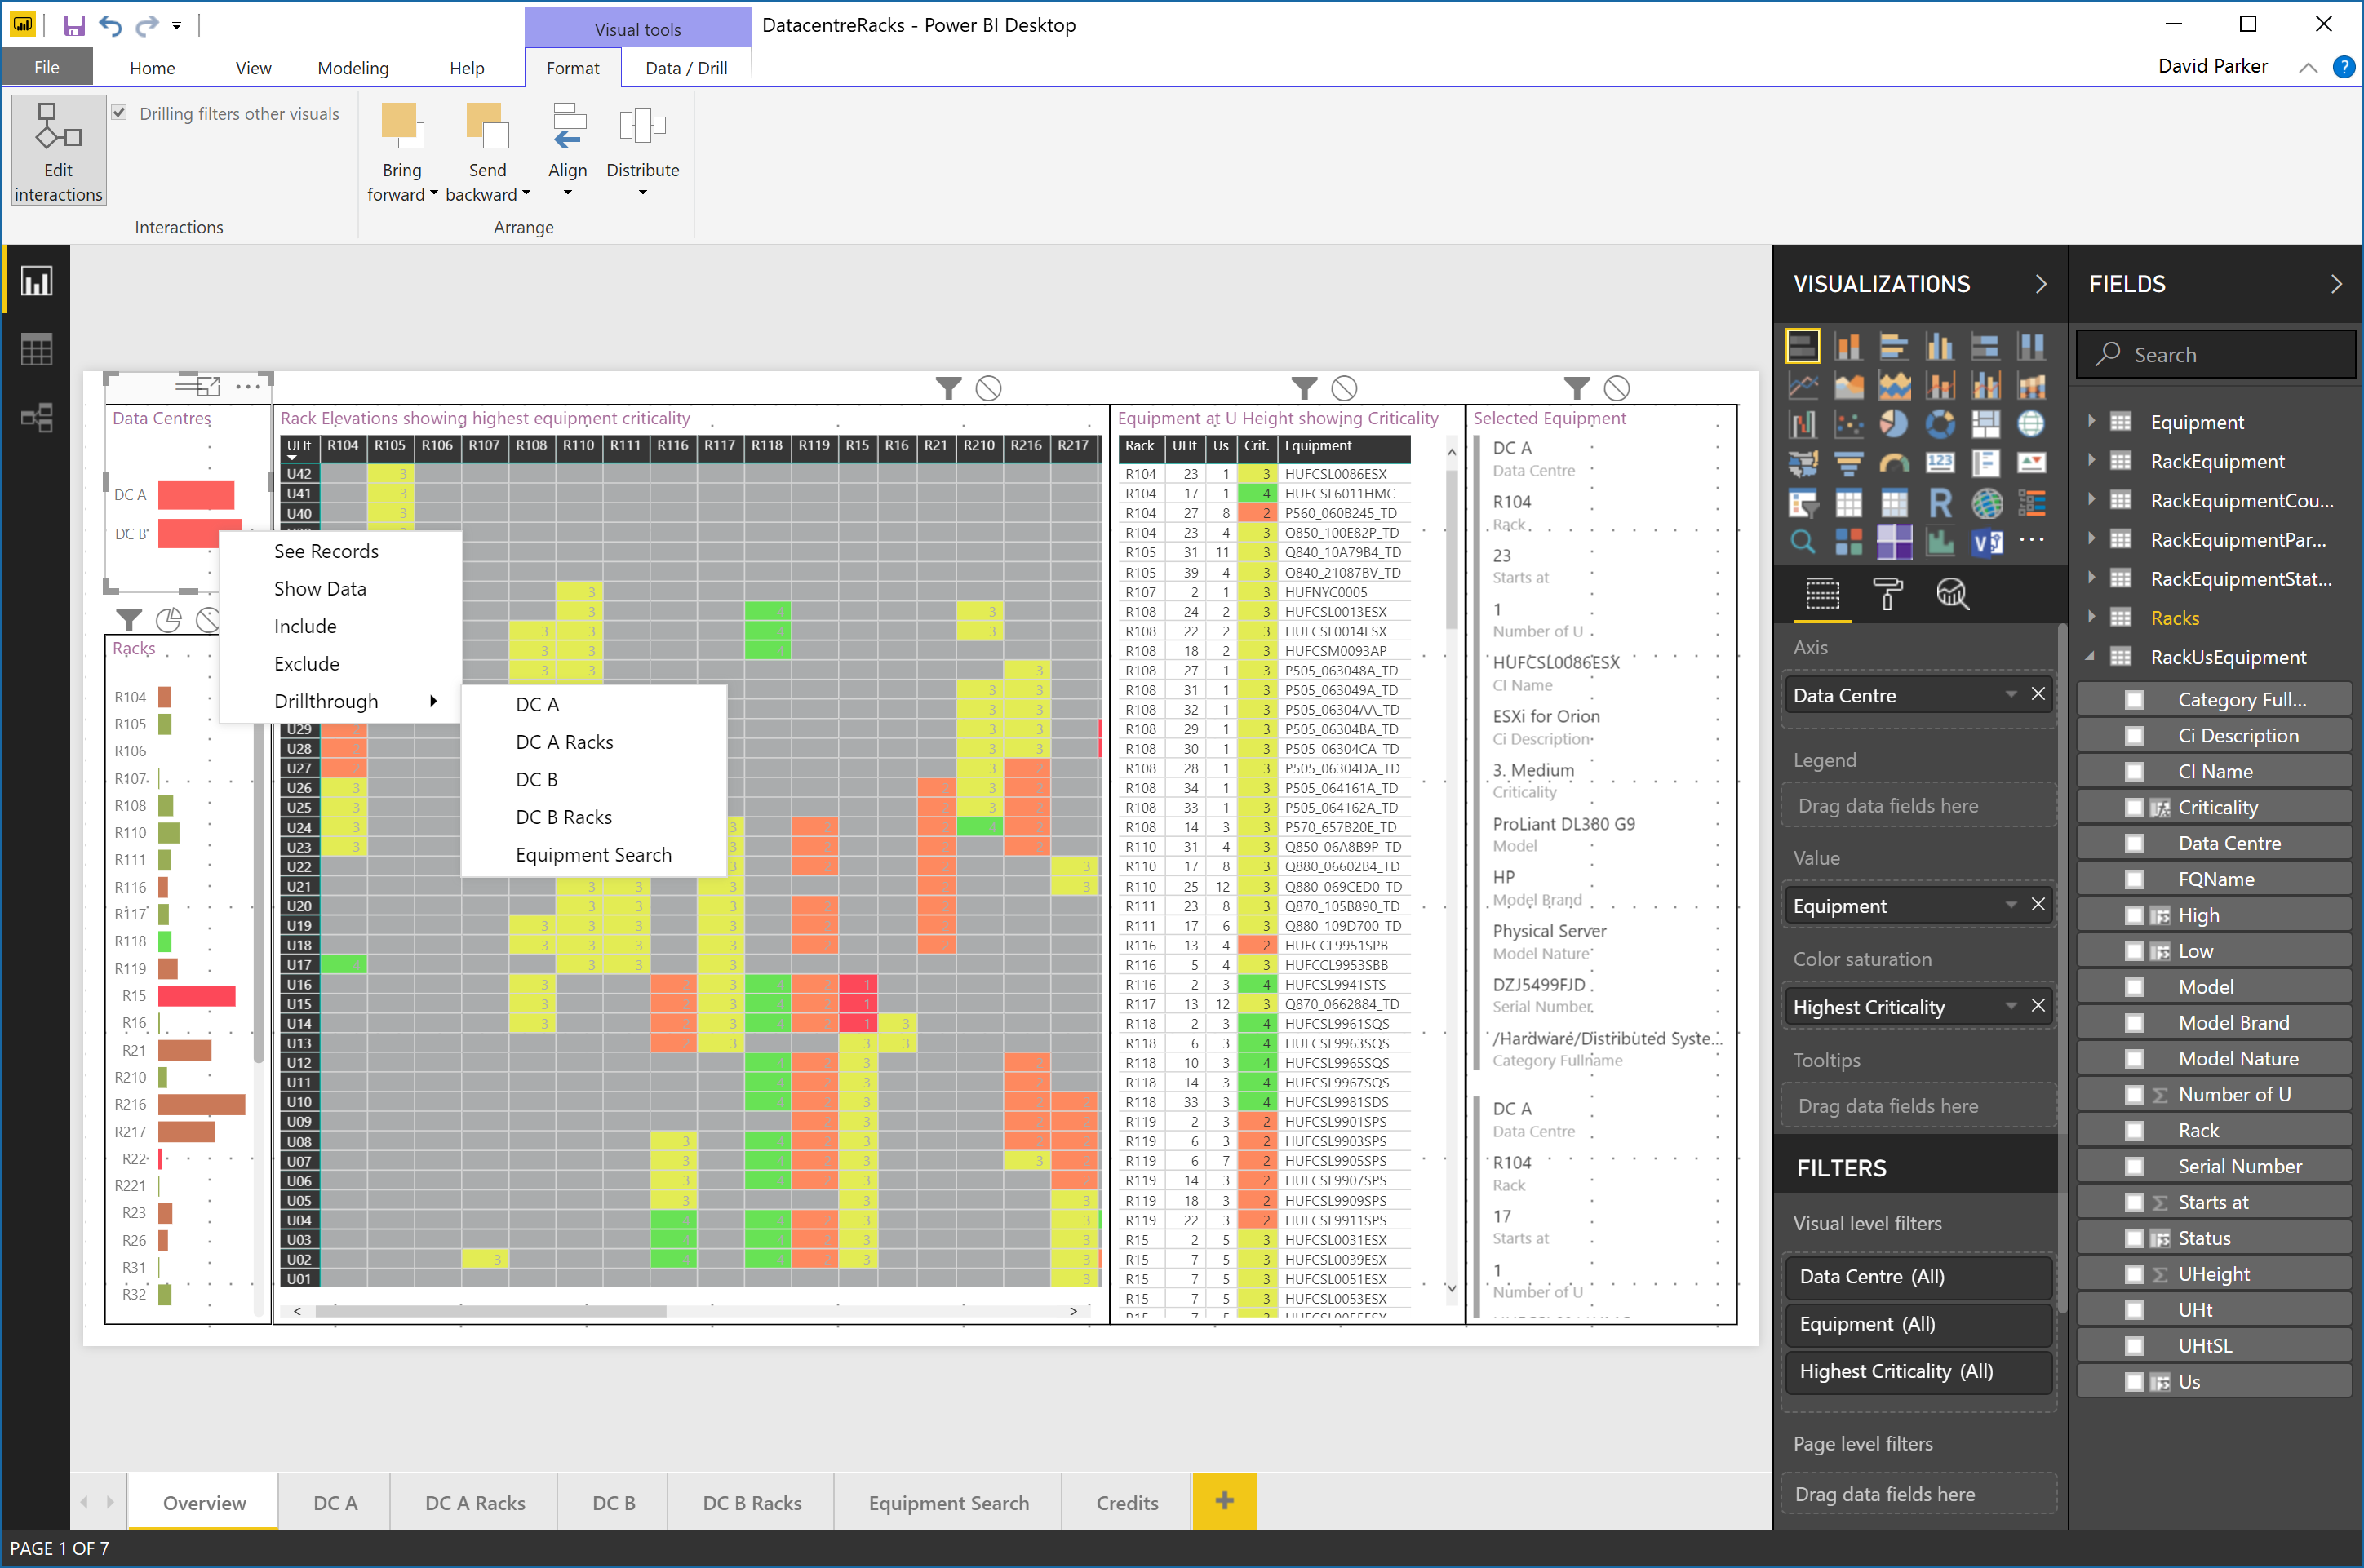
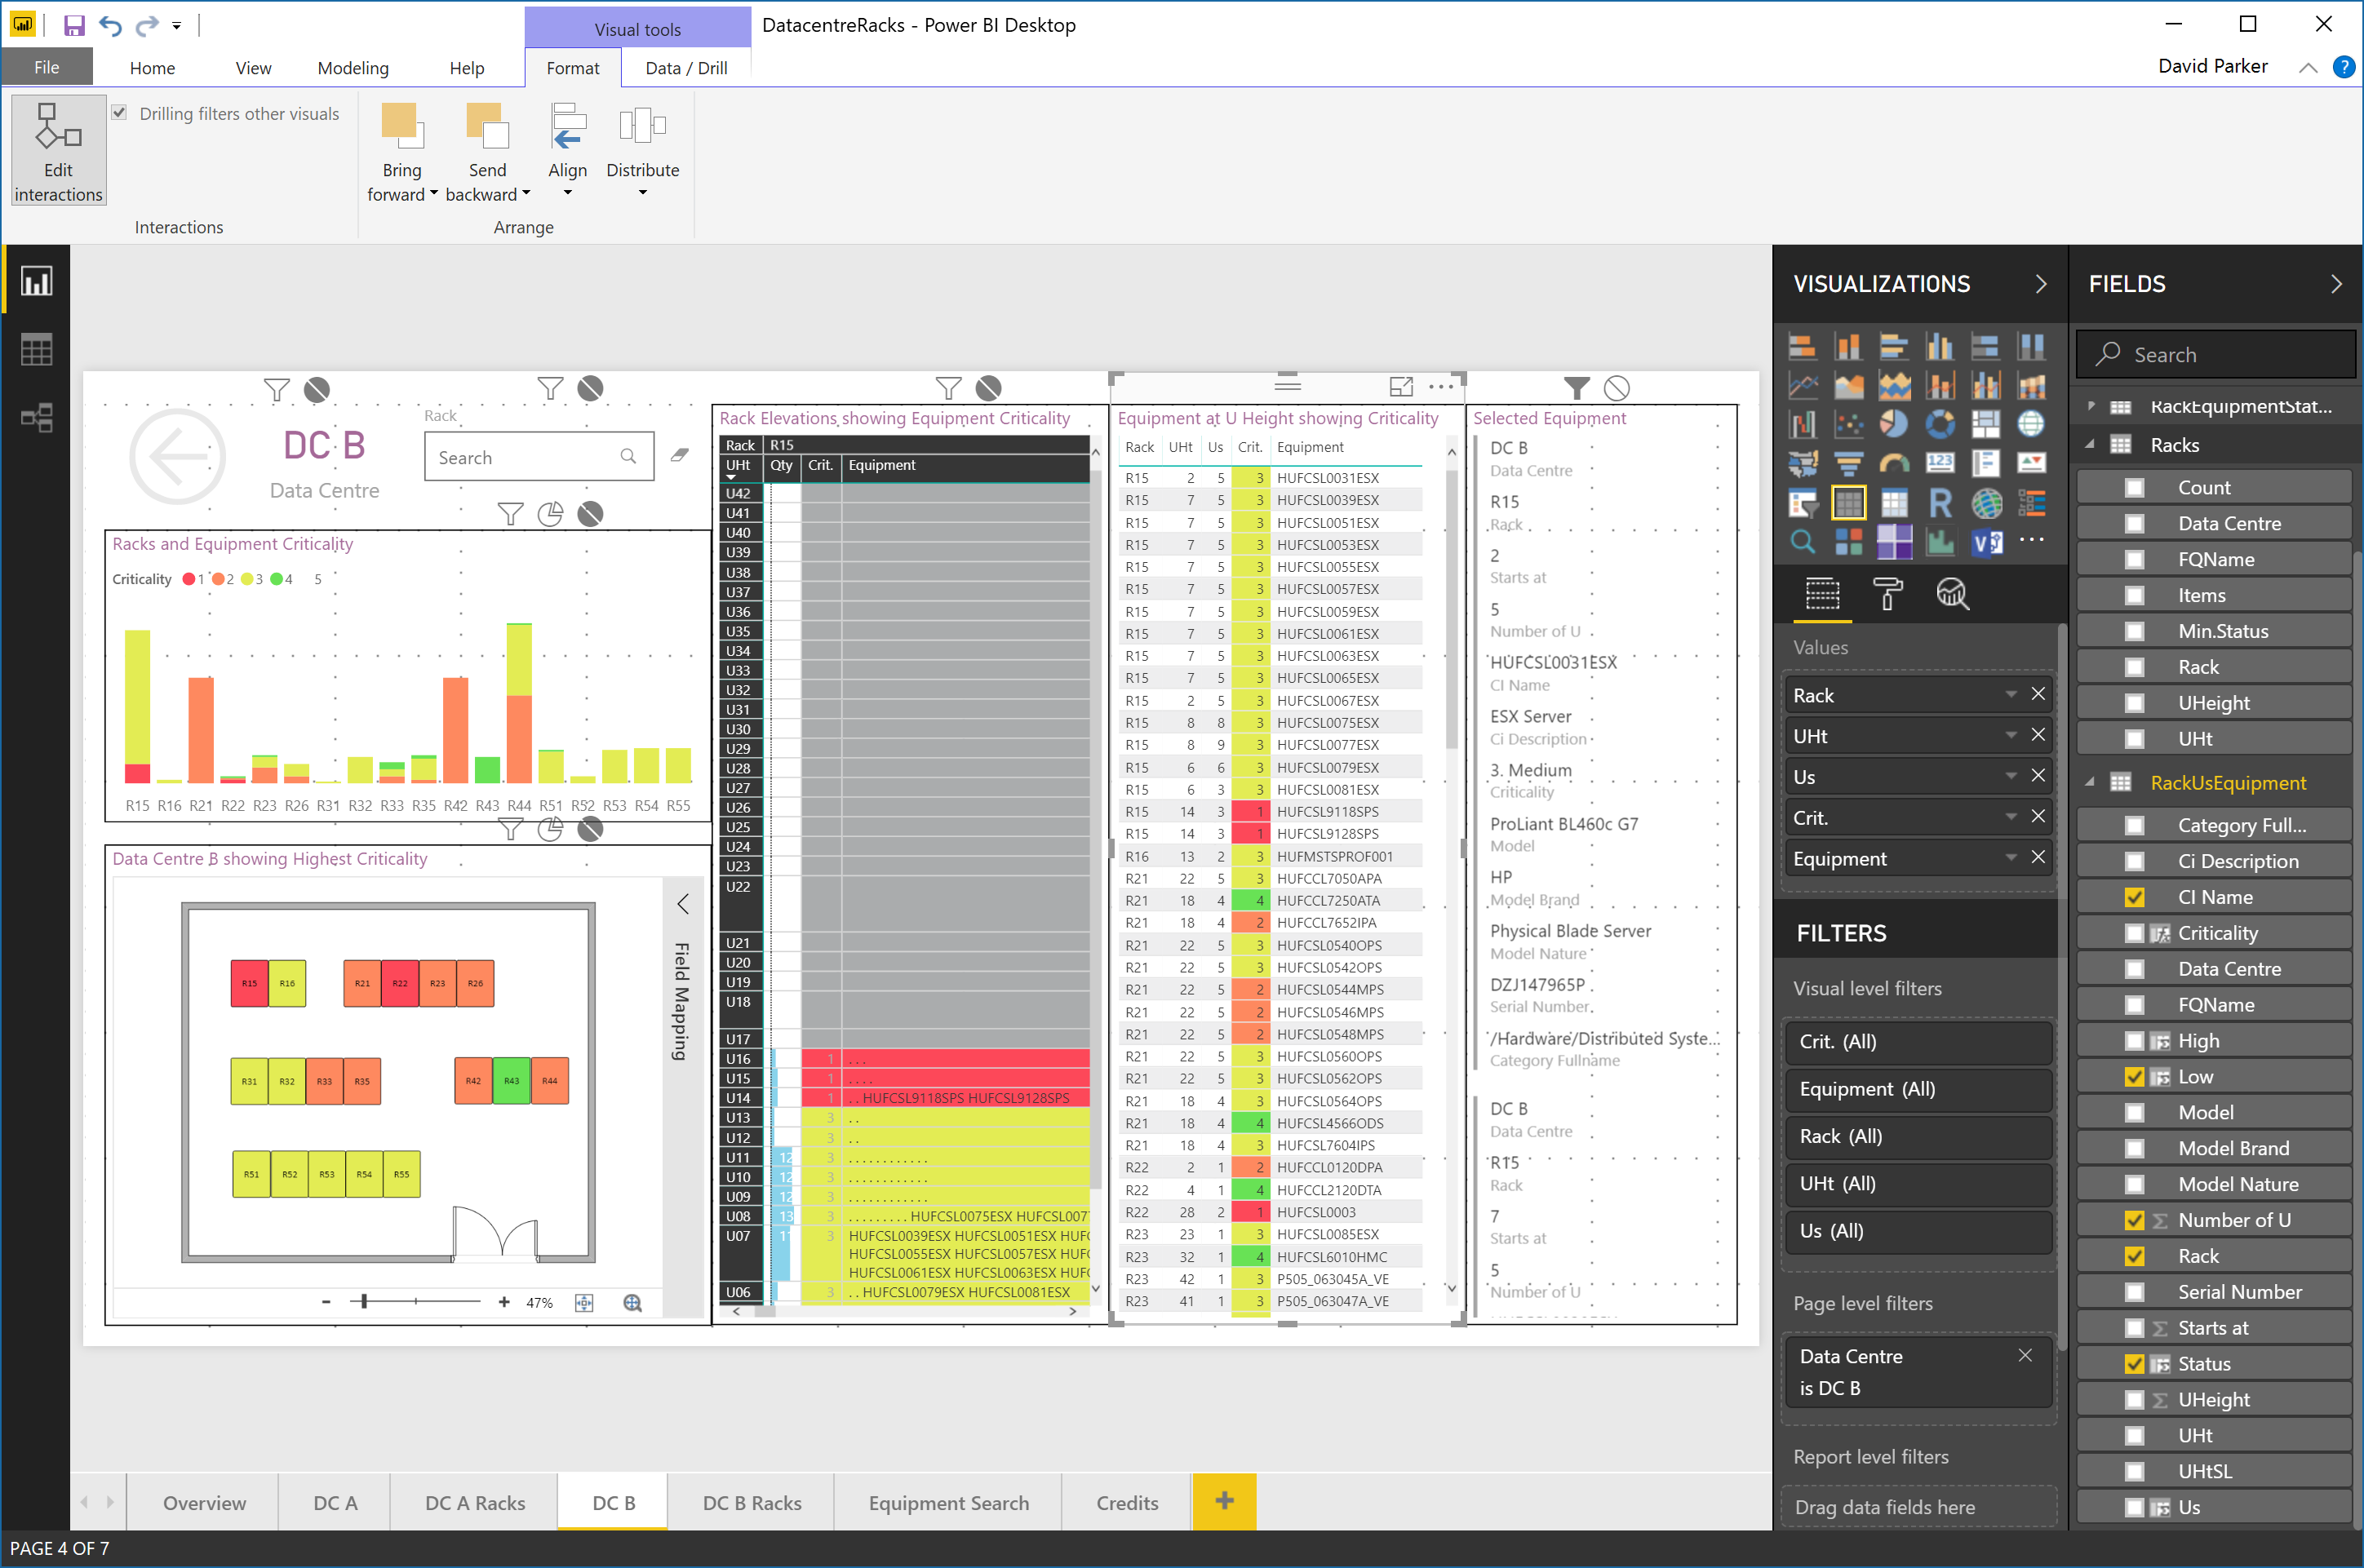
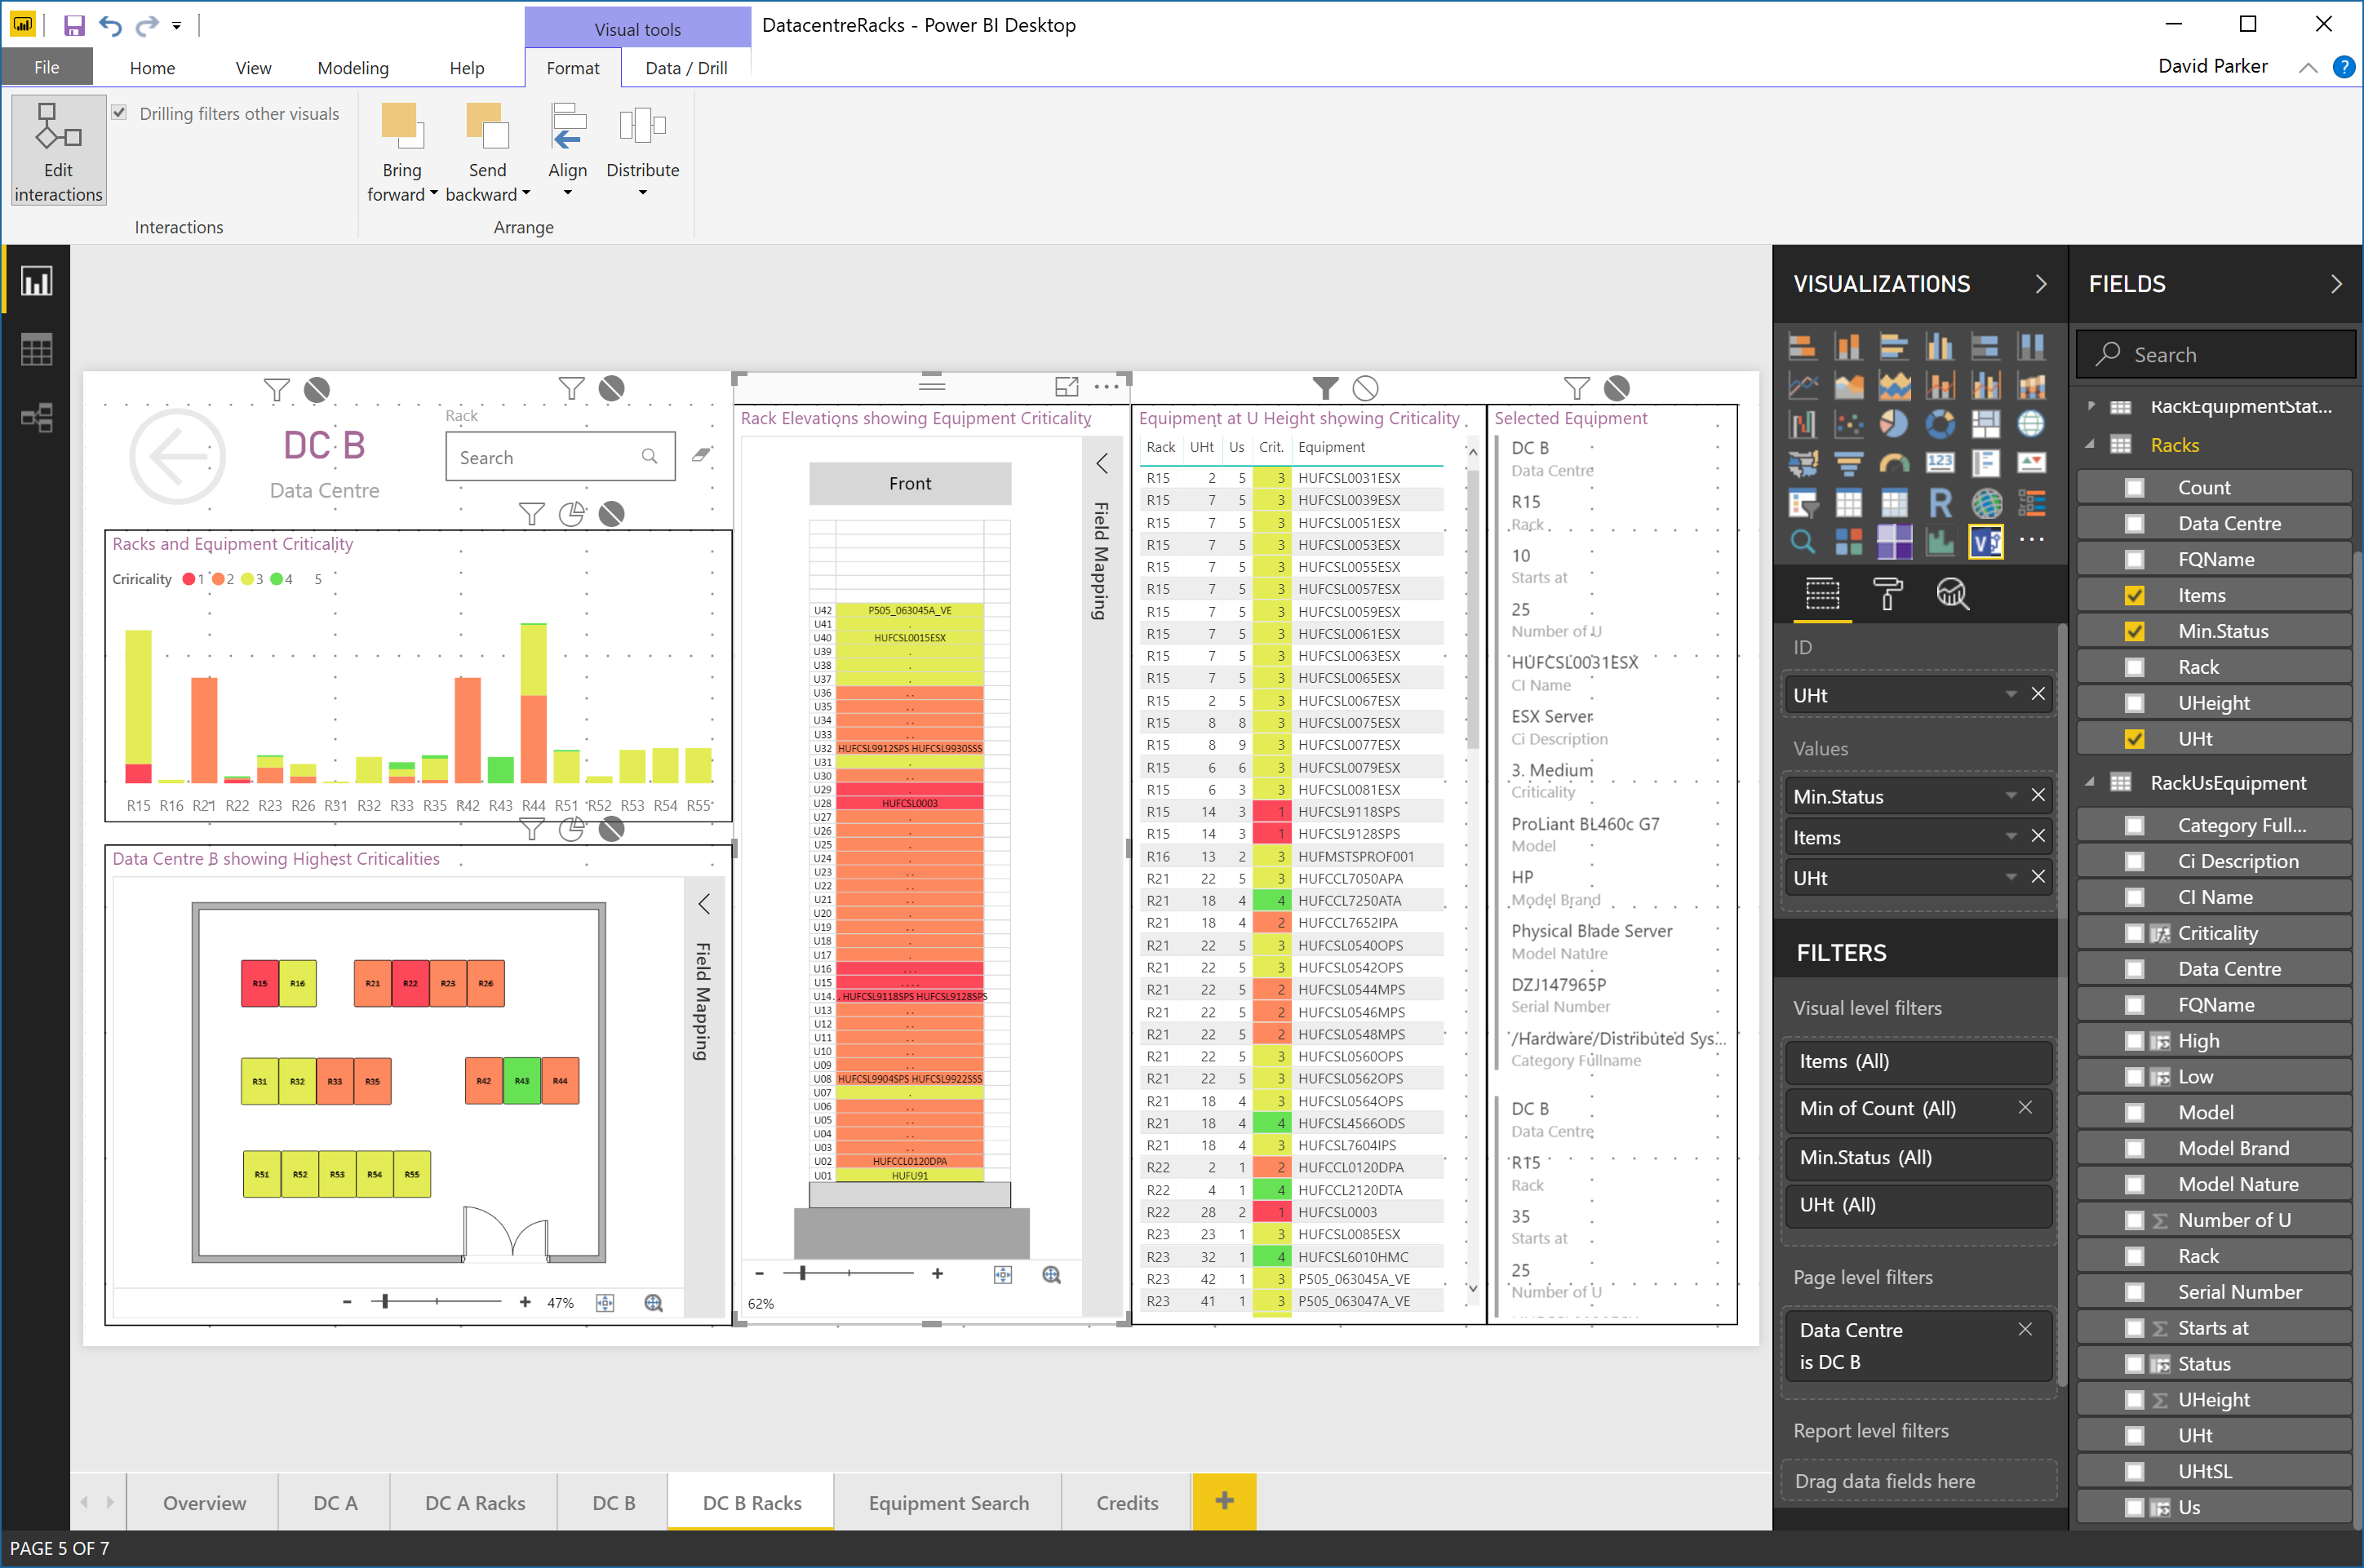
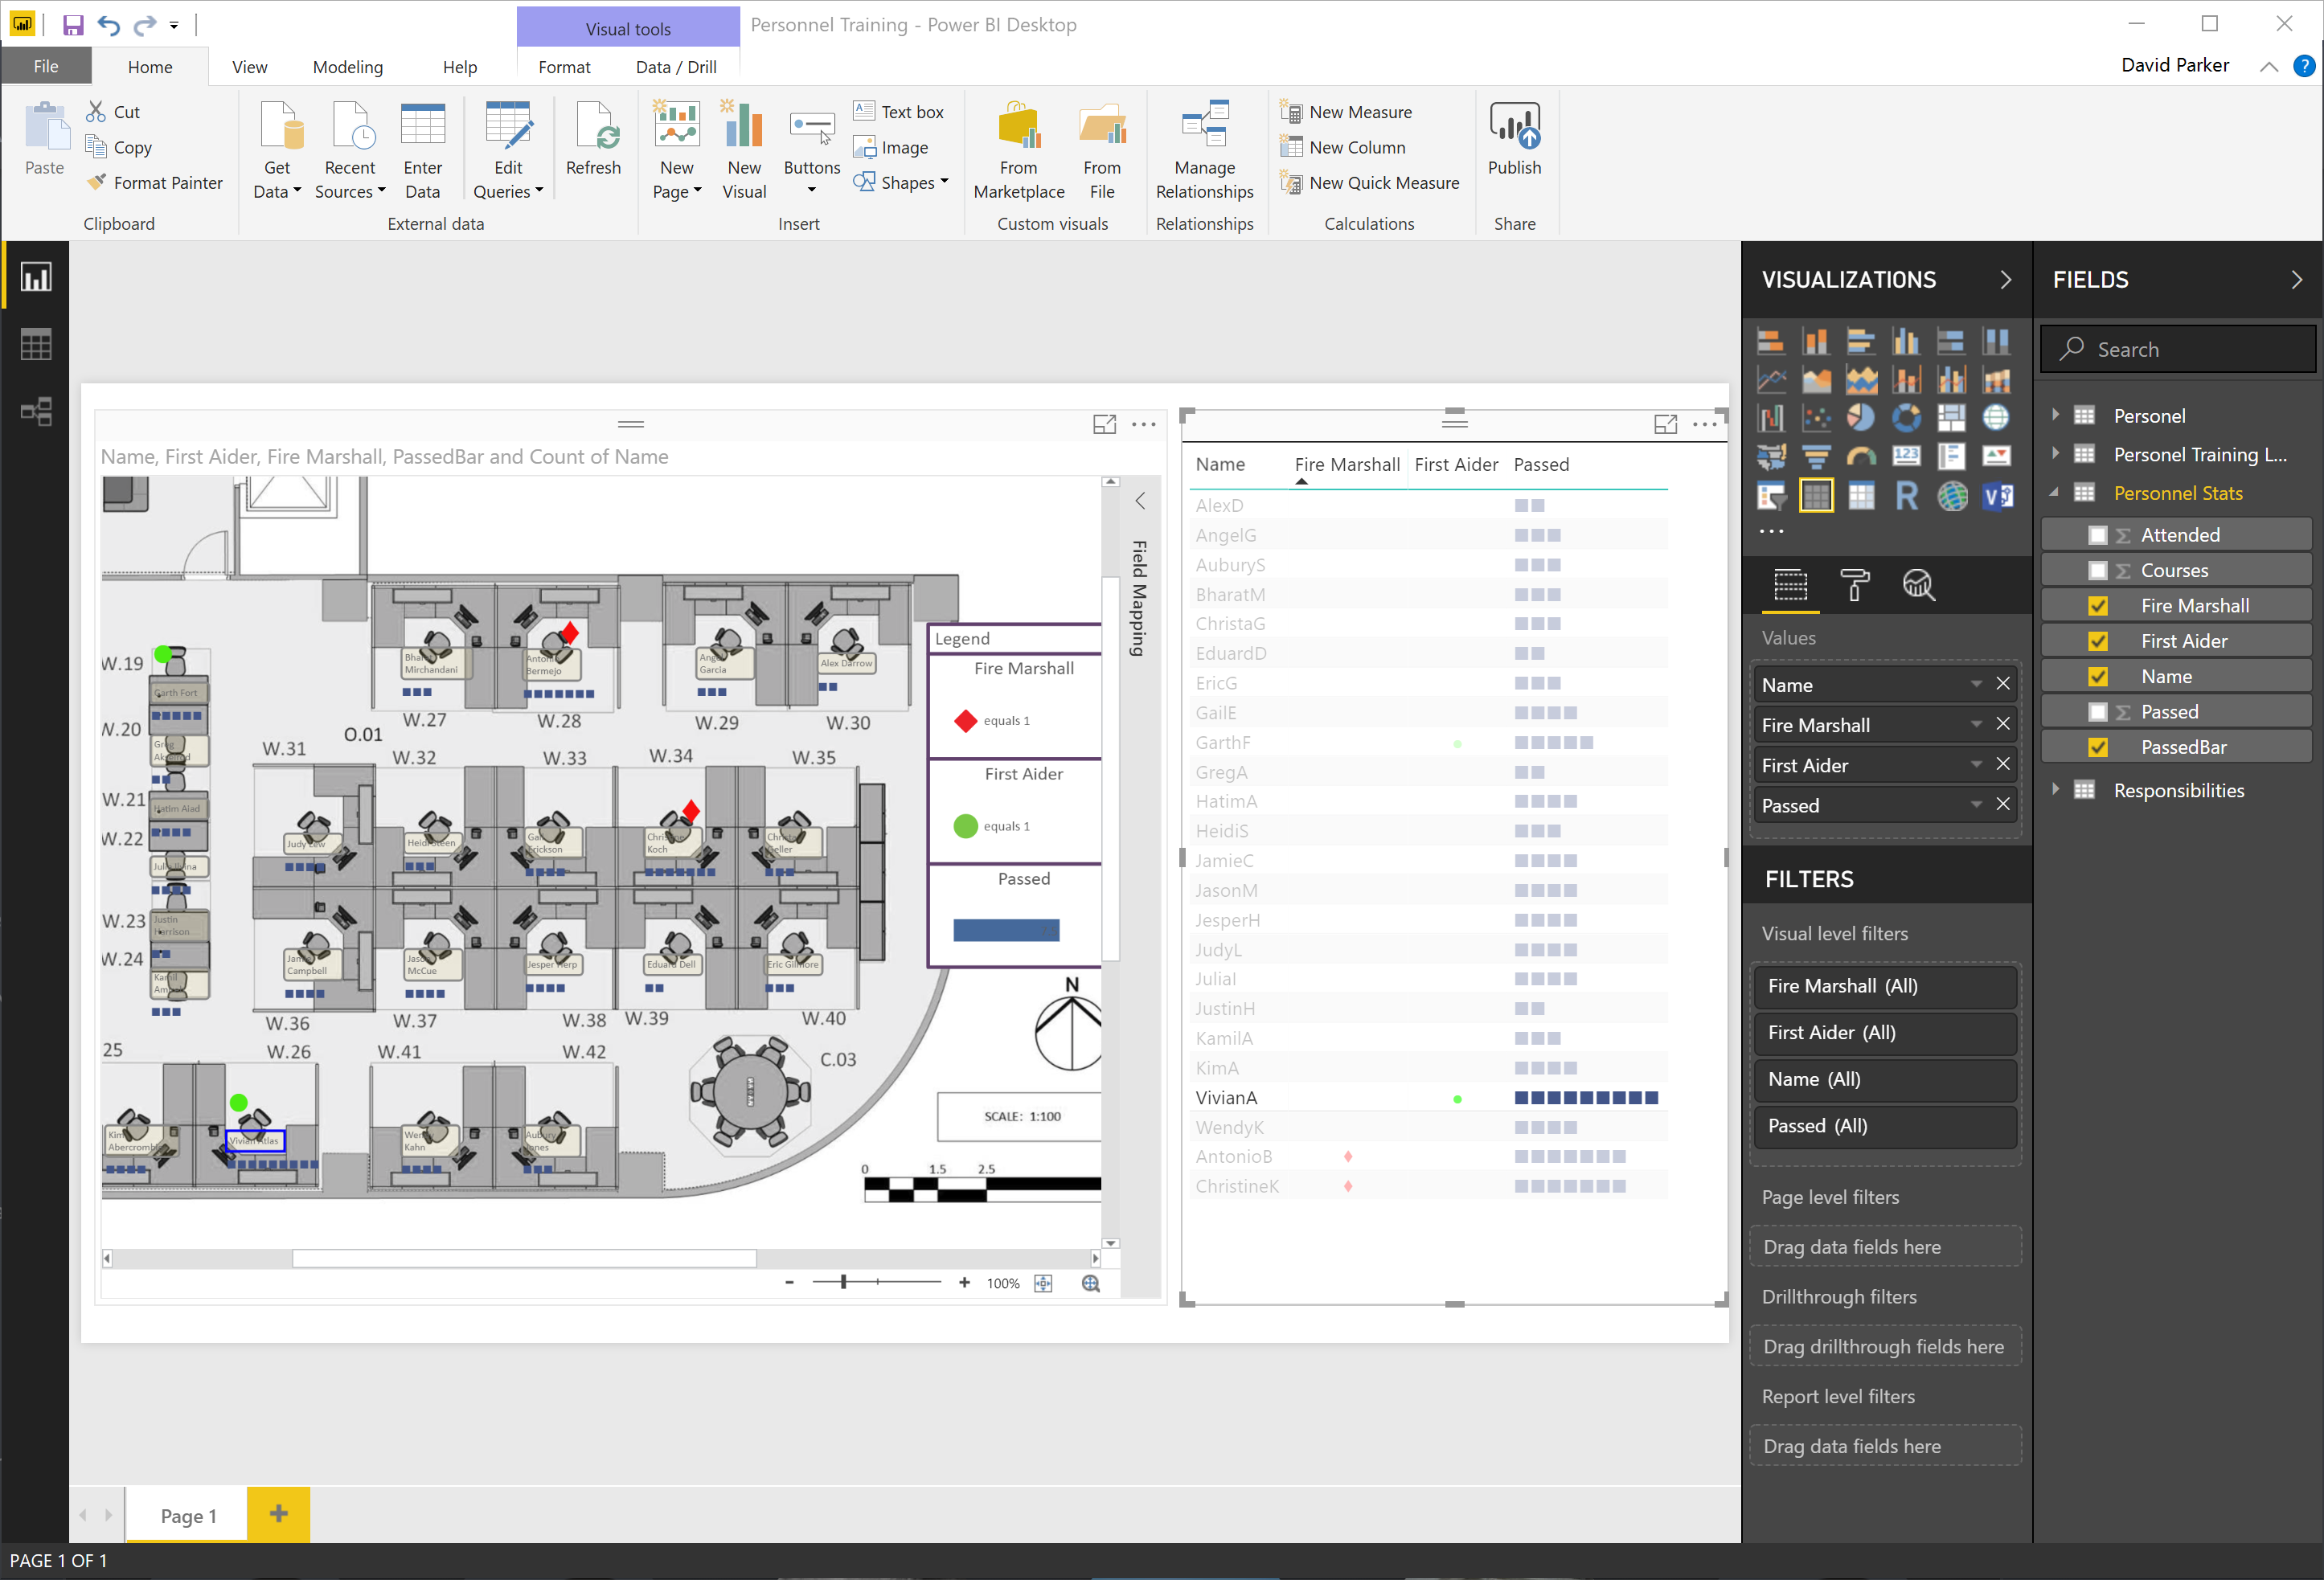
I have often diagrammed rack and cabinet layouts and elevations using Visio linked to a database or Excel tables. There is a Rack Diagram template in Visio which is great for manually creating cabinet elevations manually, but there is nothing currently out of the box to automate this process, so it can be a laborious task unless you have some custom code. It is quite simple to draw a computer room layout of the racks and cabinets and to link each one to a row of data. In this article, I have a table of rack equipment in Excel, and used PowerQuery in PowerBI to summarize these rows for each data center, rack and U height position, since there are sometimes more than one item of equipment per U height. In this example, I have color coded the criticality of each equipment such that the most important display as red, and the least important as green. This means that a PowerBI user can quickly see where the critical racks, U heights and equipment are. Of course, I could have used any metric, such as power consumption, heat output or humidity, for the colour-coding. It all depends on the data available, and the audience for the report.
[Read more…] about Data Centre Racks in Visio in PowerBIPowerBI
Icons Sets and Data Bars in PowerBI Visio visual
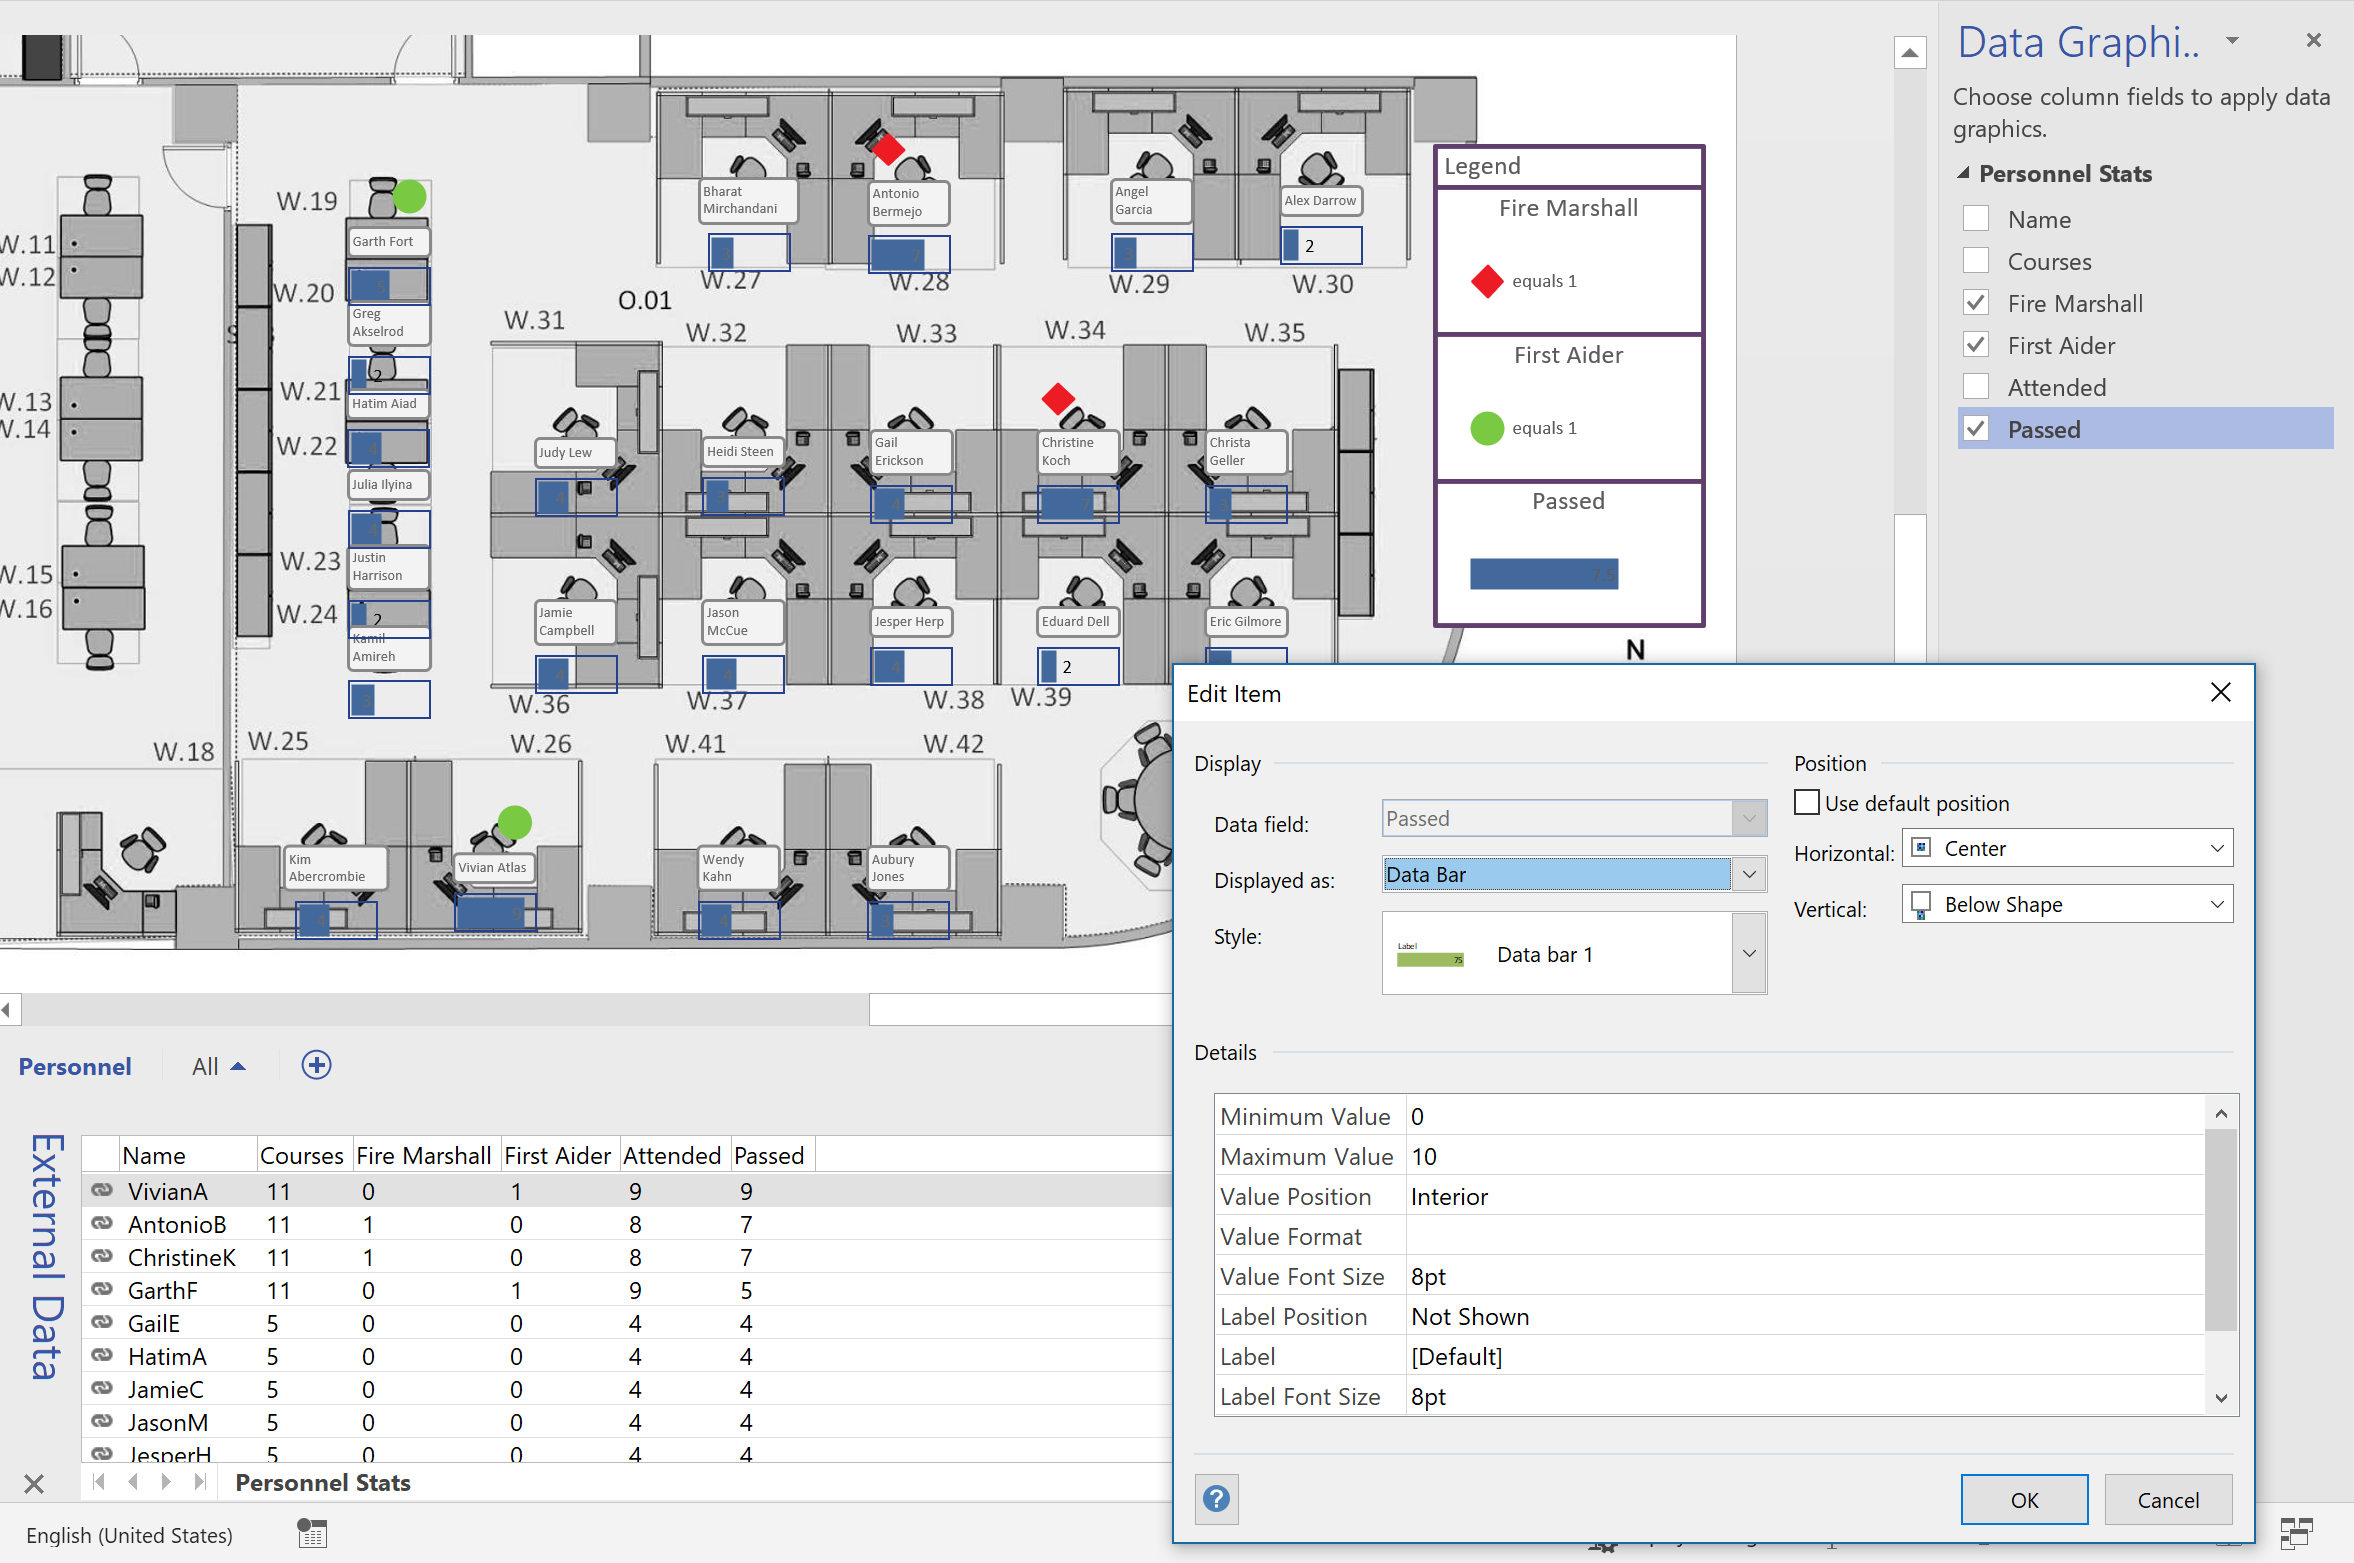
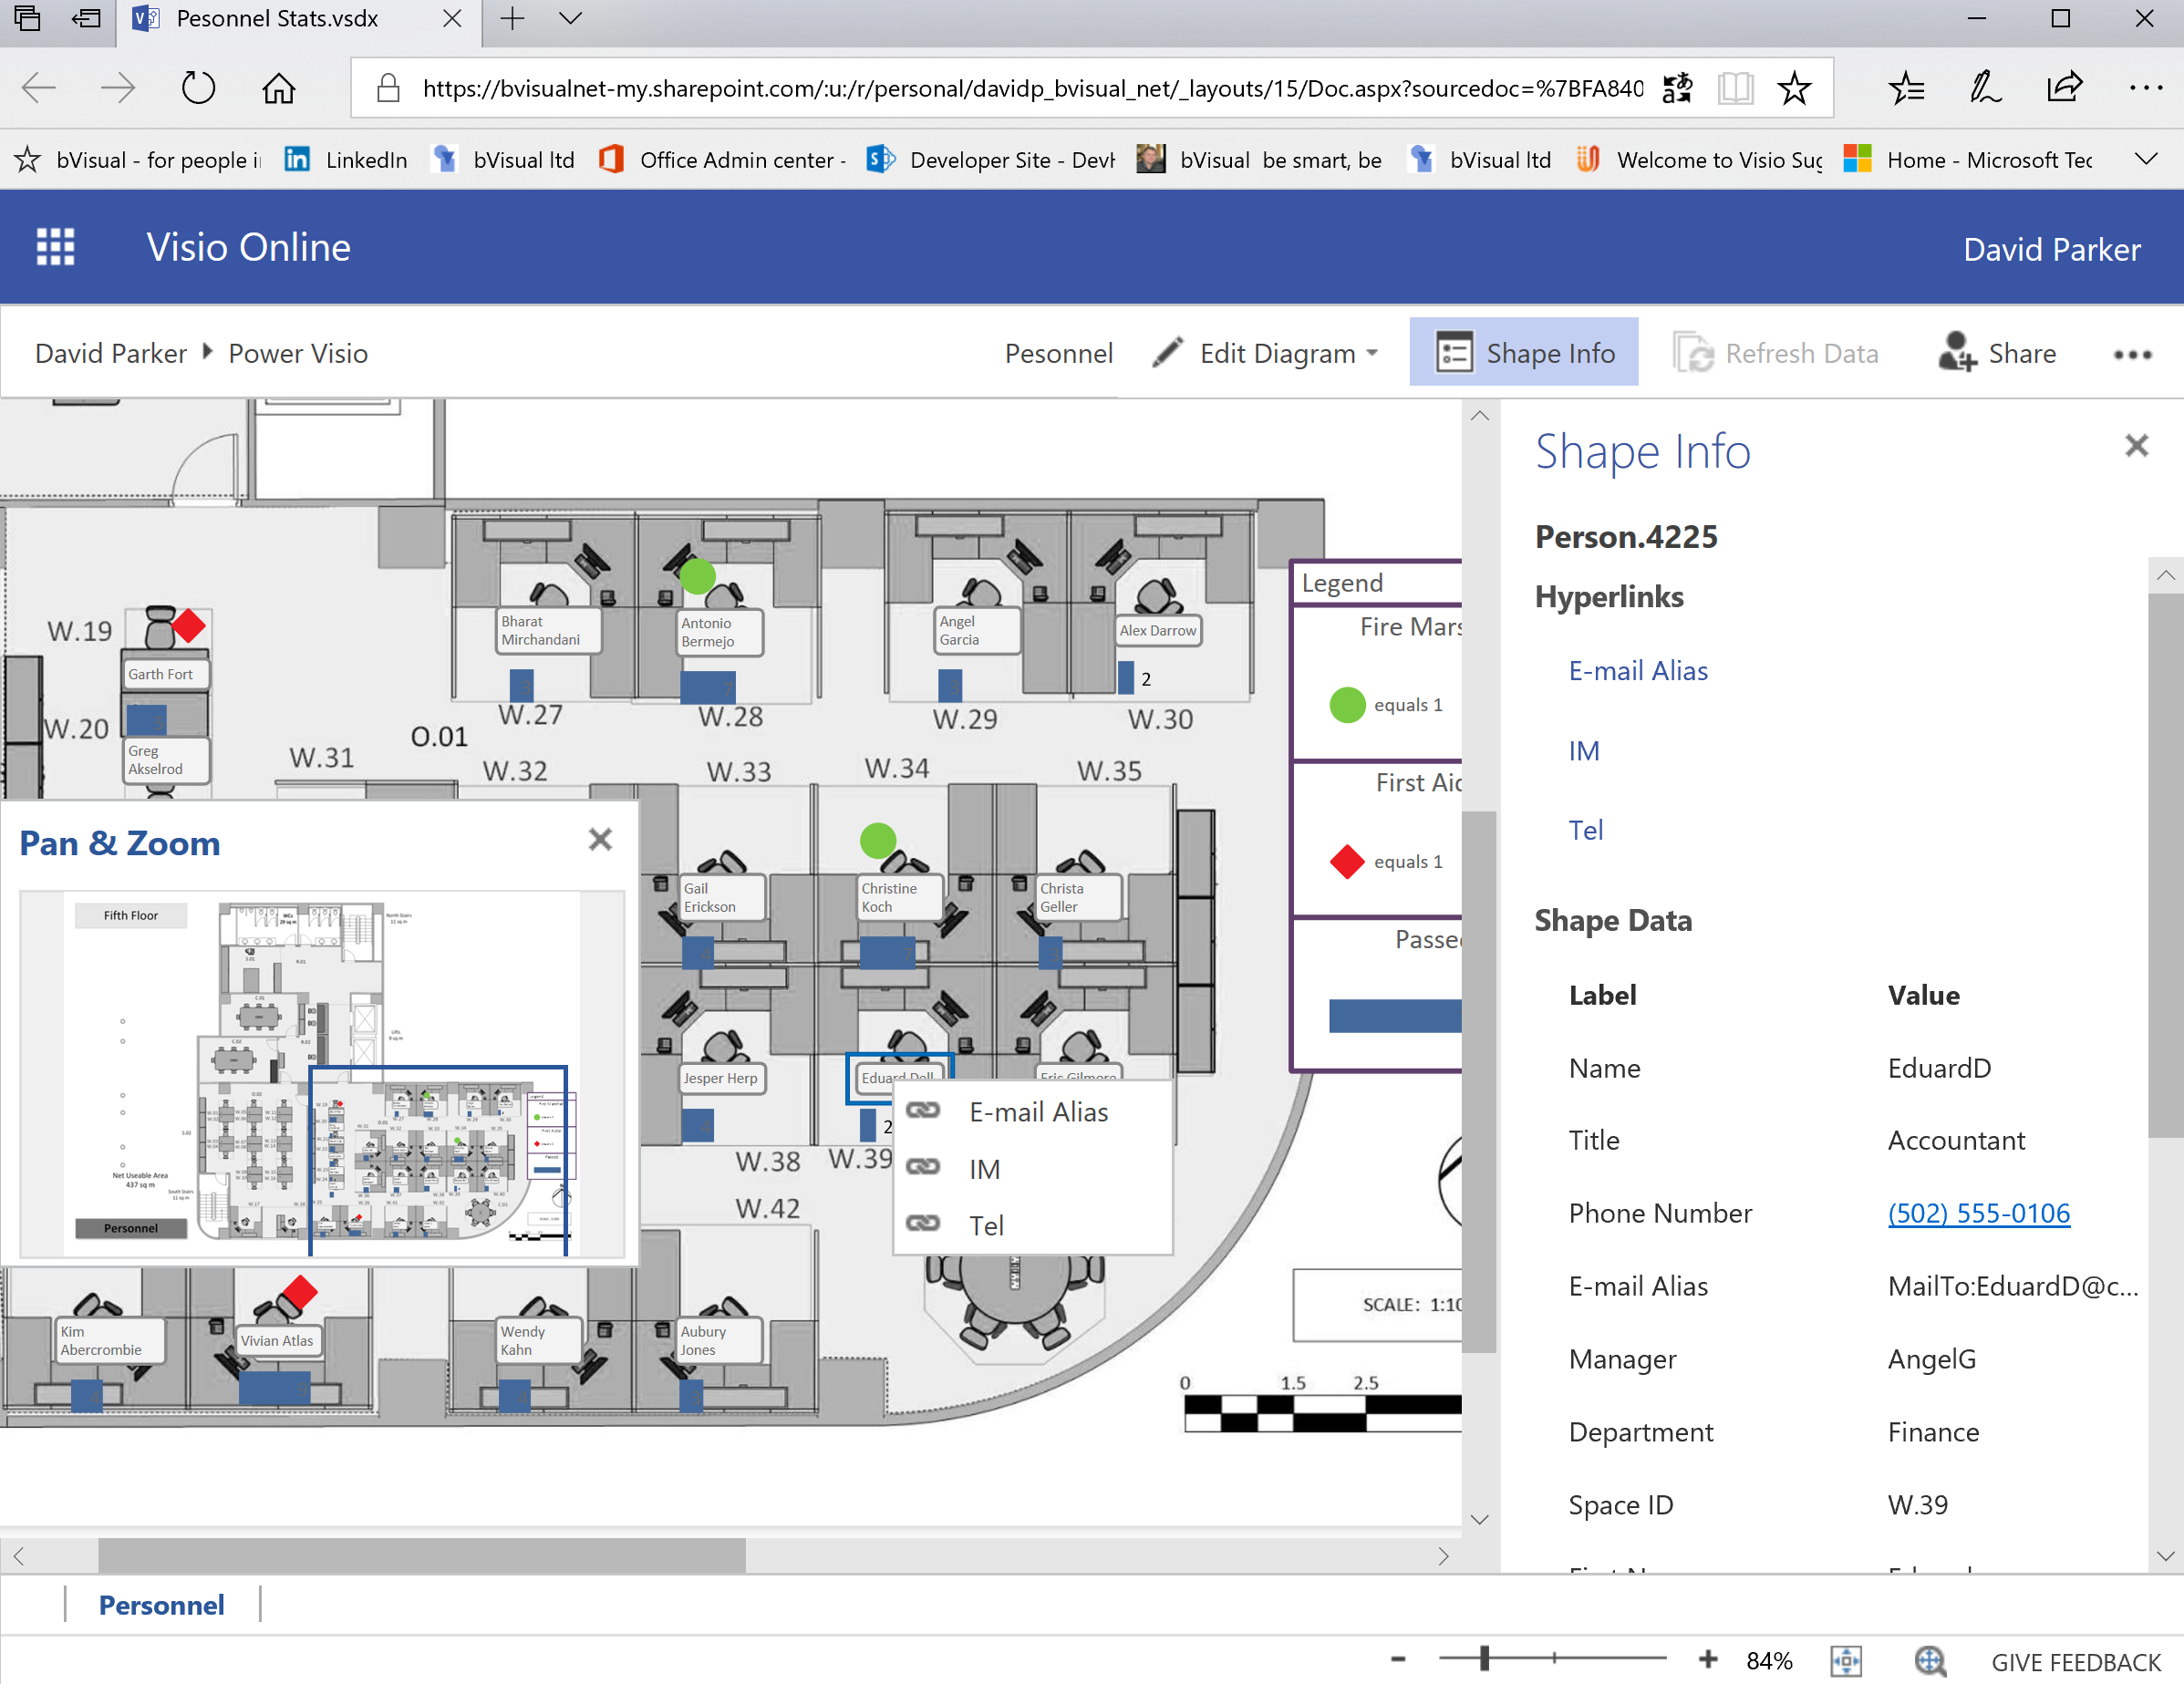
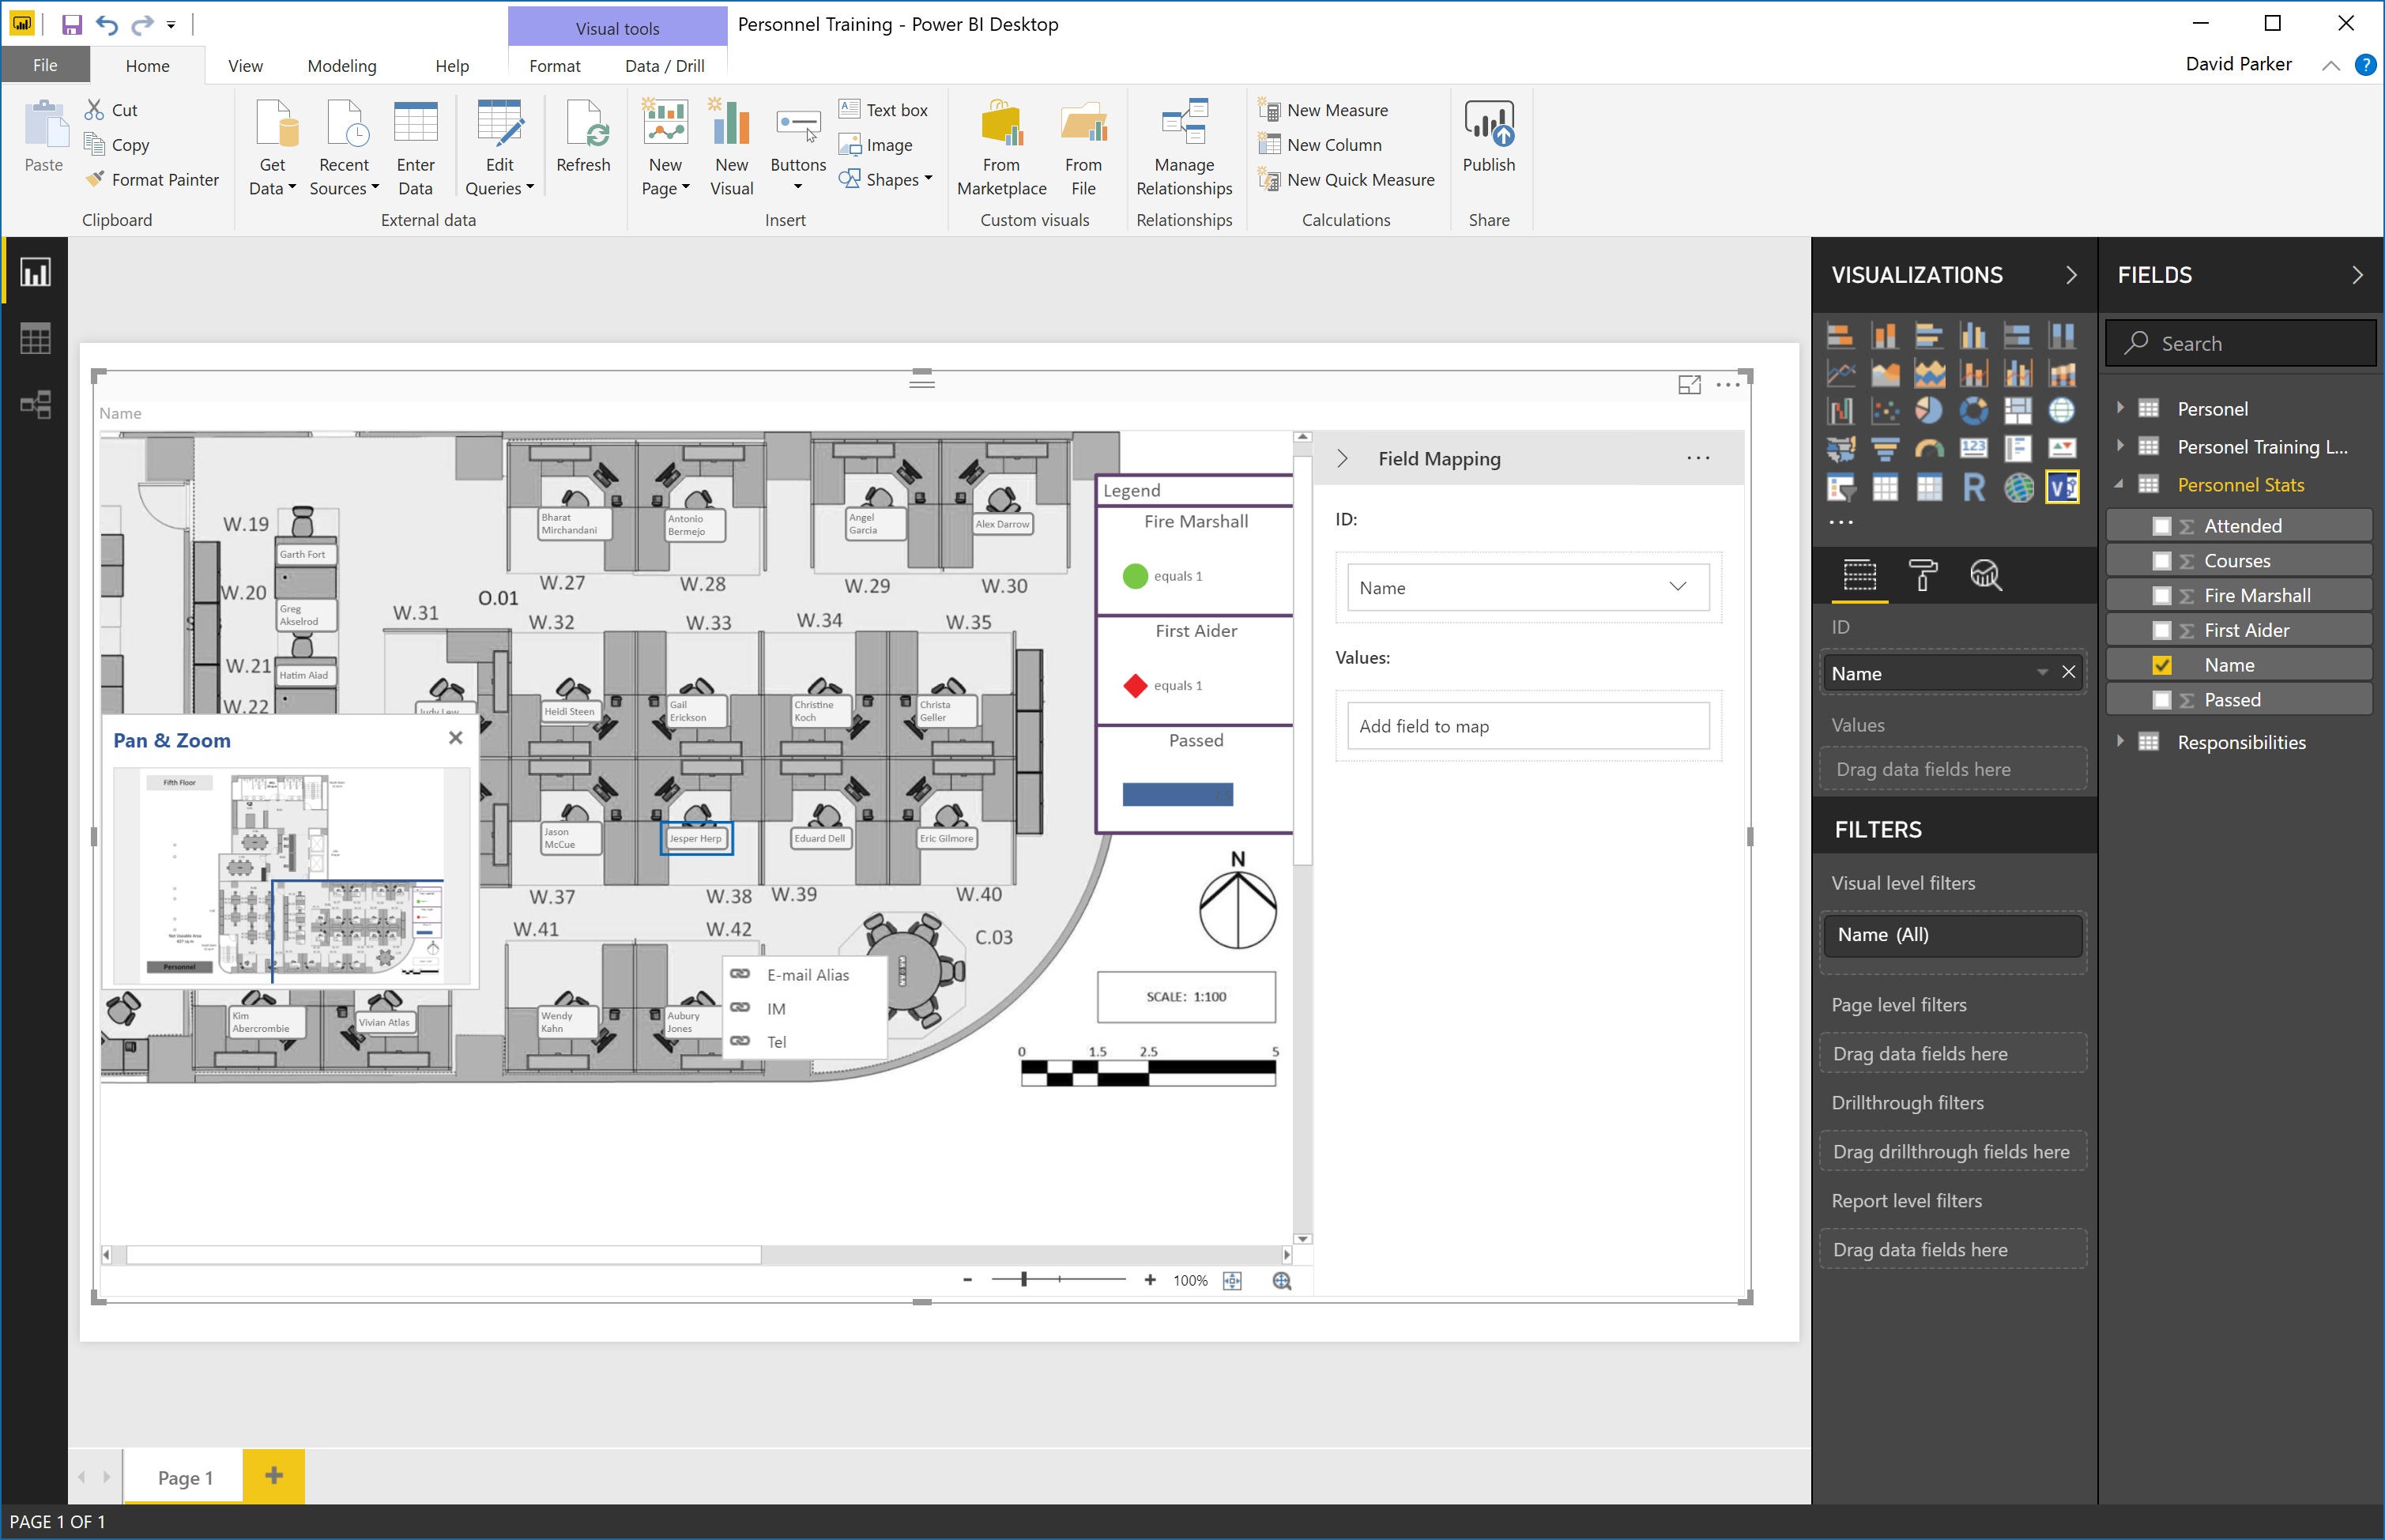
I really enjoy linking data to Visio diagrams, either directly or using the Visio custom visual in Power BI. This visual has the ability to display PowerQuery data as text or color, but not as icons or data bars. These last two features are something that can be used natively in Visio, and automatically updated in Visio Online. I have previously urged Microsoft to add these abilities to the Visio custom visual in Power BI, but there is no sign of it appearing just yet. The custom visual actually removes any Data Graphics ( Text Callouts, Icon Sets, Data Bars or Color by Value) that may already exist in a Visio diagram when it is embedded into Power BI. This reduces the number of shapes in the visual (there is currently a low limit) and, in any case, the data should be displayed from Power BI.
I want to be able to display some data as icons and data bars within the Visio diagram, so what is the alternative? Fortunately, there is a way using text symbol characters and the wonderful Power Query formulas!
Visio Automation for IT Design & Operations – London, 25th April 2018
I am pleased to announce that I will be co-hosting a free event at the new Microsoft Reactor in Shoreditch on 25th April, aimed at showcasing Visio automation for IT design & operations. You can find more details and sign up here.

Using Visio and PowerBI with GraphDatabase in SQLServer – Part 2
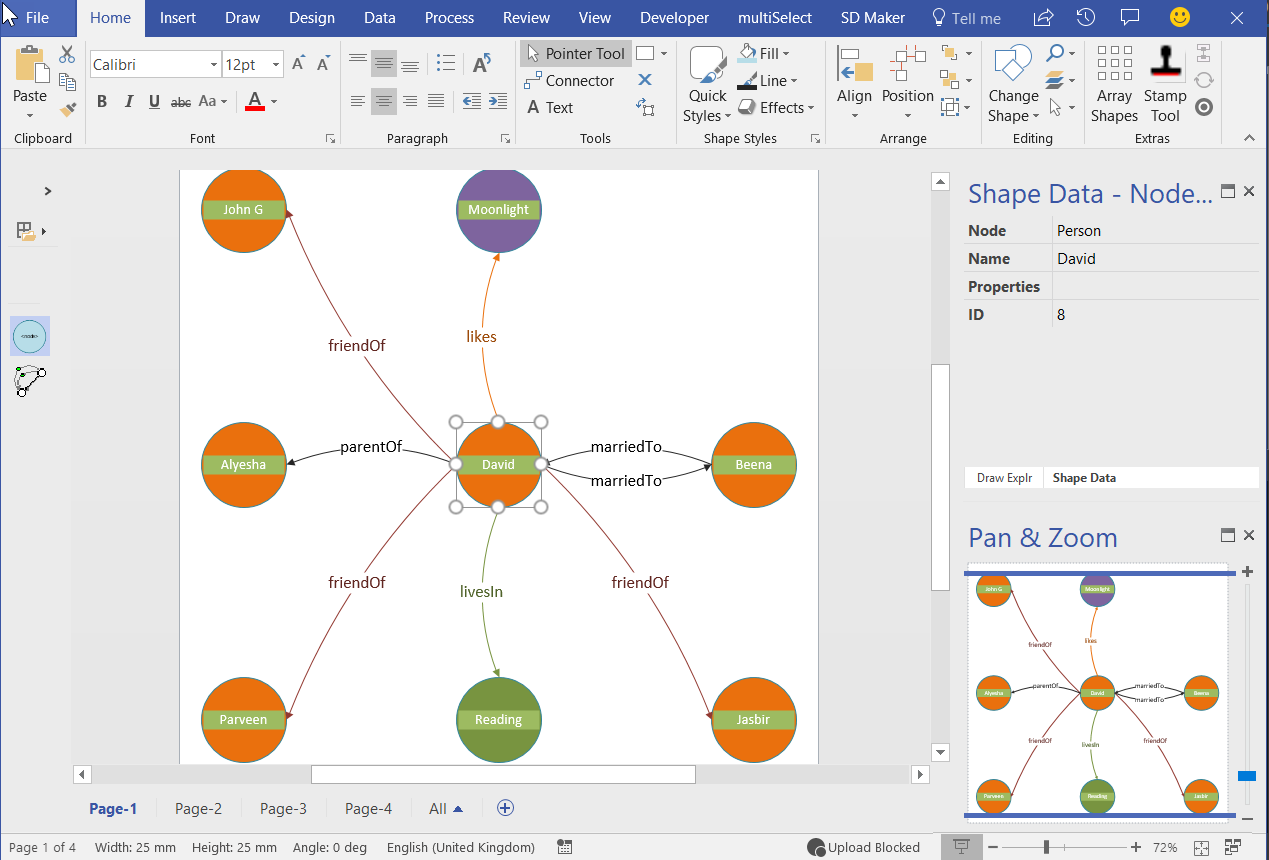
In my last article, I described how Visio can be used to input Nodes & Edges into a SQL Server graph tables (see Using #Visio and #PowerBI with #GraphDatabase in #SQLServer). In this article, I show how PowerBI can be used to create an Excel table that can then be used to automatically create a Visio diagram. This diagram can then be enhanced for reports and presentations, or used to check the validity of nodes and relationships. The shapes can then be used to update or delete edges and nodes in the database.
Using Visio and PowerBI with GraphDatabase in SQLServer
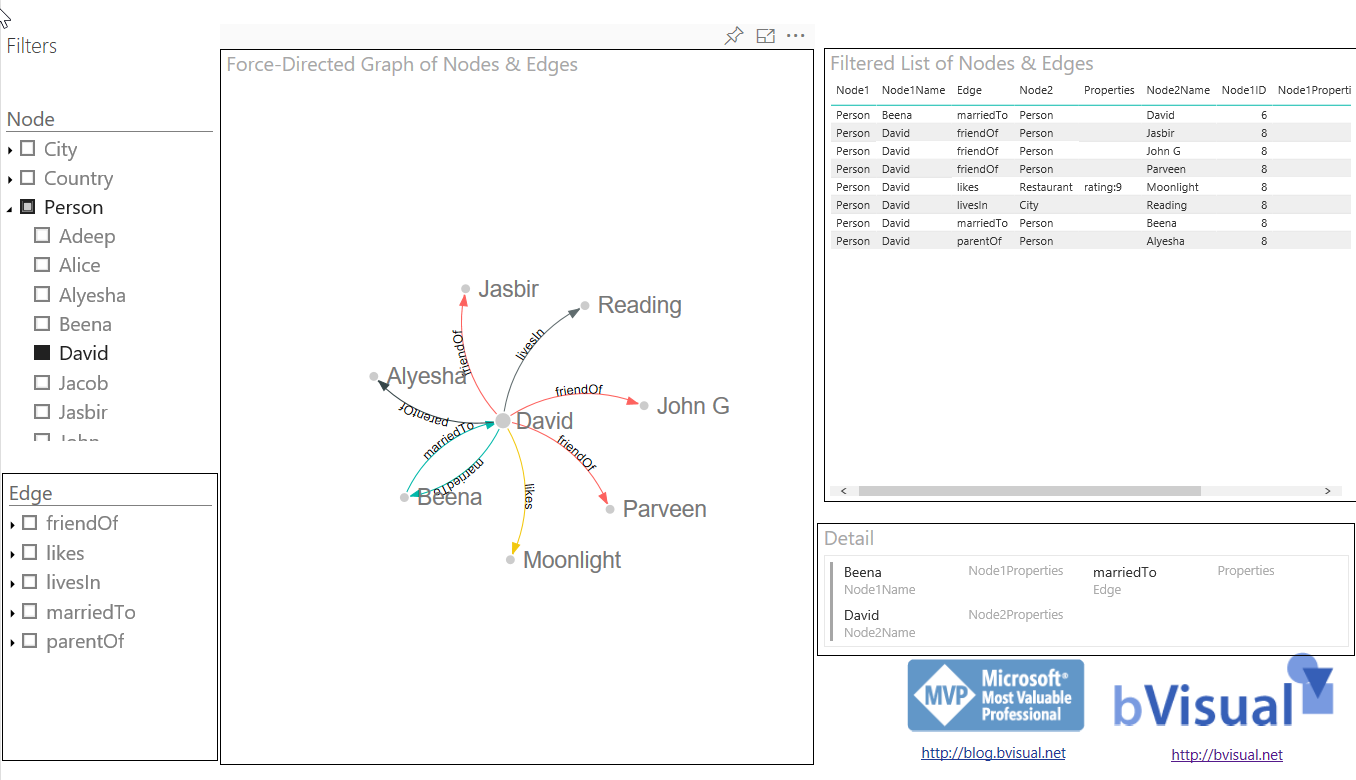
I went to a very interesting inaugural meeting of the South East UK Power BI Group last week. Whilst the presentation by Dr. Subramani Paramasivam was impressive for its ambition, it was the presentation by Andrew Fryer of Microsoft that particularly intrigued me. He introduced us to the world of Graph Databases, such as Neo4J and CosmosDB, but also demonstrated SQL Server 2017’s new Graph table types, called Node and Edge. He used the latter because solution because he could use example in Power BI using the Force-Directed visual. Well, this SQL Server feature was new to me, and so I was inspired to see if I could use my favourite tool, Visio, to input data into a graph database, and to selectively display parts.
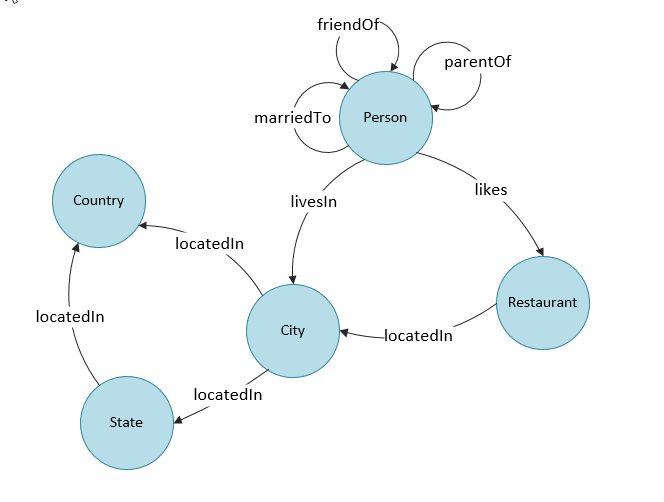
This is something that I have often grappled with because, great as Visio is for diagramming, it is not the answer in all situations. It is brilliant at connecting shapes together, and adding data to each shape, including the connector, but it would not be fantastic at displaying all the millions of data points and relationships in any graph database worth its salt. However, what if another application, such as PowerBI, could be used to analyse and filter the information down to a more manageable scale, and then export the filtered data set to Visio where it can display the relationships, and be enhanced for inclusion in reports? Although I really like PowerBI, I do not think it generally provides an output that is report quality. Especially when reviewing the links between many nodes.
It is possible to insert data into SQL Server graph tables from csv files, but this is not always the most intuitive manner. Indeed, Andrew Fryer, whom I know to be a brilliant artist, resorts to sketching relationships freehand, and then creates tables or scripts from the diagram manually. So, what if you can use Visio to drag and drop nodes, and connect relationships between them, adding names and properties on the fly, as you go? Then, what if you could review your diagram, and then upload all of the nodes and edges to the database automatically? This process could be repeated on many pages, so that the data gets merged together in the graph database. The Visio pages can also be saved and remain available as a record of input, should any questions arise.
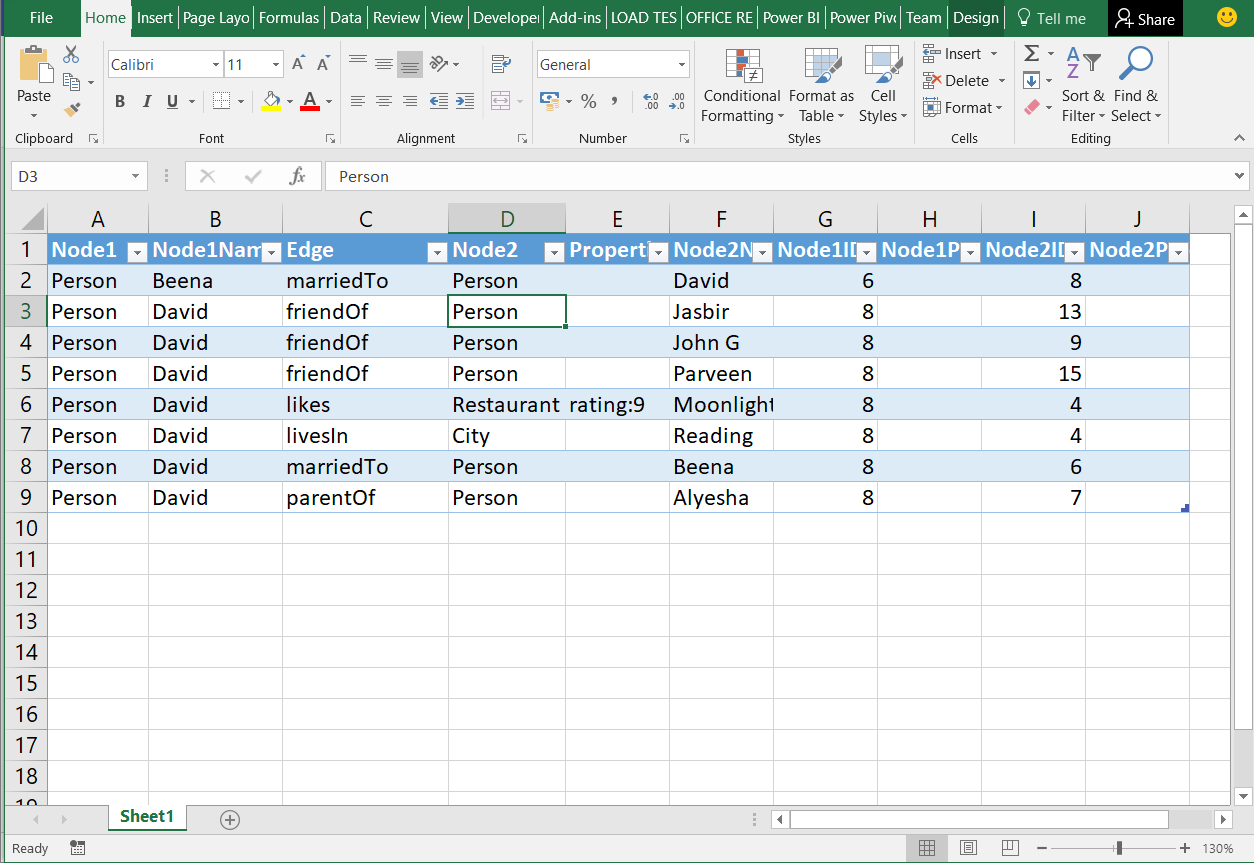
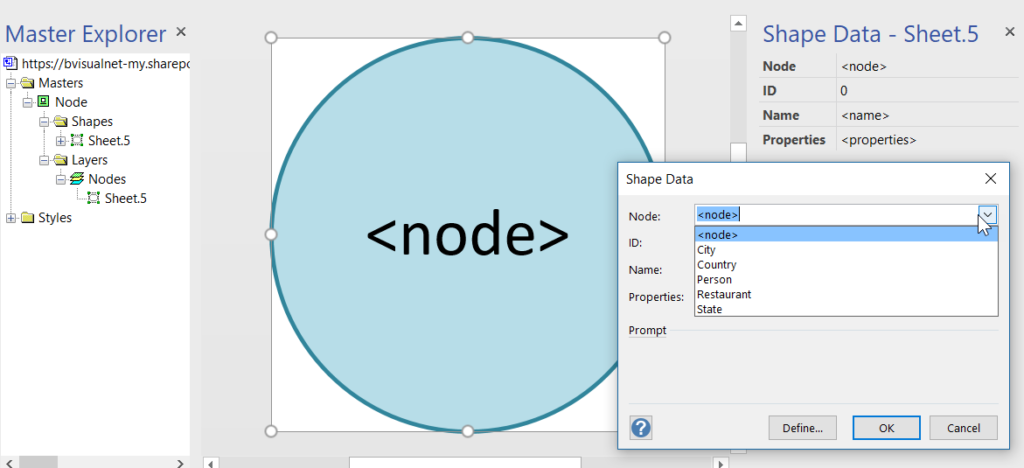
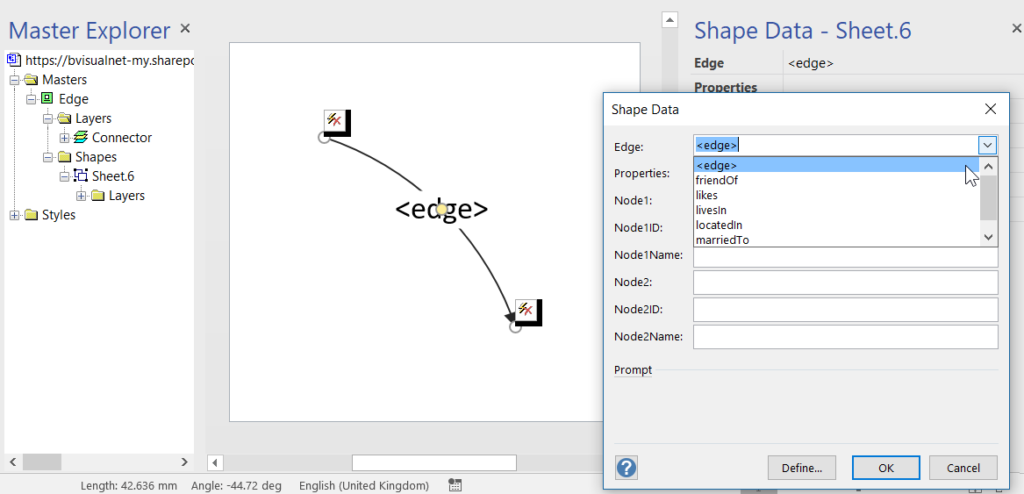
These new graph tables contain special column types that cannot be used directly by either PowerBI or Visio, so it is necessary to create views of the tables, thus effectively hiding them. I have a slight issue with the graphdemo database in the Microsoft article because it has extra columns on some Node and Edge tables. To me, this seems a little impure, and I think that the Node tables should only have an ID, Name and Properties column in addition to the Node columns, and the Edge tables should only have a Properties column in addition to the Edge columns. Ideally, the Properties columns in both tables should hold JSON data as text.
Anyway, I decided to create a proof of concept with just the basic Node and Edge attributes first. I also extended the sample database a little so I could have a bit more complexity. I decided to forget about using nice icons for now, and just keep it simple!
PowerApps in PowerBI with Visio!!!
I am very excited to see that the preview for PowerApps in PowerBI has been released ( see Announcing availability of PowerApps custom visual for Power BI (preview) ). I saw this demonstrated months ago, and have been waiting impatiently ever since. Every time I have embedded a Visio diagram into PowerBI, I have wanted to display the selected shape data in a detail view … and now I can!
I cannot yet create a PowerBI report with the embedded PowerApps visual for consumption by the whole internet, but it should still solve many scenarios for organisations. I quickly added the new PowerApps visual to my example synchronised Org Chart and Desk Layout from my previous article ( #Visio in #PowerBI for viewing personnel hierarchies and locations ) , and recorded a simple selection in the following gif:
To do this, I simply created a default new PowerApps app from the queryOrg query in Excel workbook I created previously, and modified the Item value for the DetailForm of the DetailScreen. I removed the BrowseScreen and EditScreen because they were not required. Then, hey presto, the correct record is displayed whenever a shape is selected.