• Skip to main content
  • Skip to primary sidebar
  • Skip to footer

bVisual

  • Home
  • Services
    • How Visio smartness can help your business
    • Visio visual in Power BI
    • Visio Consulting Services
    • Visio Bureau Services
    • Visio Training and Support Services
  • Products
    • Visio Shape Report Converter
    • SS Plus
    • LayerManager
    • visViewer
    • Metro Icons
    • Rules Tools for Visio
    • The Visio 2010 Sessions App
    • Multi-Language Text for Visio
    • Document Imager for Visio
    • multiSelect for Visio
    • pdSelect for Visio
  • Case Studies
    • Case studies overview
    • Using Visio in Education for GIS
    • Visualizing Construction Project Schedules
    • Visio Online Business Process Mapping
    • Nexans Visio Template
    • CNEE Projects, WorldCom
    • Chase Manhattan Bank
  • News
    • Recent news
    • News archive
  • Resources
    • Articles➡
      • ShapeSheet Functions A-Z
      • Comparing Visio for the Web and Desktop
      • Customising Visio Shapes for the Web App
      • Key differences between the Visio desktop and web apps
      • Using the Visio Data Visualizer in Excel
      • Using Visio in Teams
      • Creating Visio Tabs and Apps for Teams with SharePoint Framework (SPFx)
      • Designing Power Automate Flows with Microsoft Visio
      • Innovative uses of Visio Lists
    • Webcasts ➡
      • Visio in Organizations
      • My session and other Visio sessions at MSIgnite 2019
      • Power up your Visio diagrams
      • Vision up your Visio diagrams
      • The Visio 2010 MVP Sessions
    • Visio Web Learning Resources
    • Books➡
      • Visualize Complex Processes with Microsoft Visio
      • Mastering Data Visualization with Microsoft Visio
      • Microsoft Visio Business Process Diagramming and Validation
      • Visualizing Information with Microsoft Visio
  • Blog
    • Browse blog articles
    • Visio Power BI articles
    • Visio for Web articles
    • A history of messaging and encryption
  • About us
    • About bVisual
    • Testimonials
    • Bio of David Parker
    • Contact Us
    • Website Privacy Policy
    • Website terms and conditions
    • Ariba Network

Power Platform

Published on September 25, 2018 by David Parker

Visio Roadmap @ MSIgnite 2018

VisioRoadmap2018

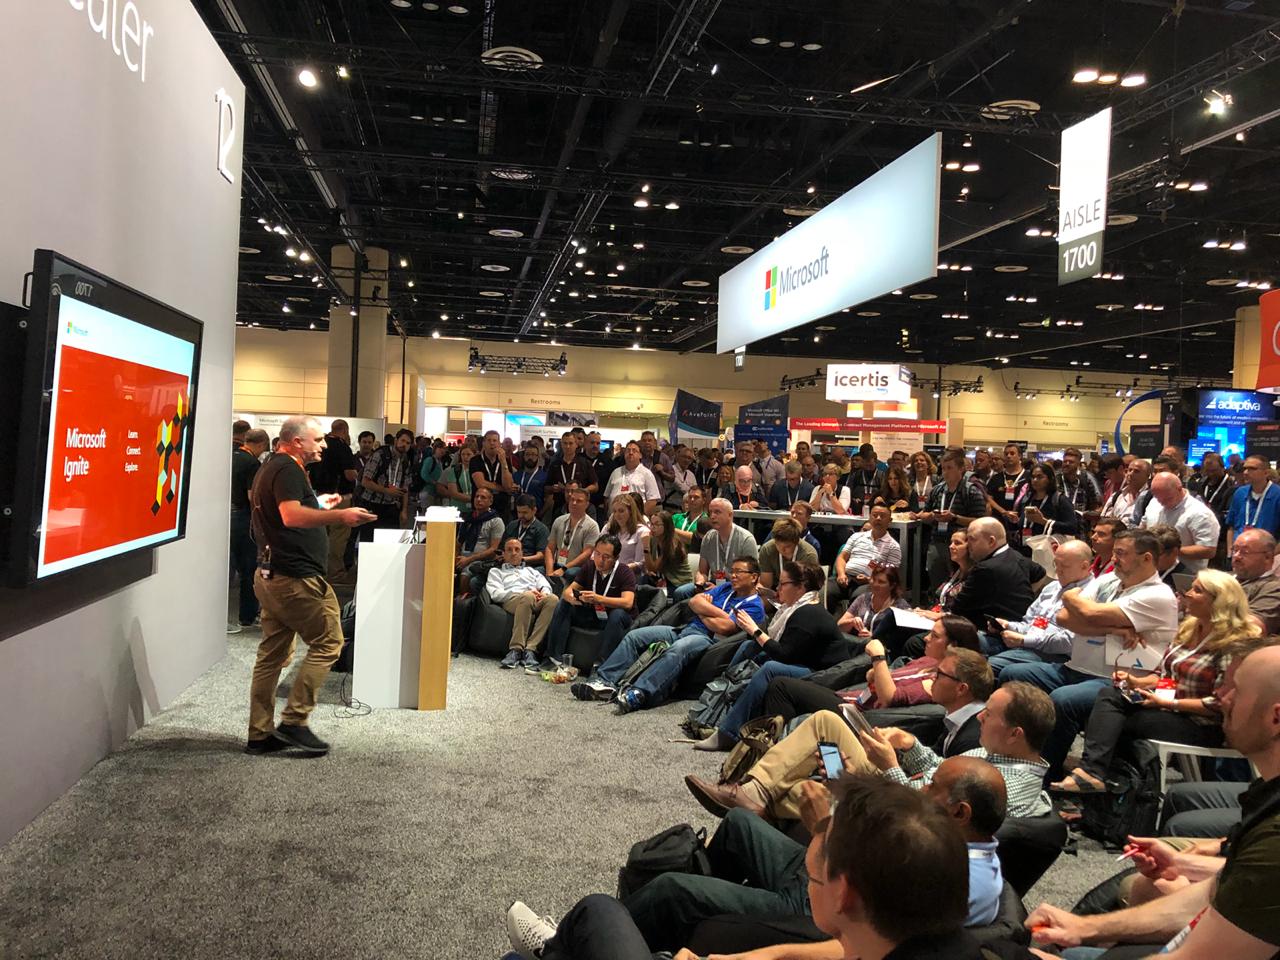
The first slot of the day at the furthest away room from the main conference area is not the ideal time to present anything, but those attendees that made it saw how many new features have been added to Visio recently, and what is soon to be added. The session recording should be available soon, but for those who can’t wait, here is a spoiler! ( View the session here )

[Read more…] about Visio Roadmap @ MSIgnite 2018

Filed Under: Azure, Excel, MSFlow, MSIgnite, Office 365, Teams, Visio, Visio Online Tagged With: Roadmap

Published on September 25, 2018 by David Parker

My session @ MSIgnite about Visio and PowerBI

Well, that is the first day of MSIgnite over, and I am looking forward to hearing more about the roadmap for Visio today. I presented my session yesterday in a theater that seats 50 but 1,000 had registered for. In the end, the space was so full, I had no idea how many were there, but it was a lot! ( View my session on YouTube / View a 360 image)

DJP_Session_Action


I will be on the Visio booth now for a lot of the time during the conference, so please come talk to me about the possibilities of Visio solutions and integration with other Office applications and Office365. Microsoft have some cool demos of Visio / 3D Mixed Reality, Visio / MSFlow and, of course, Visio / PowerBI.
My book publishers have kindly provided some discounts for the duration of the conference:

  • eBook Discount: 50%Code – MDVMP50
  • Print Discount: 15%Code – MDVMP15
  • Valid until September 30th 2018
  • Go to packtpub.com

In addition, we will be offering the chance to win a copy of mine and Scott Helmers’ book “Microsoft Visio 2016 Step by Step” on the booth.

Filed Under: MSIgnite, PowerBI, Visio 2016, Visio Online Tagged With: MSIgnite, PowerBI, Visio

Published on June 5, 2018 by David Parker

Data Centre Racks in Visio in PowerBI

I have often diagrammed rack and cabinet layouts and elevations using Visio linked to a database or Excel tables. There is a Rack Diagram template in Visio which is great for manually creating cabinet elevations manually, but there is nothing currently out of the box to automate this process, so it can be a laborious task unless you have some custom code. It is quite simple to draw a computer room layout of the racks and cabinets and to link each one to a row of data. In this article, I have a table of rack equipment in Excel, and used PowerQuery in PowerBI to summarize these rows for each data center, rack and U height position, since there are sometimes more than one item of equipment per U height. In this example, I have color coded the criticality of each equipment such that the most important display as red, and the least important as green. This means that a PowerBI user can quickly see where the critical racks, U heights and equipment are. Of course, I could have used any metric, such as power consumption, heat output or humidity, for the colour-coding. It all depends on the data available, and the audience for the report.

[Read more…] about Data Centre Racks in Visio in PowerBI

Filed Under: Network Diagrams, PowerBI, Visio Tagged With: Excel, PowerQuery, Shape Data

Published on April 30, 2018 by David Parker

Icons Sets and Data Bars in PowerBI Visio visual

I really enjoy linking data to Visio diagrams, either directly or using the Visio custom visual in Power BI. This visual has the ability to display PowerQuery data as text or color, but not as icons or data bars. These last two features are something that can be used natively in Visio, and automatically updated in Visio Online. I have previously urged Microsoft to add these abilities to the Visio custom visual in Power BI, but there is no sign of it appearing just yet. The custom visual actually removes any Data Graphics ( Text Callouts, Icon Sets, Data Bars or Color by Value) that may already exist in a Visio diagram when it is embedded into Power BI. This reduces the number of shapes in the visual (there is currently a low limit) and, in any case, the data should be displayed from Power BI.
I want to be able to display some data as icons and data bars within the Visio diagram, so what is the alternative? Fortunately, there is a way using text symbol characters and the wonderful Power Query formulas!

[Read more…] about Icons Sets and Data Bars in PowerBI Visio visual

Filed Under: Excel, mFormula, PowerBI, Visio, Visio 2016

Published on February 23, 2018 by David Parker

Visio Automation for IT Design & Operations – London, 25th April 2018

I am pleased to announce that I will be co-hosting a free event at the new Microsoft Reactor in Shoreditch on 25th April, aimed at showcasing Visio automation for IT design & operations. You can find more details and sign up here.

Filed Under: PowerBI, Visio, Visio Online, Visio Pro for Office365 Tagged With: Automation, Event

Published on February 12, 2018 by David Parker

Using Visio and PowerBI with GraphDatabase in SQLServer – Part 2

In my last article, I described how Visio can be used to input Nodes & Edges into a SQL Server graph tables (see Using #Visio and #PowerBI with #GraphDatabase in #SQLServer). In this article, I show how PowerBI can be used to create an Excel table that can then be used to automatically create a Visio diagram. This diagram can then be enhanced for reports and presentations, or used to check the validity of nodes and relationships. The shapes can then be used to update or delete edges and nodes in the database.

[Read more…] about Using Visio and PowerBI with GraphDatabase in SQLServer – Part 2

Filed Under: Graph Database, PowerBI, SQL Server, Visio, Visio 2016 Tagged With: Excel, GraphDatabase

  • « Go to Previous Page
  • Page 1
  • Page 2
  • Page 3
  • Page 4
  • Page 5
  • Go to Next Page »

Primary Sidebar

  • LinkedIn
  • Twitter

Recent Posts

  • Fixing dimensions of 2D shapes
  • Merging Linked Data from Similar Tables
  • Smart Radio Buttons and Check Boxes in Visio
  • Using Button Face Ids in Visio
  • Grid Snapping Revisited

Categories

Tags

Accessibility Add-Ins Connectors Containers Data Export Data Graphics Data Import Data Visualizer Educational Excel GraphDatabase Hyperlinks Icon Sets JavaScript LayerManager Layers Legend Link Data to Shapes Lists MSIgnite MVP Office365 Org Chart PowerApps PowerBI PowerQuery Processes Setup and Deployment Shape Data Shape Design ShapeSheet ShapeSheet Functions SharePoint 2013 SQL Teams Validation VBA Video Visio Visio 2007 Visio for the Web Visio Online Visio Services Visio Viewer Webinar

Footer

bVisual Profile

The UK-based independent Visio consultancy with a worldwide reach. We have over 25 years experience of providing data visualization solutions to companies around the globe.

Learn more about bVisual

  • Amazon
  • E-mail
  • Facebook
  • LinkedIn
  • Twitter
  • YouTube

Search this website

Recent posts

  • Fixing dimensions of 2D shapes
  • Merging Linked Data from Similar Tables
  • Smart Radio Buttons and Check Boxes in Visio
  • Using Button Face Ids in Visio
  • Grid Snapping Revisited

Copyright © 2025 · Executive Pro on Genesis Framework · WordPress · Log in